

Increased carbonylation of the lipid phosphatase PTEN contributes to Akt2 activation in a murine model of early alcohol-induced steatosis
- PMID: 23872024
- PMCID: PMC3859727
- DOI: 10.1016/j.freeradbiomed.2013.07.011
Increased carbonylation of the lipid phosphatase PTEN contributes to Akt2 activation in a murine model of early alcohol-induced steatosis
Abstract
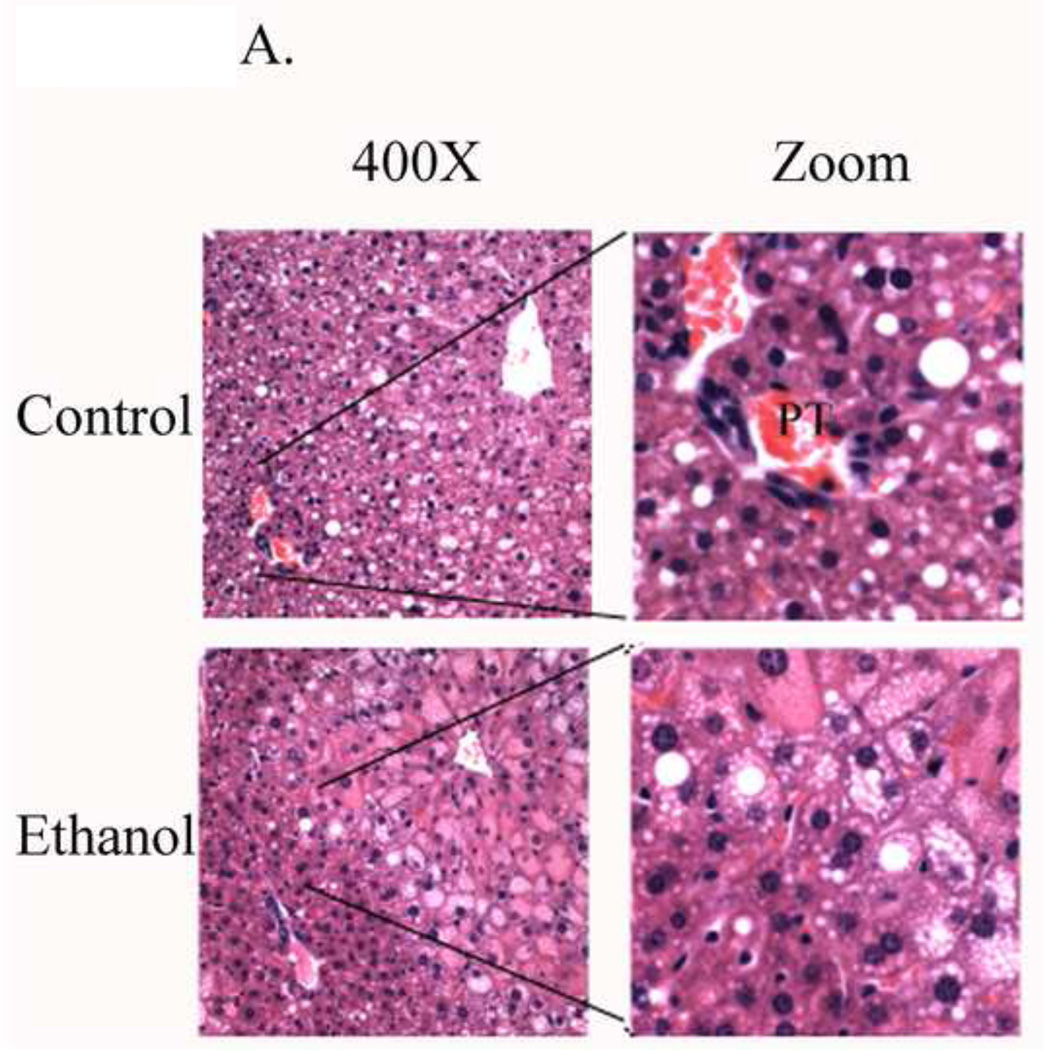
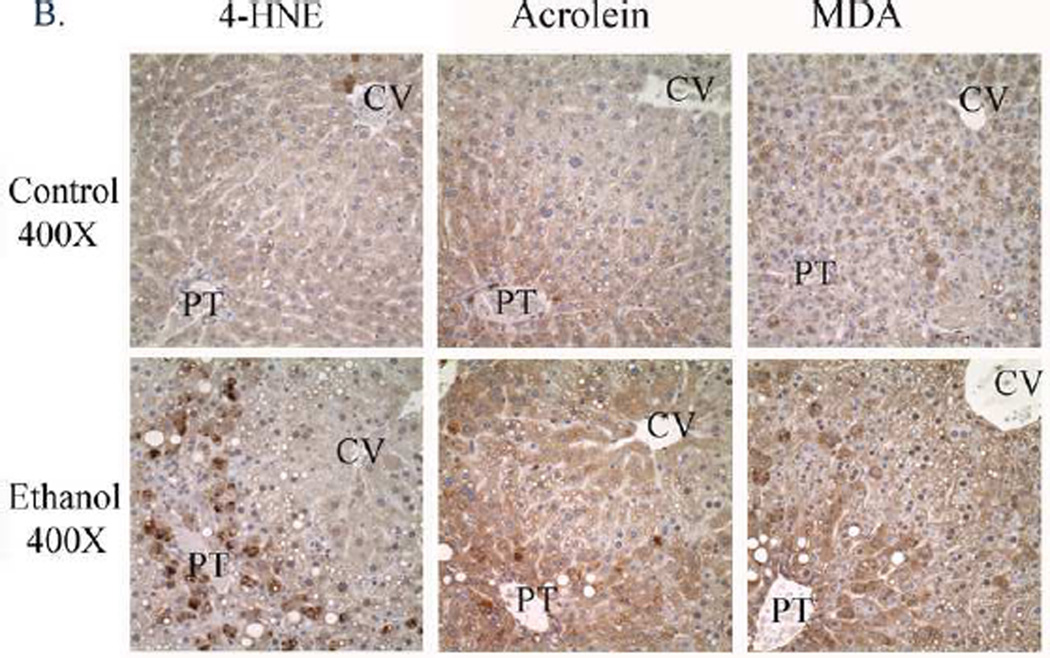
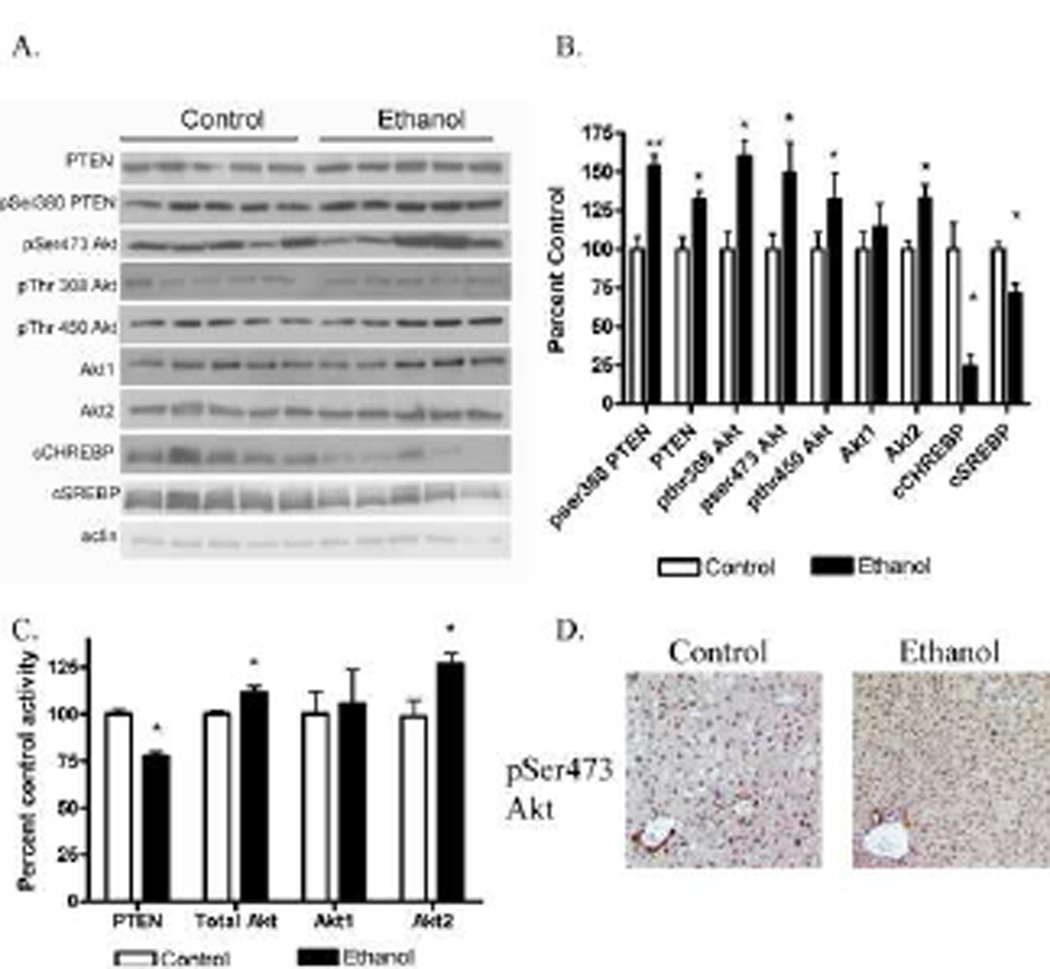
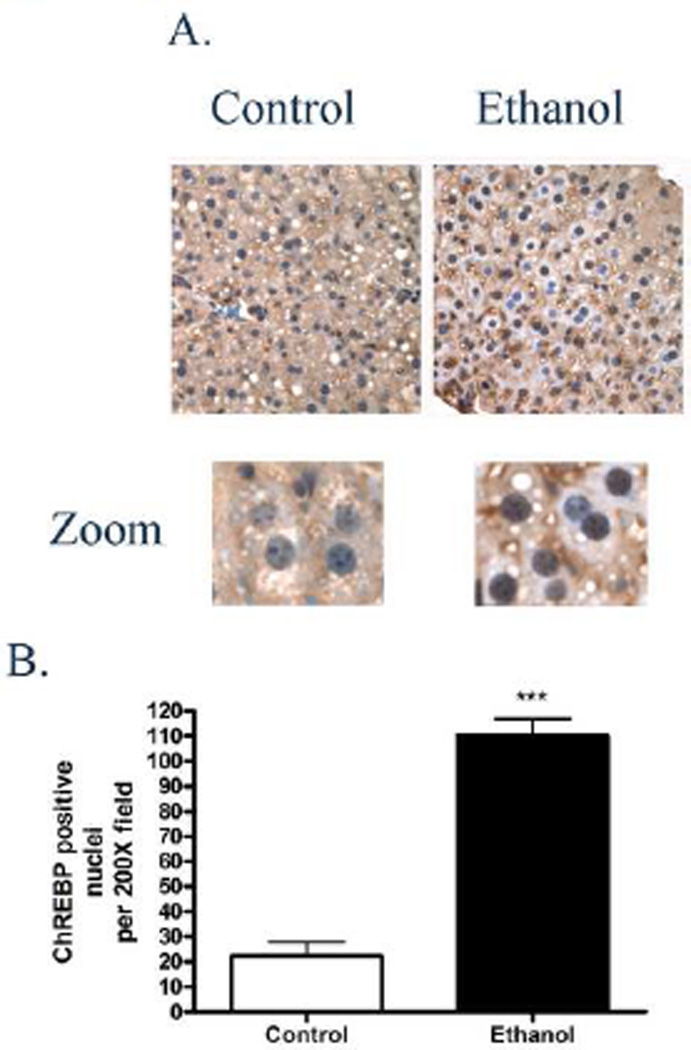
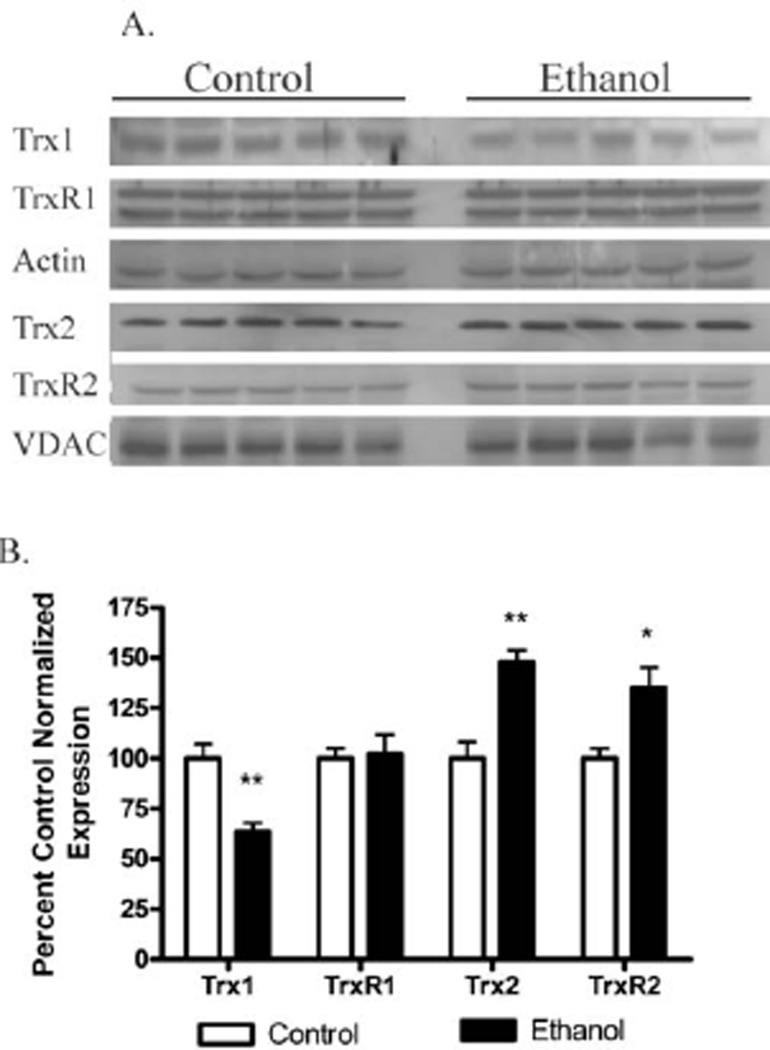
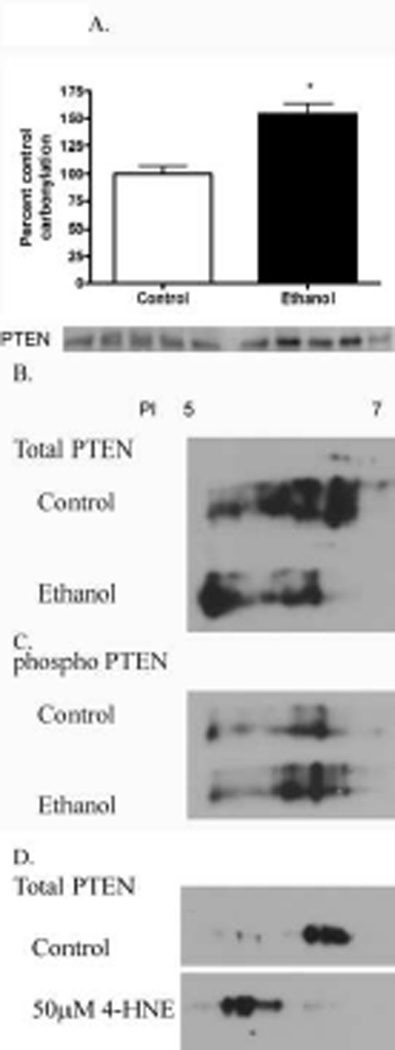
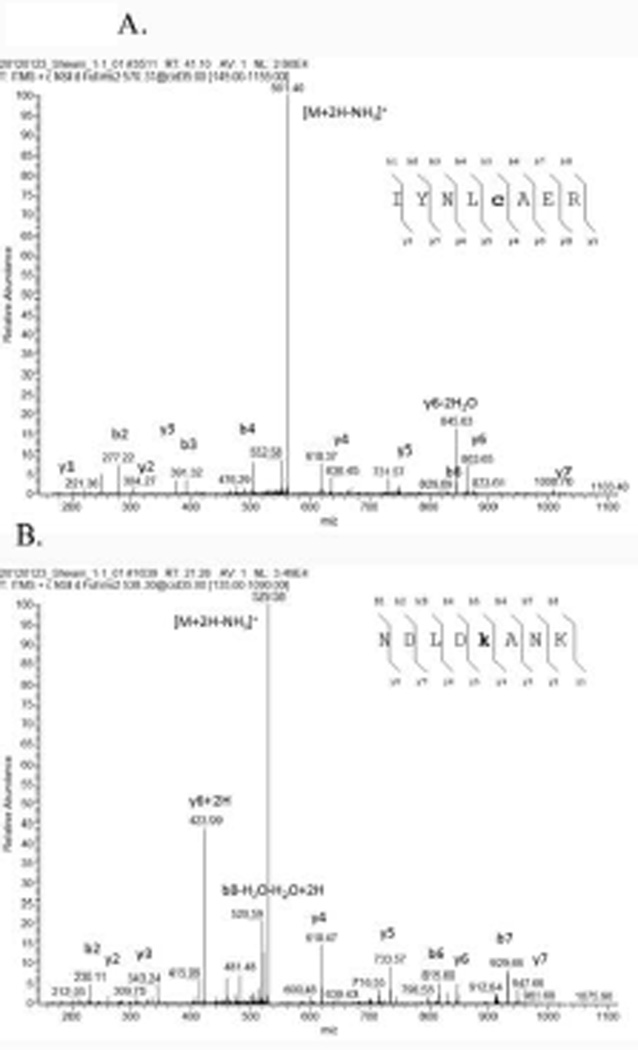
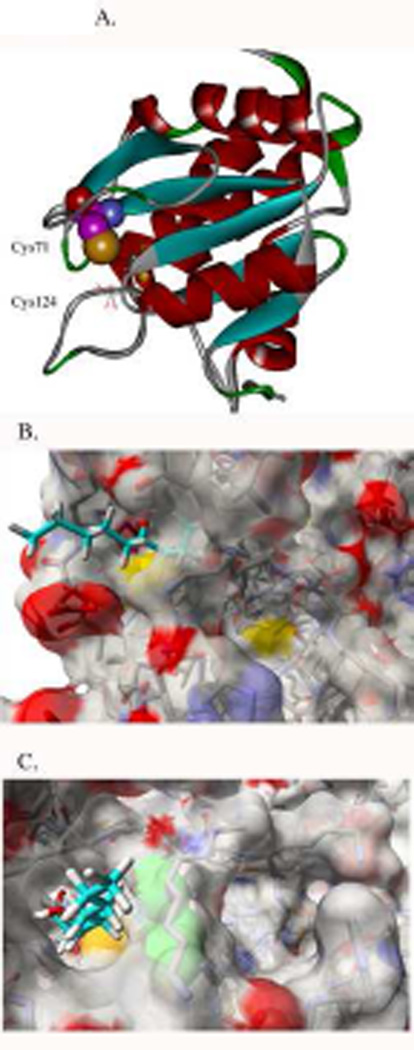
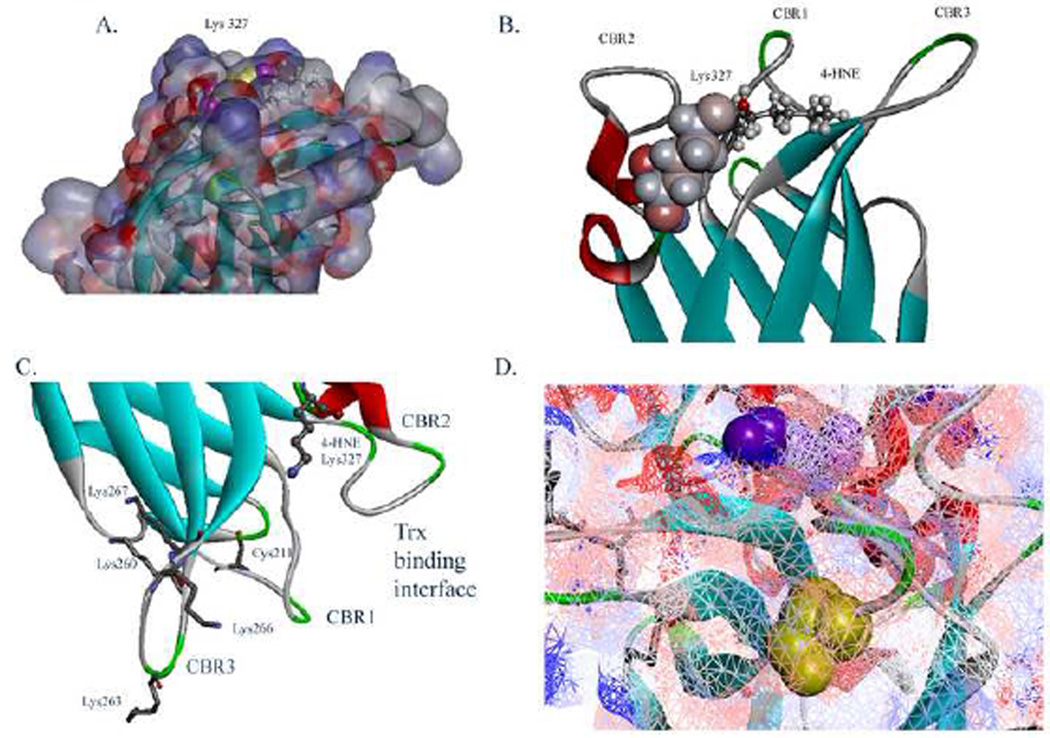
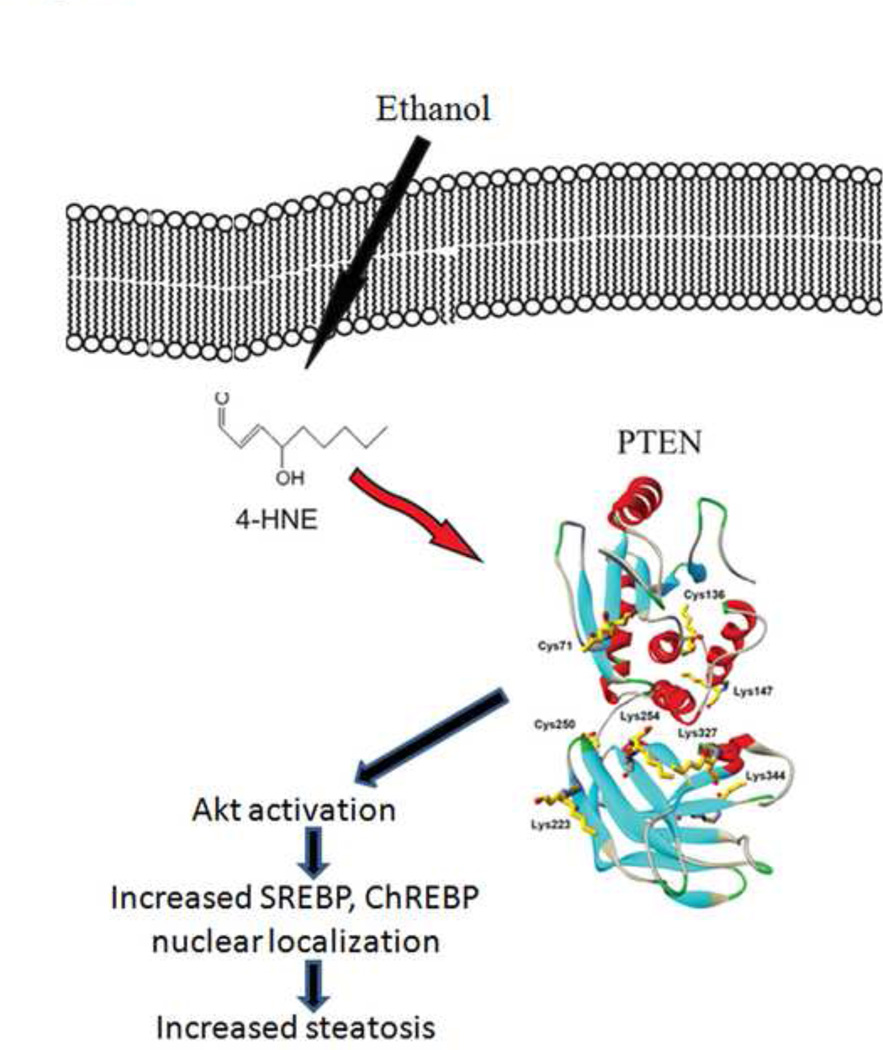
The production of reactive aldehydes such as 4-hydroxynonenal (4-HNE) is a key event in the pathogenesis of alcoholic liver disease (ALD), which ranges from simple steatosis to fibrosis. The lipid phosphatase PTEN plays a central role in the regulation of lipid metabolism in the liver. In this study, the effects of chronic ethanol feeding and carbonylation on the PTEN signaling pathway were examined in a 9-week mouse feeding model for ALD. Chronic ethanol consumption resulted in altered redox homeostasis as evidenced by decreased GSH, decreased Trx1, and increased GST activity. Both PTEN expression and PTEN phosphorylation were significantly increased in the livers of ethanol-fed mice. Carbonylation of PTEN increased significantly in the ethanol-fed mice compared to pair-fed control animals, corresponding to decreased PTEN 3-phosphatase activity. Concomitantly, increased expression of Akt2 along with increased Akt phosphorylation at residues Thr(308), Thr(450), and Ser(473) was observed resulting in increased Akt2 activity in the ethanol-fed animals. Akt2 activation corresponded to a decrease in cytosolic SREBP and ChREBP. Subsequent LC/MS/MS analysis of 4-HNE-modified recombinant human PTEN identified Michael addition adducts of 4-HNE on Cys(71), Cys(136), Lys(147), Lys(223), Cys(250), Lys(254), Lys(313), Lys(327), and Lys(344). Computational-based molecular modeling analysis of 4-HNE adducted to Cys(71) near the active site and Lys(327) in the C2 domain of PTEN suggested inhibition of enzyme catalysis via either stearic hindrance of the active-site pocket or prevention of C2 domain-dependent PTEN function. We hypothesize that 4-HNE-mediated PTEN inhibition contributes to the observed activation of Akt2, suggesting a possible novel mechanism of lipid accumulation in response to increased reactive aldehyde production during chronic ethanol administration in mice.
Keywords: 4-HNE; 4-hydroxy-2-nonenal; ALD; ALT; Alcoholic liver disease; ChREBP; Free radicals; Lipid peroxidation; NASH; PI3K; PTEN; PTP; PtdIns(3,4,5)P(3); SREBP; Steatosis; Trx; TrxR; alanine aminotransferase; alcoholic liver disease; carbohydrate response element-binding protein; nonalcoholic steatohepatitis; phosphatase and tensin homolog deleted on chromosome 10; phosphatidylinositol 3,4,5-trisphosphate; phosphatidylinositol 3-kinase; protein tyrosine phosphatase; sterol-response element-binding protein; thioredoxin; thioredoxin reductase.
Copyright © 2013 Elsevier Inc. All rights reserved.
Figures
Similar articles
-
Identification of 5' AMP-activated kinase as a target of reactive aldehydes during chronic ingestion of high concentrations of ethanol.J Biol Chem. 2014 May 30;289(22):15449-62. doi: 10.1074/jbc.M113.543942. Epub 2014 Apr 10. J Biol Chem. 2014. PMID: 24722988 Free PMC article.
-
Liver-Specific Deletion of Phosphatase and Tensin Homolog Deleted on Chromosome 10 Significantly Ameliorates Chronic EtOH-Induced Increases in Hepatocellular Damage.PLoS One. 2016 Apr 28;11(4):e0154152. doi: 10.1371/journal.pone.0154152. eCollection 2016. PLoS One. 2016. PMID: 27124661 Free PMC article.
-
Phosphatase and tensin homolog deleted on chromosome 10 (PTEN) inhibition by 4-hydroxynonenal leads to increased Akt activation in hepatocytes.Mol Pharmacol. 2011 Jun;79(6):941-52. doi: 10.1124/mol.110.069534. Epub 2011 Mar 17. Mol Pharmacol. 2011. PMID: 21415306 Free PMC article.
-
n-3 Polyunsaturated fatty acids for the management of alcoholic liver disease: A critical review.Crit Rev Food Sci Nutr. 2019;59(sup1):S116-S129. doi: 10.1080/10408398.2018.1544542. Epub 2018 Dec 22. Crit Rev Food Sci Nutr. 2019. PMID: 30580553 Review.
-
Overview of lipid peroxidation products and hepatic protein modification in alcoholic liver disease.Chem Biol Interact. 2011 Jun 30;192(1-2):107-12. doi: 10.1016/j.cbi.2011.02.021. Epub 2011 Feb 24. Chem Biol Interact. 2011. PMID: 21354120 Free PMC article. Review.
Cited by
-
4-Hydroxynonenal activates Src through a non-canonical pathway that involves EGFR/PTP1B.Free Radic Biol Med. 2015 Dec;89:701-7. doi: 10.1016/j.freeradbiomed.2015.08.025. Epub 2015 Oct 8. Free Radic Biol Med. 2015. PMID: 26453921 Free PMC article.
-
Lack of relationship between PTEN 32-bp and TP53 16-bp Ins/Del polymorphisms and chronic hepatitis B virus infection.Virusdisease. 2017 Sep;28(3):289-294. doi: 10.1007/s13337-017-0391-7. Epub 2017 Aug 22. Virusdisease. 2017. PMID: 29291215 Free PMC article.
-
Chronic ethanol consumption induces mitochondrial protein acetylation and oxidative stress in the kidney.Redox Biol. 2015 Dec;6:33-40. doi: 10.1016/j.redox.2015.06.021. Epub 2015 Jul 6. Redox Biol. 2015. PMID: 26177469 Free PMC article.
-
Identification of 5' AMP-activated kinase as a target of reactive aldehydes during chronic ingestion of high concentrations of ethanol.J Biol Chem. 2014 May 30;289(22):15449-62. doi: 10.1074/jbc.M113.543942. Epub 2014 Apr 10. J Biol Chem. 2014. PMID: 24722988 Free PMC article.
-
Deletion of GSTA4-4 results in increased mitochondrial post-translational modification of proteins by reactive aldehydes following chronic ethanol consumption in mice.Redox Biol. 2016 Apr;7:68-77. doi: 10.1016/j.redox.2015.11.013. Epub 2015 Nov 27. Redox Biol. 2016. PMID: 26654979 Free PMC article.
References
-
- Seki S, Kitada T, Yamada T, Sakaguchi H, Nakatani K, Wakasa K. In situ detection of lipid peroxidation and oxidative DNA damage in non-alcoholic fatty liver diseases. J Hepatol. 2002;37:56–62. - PubMed
-
- Seki S, Kitada T, Sakaguchi H. Clinicopathological significance of oxidative cellular damage in non-alcoholic fatty liver diseases. Hepatol Res. 2005;33:132–134. - PubMed
-
- Li CJ, Nanji AA, Siakotos AN, Lin RC. Acetaldehyde-modified and 4- hydroxynonenal-modified proteins in the livers of rats with alcoholic liver disease. Hepatology. 1997;26:650–657. - PubMed
-
- Hartley DP, Petersen DR. Co-metabolism of ethanol, ethanol-derived acetaldehyde, and 4-hydroxynonenal in isolated rat hepatocytes. Alcohol Clin Exp Res. 1997;21:298–304. - PubMed
Publication types
MeSH terms
Substances
Grants and funding
LinkOut - more resources
Full Text Sources
Other Literature Sources
Medical
Research Materials
Miscellaneous
