. 2013 Oct 1:254:50-64.
doi: 10.1016/j.bbr.2013.07.005. Epub 2013 Jul 16.

Hippocampal and subicular efferents and afferents of the perirhinal, postrhinal, and entorhinal cortices of the rat

Affiliations

Hippocampal and subicular efferents and afferents of the perirhinal, postrhinal, and entorhinal cortices of the rat

Kara L Agster et al. Behav Brain Res. .

Abstract

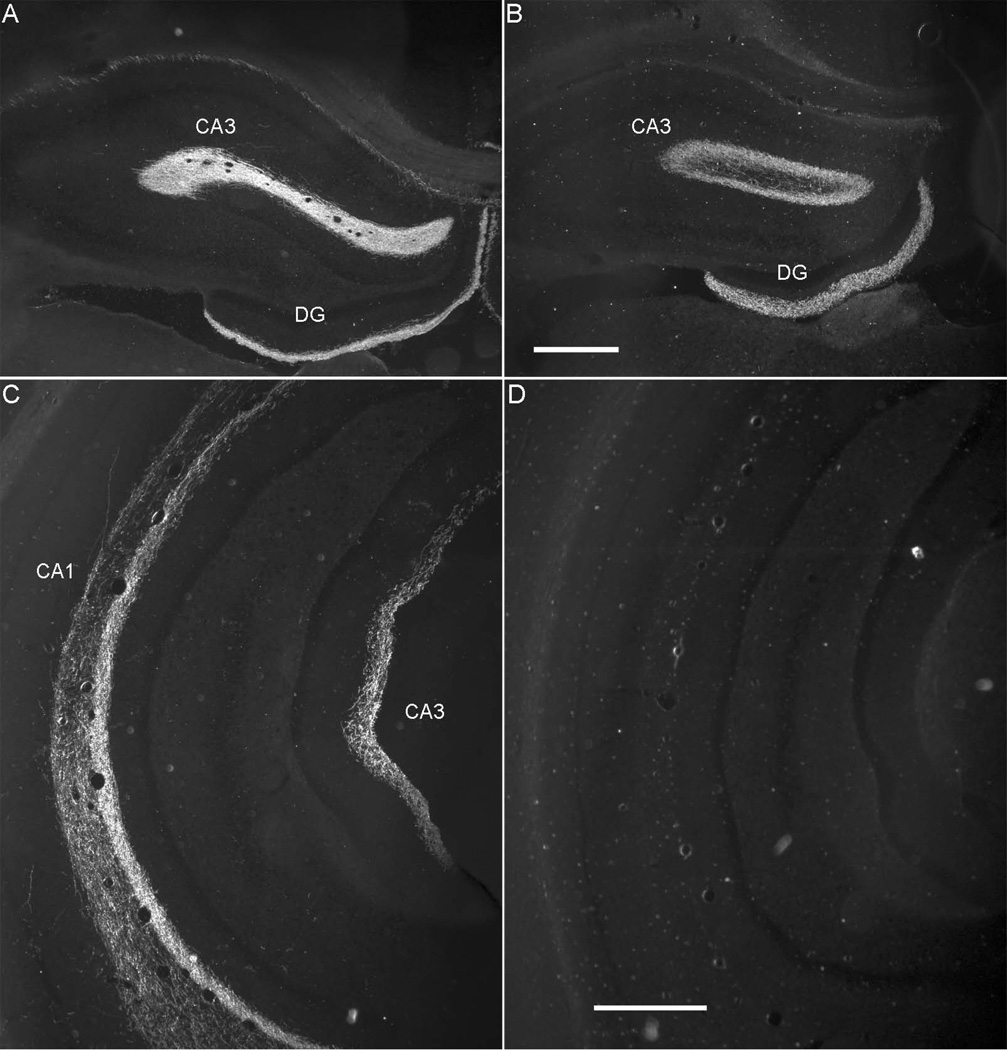
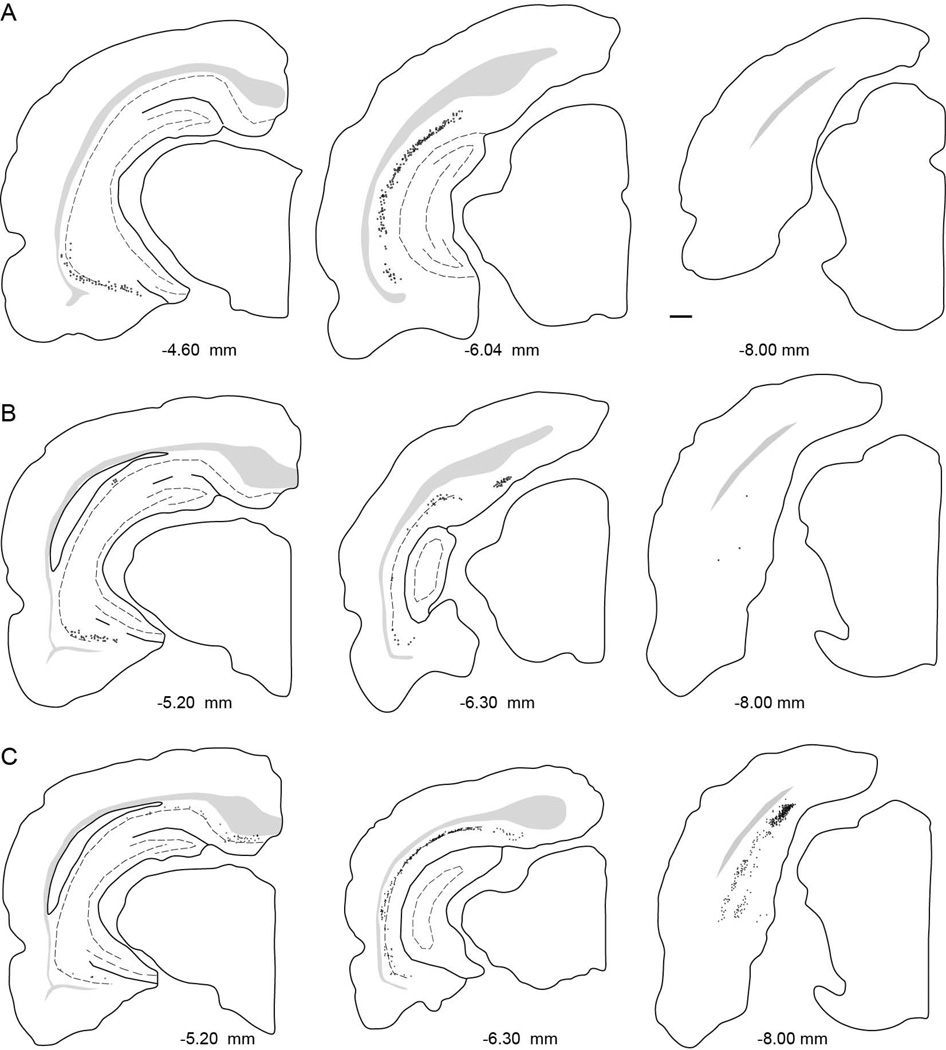
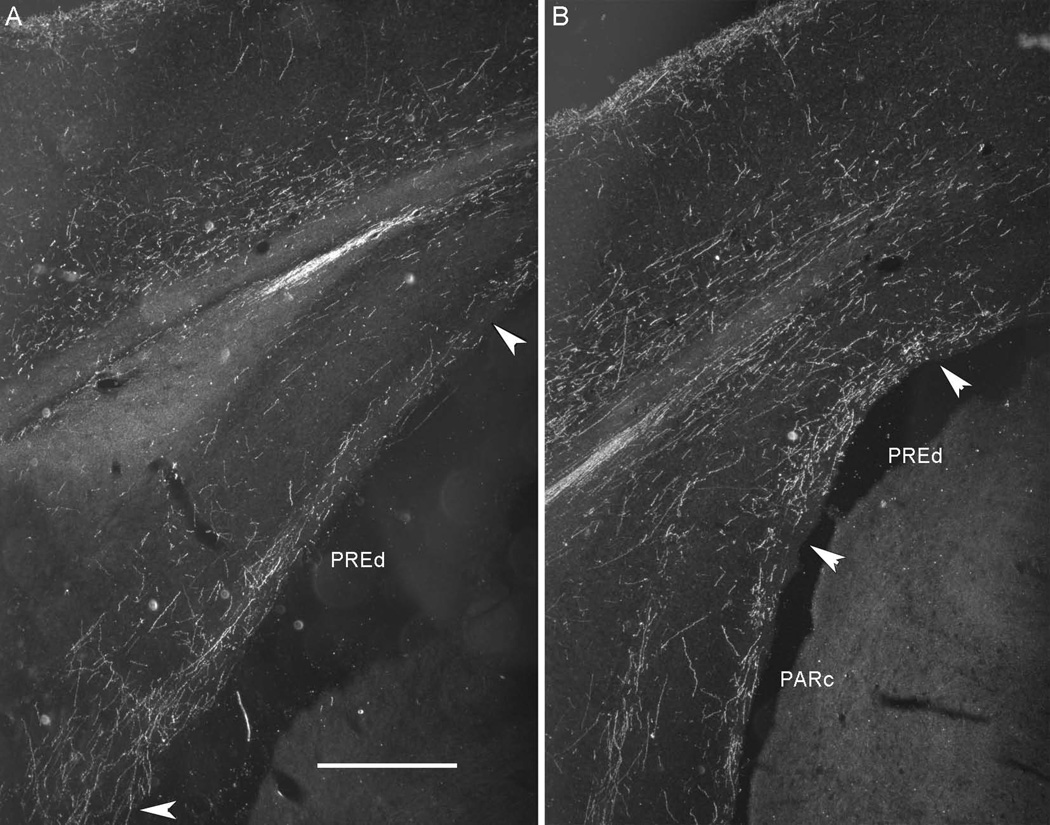
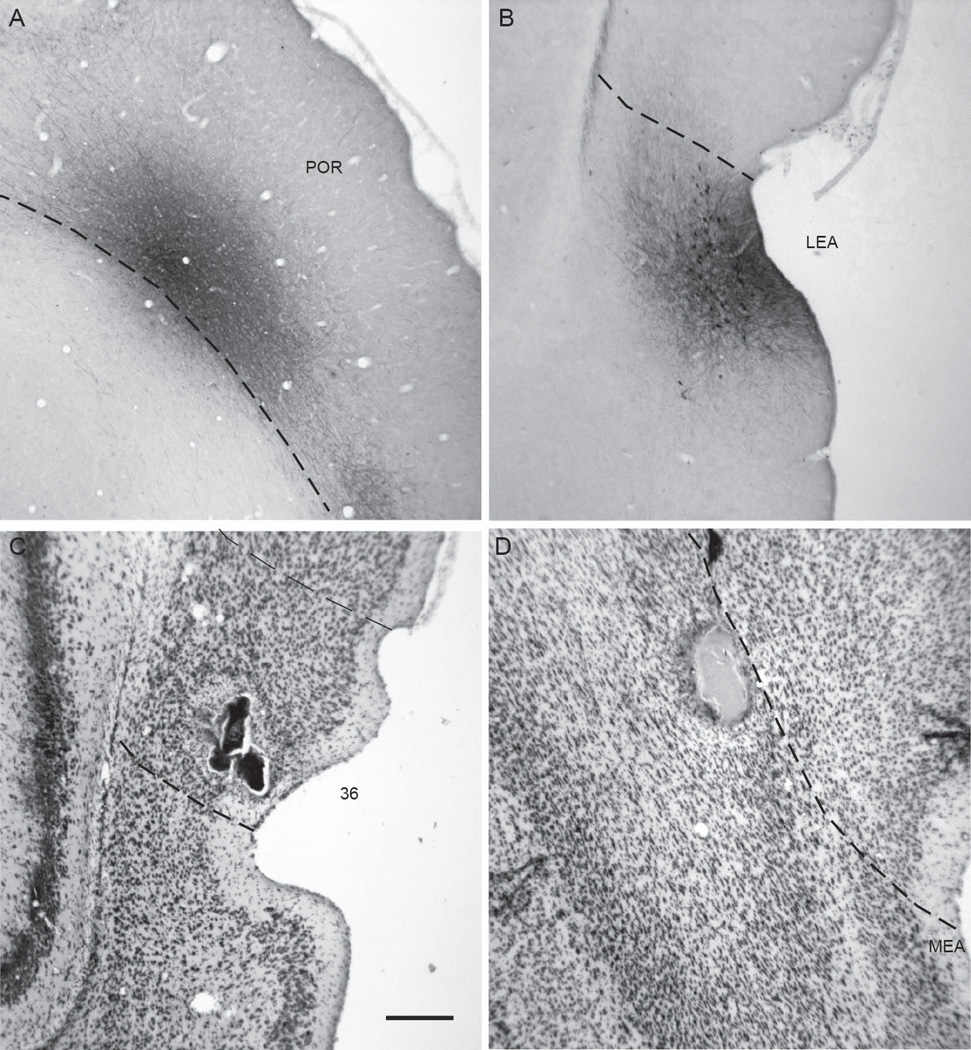
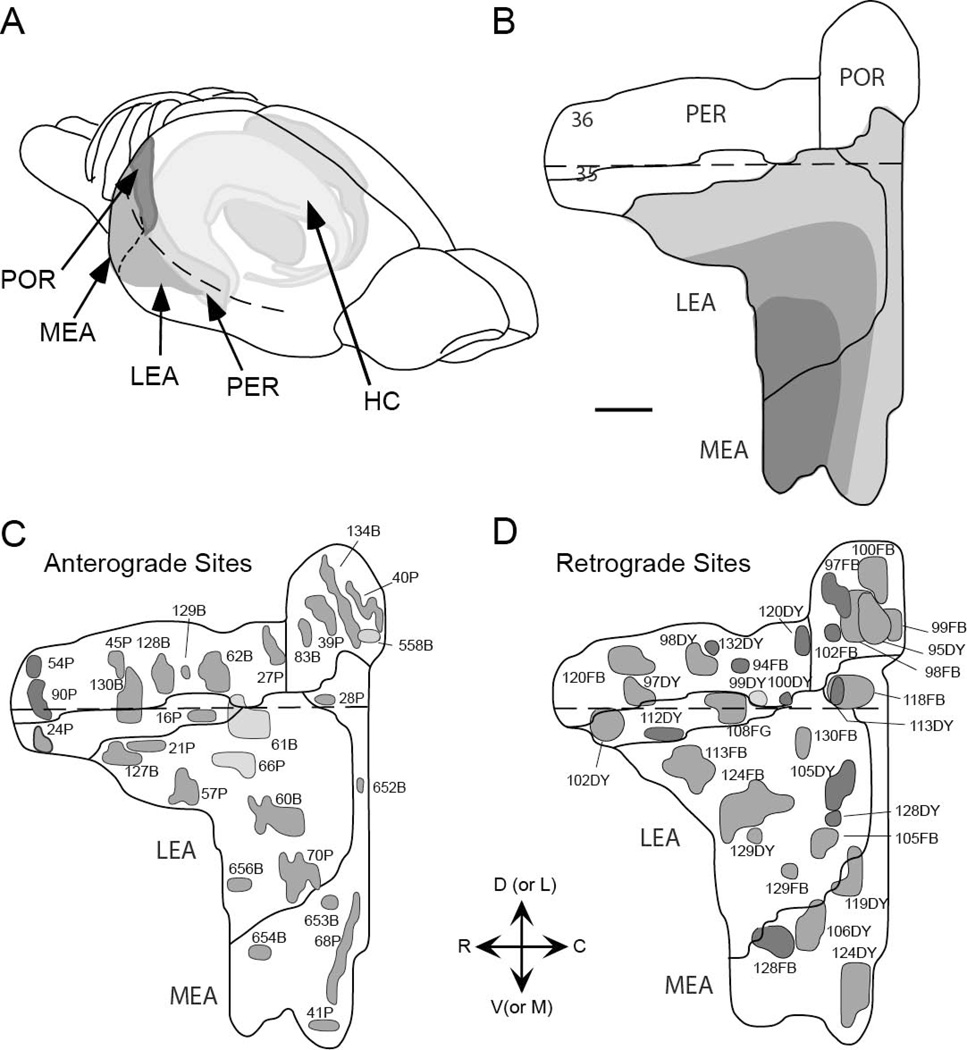
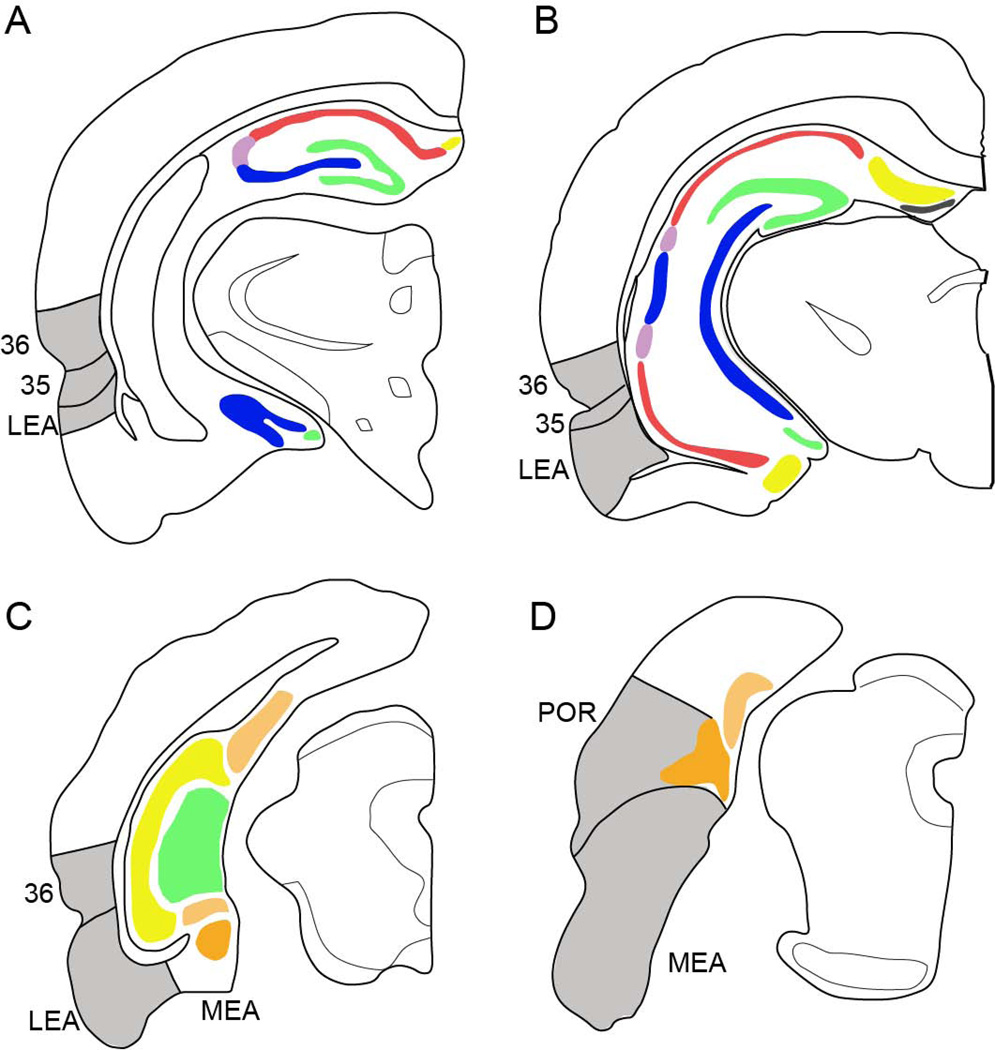
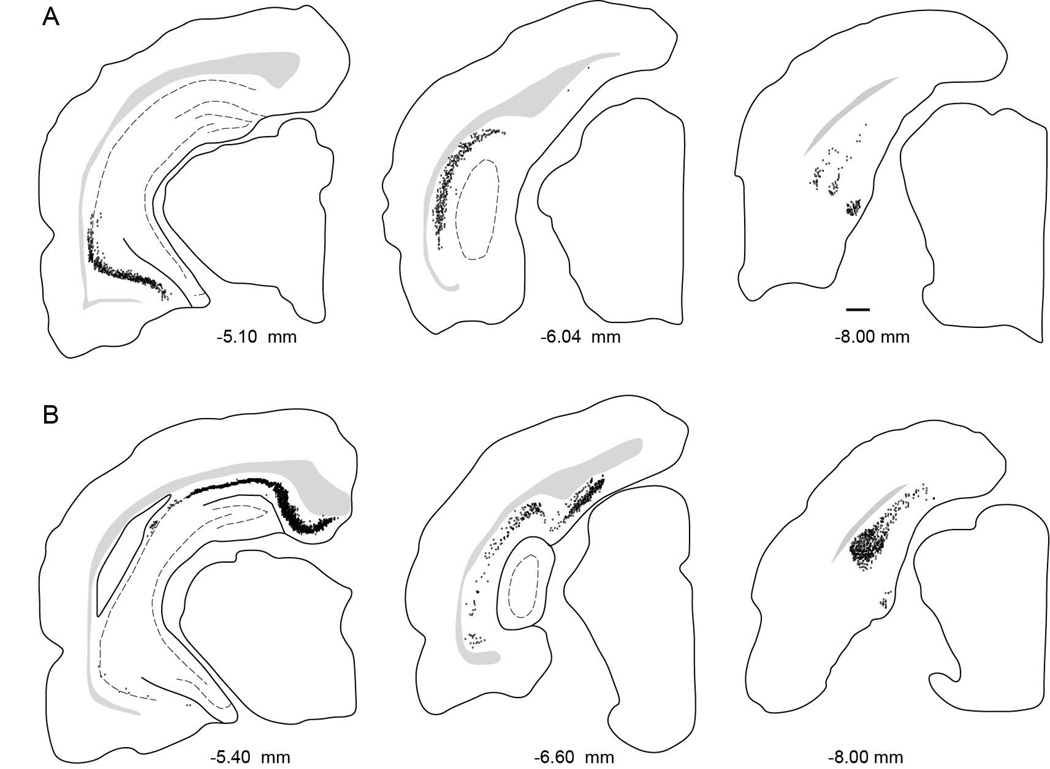
Available evidence suggests there is functional differentiation among hippocampal and parahippocampal subregions and along the dorsoventral (septotemporal) axis of the hippocampus. The aim of this study was to characterize and compare the efferent and afferent connections of perirhinal areas 35 and 36, postrhinal cortex, and the lateral and medial entorhinal areas (LEA and MEA) with dorsal and ventral components of the hippocampal formation (dentate gyrus, hippocampus cornu ammonis fields, and subiculum) as well as the presubiculum, and the parasubiculum. The entorhinal connections were also characterized with respect to the LEA and MEA dentate gyrus-projecting bands. In general, the entorhinal connections with the hippocampal formation are much stronger than the perirhinal and postrhinal connections. The entorhinal cortex projects strongly to all components of the hippocampal formation, whereas the perirhinal and postrhinal cortices project weakly and only to CA1 and the subiculum. In addition, the postrhinal cortex preferentially targets the dorsal CA1 and subiculum, whereas the perirhinal cortex targets ventral subiculum. Similarly, the perirhinal cortex receives more input from ventral hippocampal formation structures and the postrhinal cortex receives more input from dorsal hippocampal structures. The LEA and the MEA medial band are more strongly interconnected with ventral hippocampal structures, whereas the MEA lateral band is more interconnected with dorsal hippocampal structures. With regard to the presubiculum and parasubiculum, the postrhinal cortex and the MEA lateral band receive stronger input from the dorsal presubiculum and caudal parasubiculum. In contrast, the LEA and MEA medial bands receive stronger input from the ventral presubiculum and rostral parasubiculum.

Keywords: Anterograde; Dentate gyrus; Hippocampal formation; Parahippocampal region; Retrograde.


Conflict of interest statement

Conflict of interest

The authors declare no conflicts of interest.

Figures

Figure 1
Figure 1
Hippocampal and parahippocampal target regions. Panels A and B show the locations of the dentate gyrus (green), hippocampal fields CA3 (blue), CA2 (light purple), CA1 (red), and subiculum (yellow). Panels C and D also the dentate gyrus and parahippocampal region structures, the presubiculum (light orange) and parasubiculum (dark orange) are shaded with hatch marks. PER, POR, LEA, and MEA are shown in grey.
Figure 2
Figure 2
Location of the retrograde and anterograde tracer injection sites to the perirhinal, postrhinal, and entorhinal cortices. Injection sites are represented on two-dimensional unfolded maps of the cortical regions. Dark grey tones indicate injection sites to deep layers of cortex, medium grey tones indicate injection sites that span deep and superficial layers of cortex, and light grey tones are indicative of injection sites to superficial cortical layers. A. Retrograde tracer injection sites. B. Anterograde tracer injection sites. Dashed line in all panels represents the rhinal sulcus. Adapted from Burwell and Amaral, 1998. Scale bar = 1mm.
Figure 3
Figure 3
Examples of anterograde and retrograde tracer injection sites. Shown are a Pha-L site in POR, 40P at −8.1 mm relative to β (A), a biotinylated dextrane site in the LEA, 61B at −6.5 mm relative to β (B), a diamidino yellow site in PER area 36, 98DY at −5.1 mm relative to β (C), and a diamidino yellow site in the MEA, 124DY, at −7.8 mm relative to β (D). Scale bar: 500 microns.
Figure 4
Figure 4
Darkfield photomicrographs showing the distribution of fiber labeling in the dorsal presubiculum following an antergrade tracer injection to the postrhinal cortex (POR, Case 40P, −8.1 mm relative to β). The strongest projection from the POR terminated in the dorsal presubiculum (PREd). A. Fiber labeling in PREd at −7.0 mm from bregma. B. Fiber labeling in PREd at −8.0 mm from bregma. Scale bar: 500 microns.
Figure 5
Figure 5
Distribution of labeled cells arising from injection sites in PER area 35, PER area 36, and the POR. A. Computer generated plots showing the distribution of retrogradely-labeled cells in the hippocampus and subiculum, following tracer injection perirhinal area 35 (Case 112DY, −3.7 mm relative to β). B. Computer generated plots showing the distribution of retrogradely-labeled cells in the hippocampus and subiculum, following tracer injection in perirhinal area 36 (Case 98DY, −5.1 mm relative to β). C. Computer generated plots showing the distribution of retrogradely-labeled cells in the hippocampus and subiculum, following tracer injection postrhinal cortex (Case 98FB, −7.8 mm relative to β).
Figure 6
Figure 6
Darkfield photomicrographs showing the distribution of labeled fibers in the dorsal and ventral hippocampus following tracer injections to the lateral entorhinal area. A and C. Fiber labeling in dorsal (A) and ventral (C) hippocampal regions as a result of anterograde tracer injection to the lateral band of the LEA (Case 61B). B and D. Fiber labeling in dorsal (B) and ventral (D) hippocampal regions as a result of anterograde tracer injection to the lateral band of the MEA (Case 41P). Both injection sites were located in the lateral band, but only the LEA injection results in fiber labeling in ventral hippocampus. Scale bar: 500 microns.
Figure 7
Figure 7
Distribution of labeled cells arising from injection sites located in the LEA and MEA. Computer generated plots showing the distribution of retrogradely-labeled cells in the hippocampal and parahippocampal areas, following tracer injections. A. Computer-generated plots showing the distribution retrogradely-labeled cells in hippocampal structures arising from an LEA injection site (Case 124FB, −5.4 mm relative to β). B. L Computer-generated plots showing the distribution retrogradely-labeled cells in hippocampal structures arising from an MEA injection site (Case 113DY, −7.6 mm relative to β).

References

    1. Scoville WB, Milner B. Loss of recent memory after bilateral hippocampal lesions. J Neurol Neurosurg Psychiatry. 1957;20:11–21. - PMC - PubMed
    1. Scharfman HE, Witter MP. Preface for the parahippocampal region: Implications for neurological and psychiatric diseases. Ann N Y Acad Sci. 2000;911:ix–xiii. - PubMed
    1. Eichenbaum H, Yonelinas AP, Ranganath C. The medial temporal lobe and recognition memory. Annual review of neuroscience. 2007;30:123–152. - PMC - PubMed
    1. Squire LR, Stark CE, Clark RE. The medial temporal lobe. Annual review of neuroscience. 2004;27:279–306. - PubMed
    1. Burwell RD. The parahippocampal region: corticocortical connectivity. Ann N Y Acad Sci. 2000;911:25–42. - PubMed

Publication types