. 2013 Jul;25(7):2465-81.
doi: 10.1105/tpc.113.112391. Epub 2013 Jul 19.

A quantitative genetic basis for leaf morphology in a set of precisely defined tomato introgression lines

Affiliations

A quantitative genetic basis for leaf morphology in a set of precisely defined tomato introgression lines

Daniel H Chitwood et al. Plant Cell. 2013 Jul.

Abstract

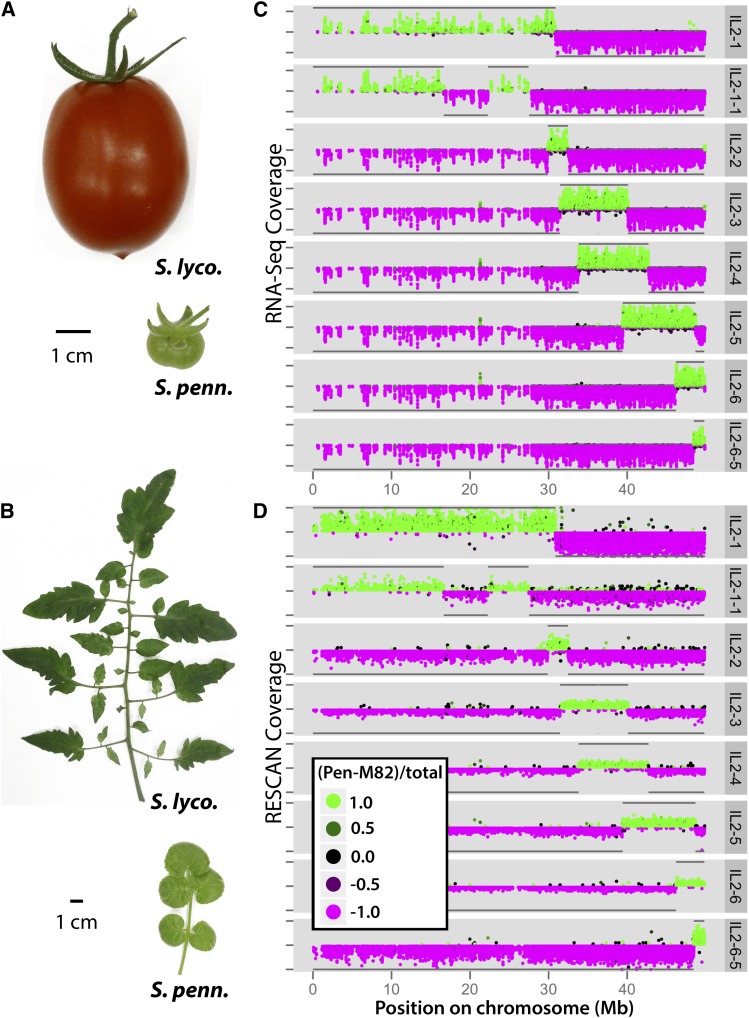
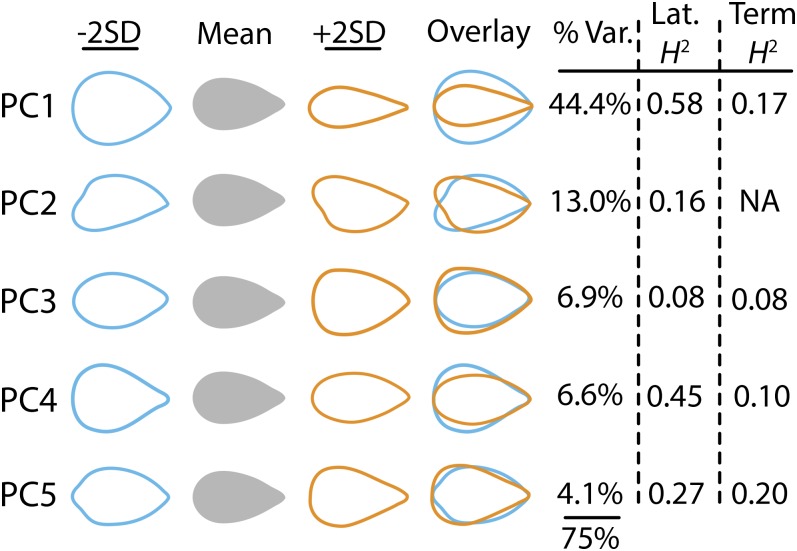
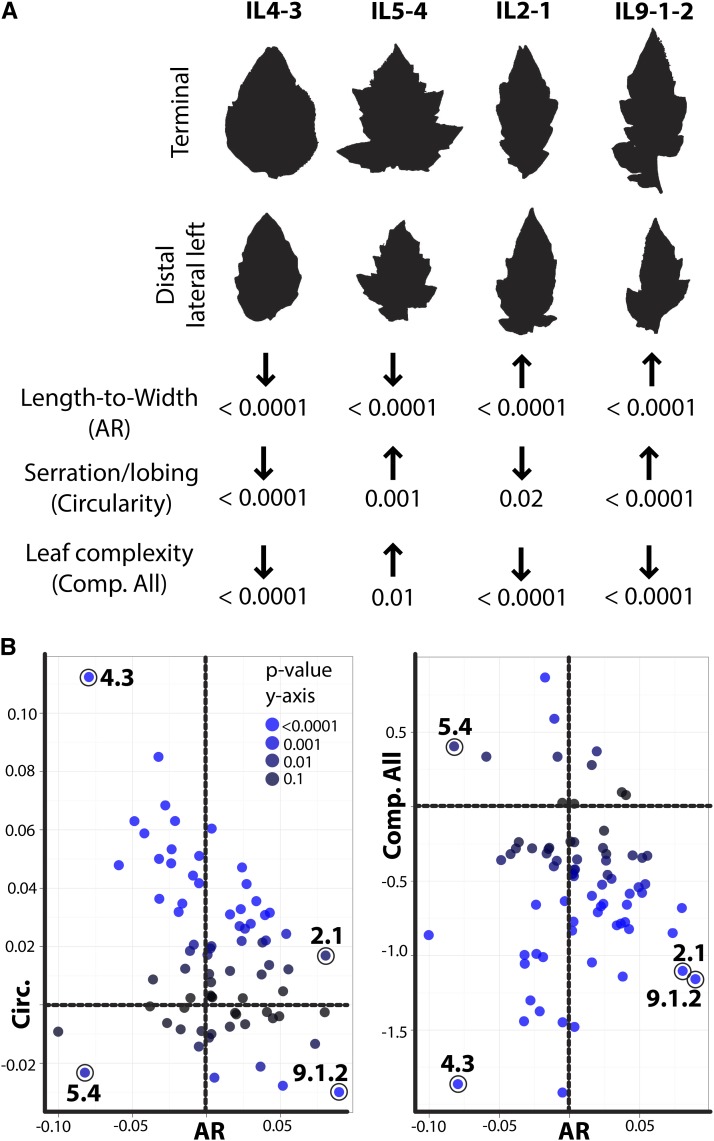
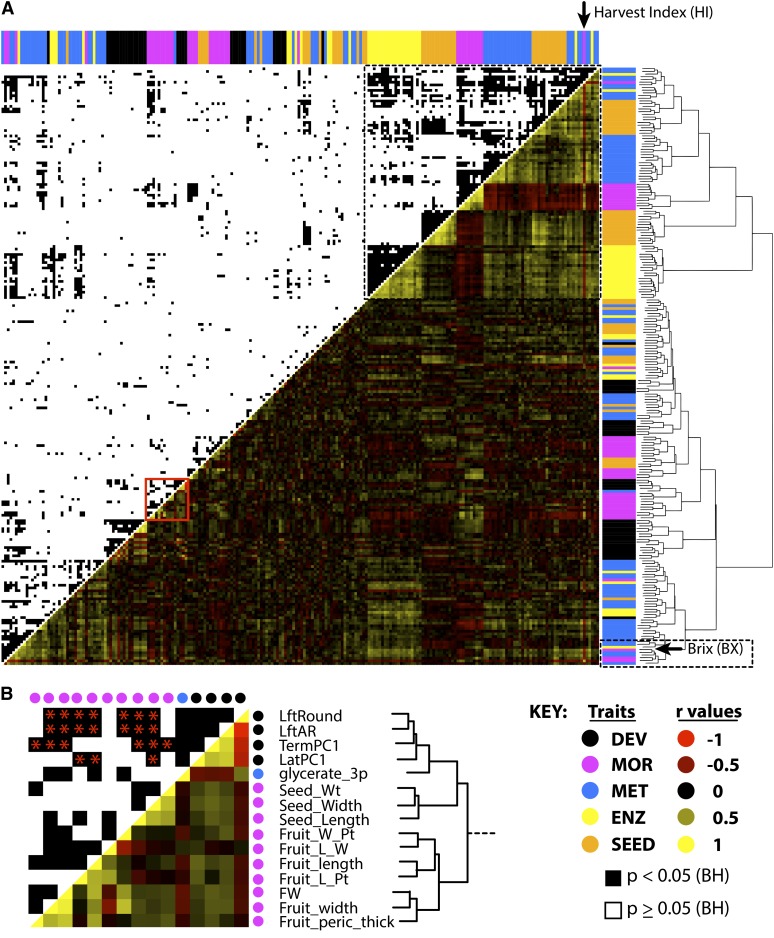
Introgression lines (ILs), in which genetic material from wild tomato species is introgressed into a domesticated background, have been used extensively in tomato (Solanum lycopersicum) improvement. Here, we genotype an IL population derived from the wild desert tomato Solanum pennellii at ultrahigh density, providing the exact gene content harbored by each line. To take advantage of this information, we determine IL phenotypes for a suite of vegetative traits, ranging from leaf complexity, shape, and size to cellular traits, such as stomatal density and epidermal cell phenotypes. Elliptical Fourier descriptors on leaflet outlines provide a global analysis of highly heritable, intricate aspects of leaf morphology. We also demonstrate constraints between leaflet size and leaf complexity, pavement cell size, and stomatal density and show independent segregation of traits previously assumed to be genetically coregulated. Meta-analysis of previously measured traits in the ILs shows an unexpected relationship between leaf morphology and fruit sugar levels, which RNA-Seq data suggest may be attributable to genetically coregulated changes in fruit morphology or the impact of leaf shape on photosynthesis. Together, our results both improve upon the utility of an important genetic resource and attest to a complex, genetic basis for differences in leaf morphology between natural populations.


Figures

Figure 1.
Figure 1.
Phenotypic Differences between IL Parents and RNA-Seq and RESCAN Data for Chromosome 2 ILs. Phenotypic differences in the fruit (A) and leaves (B) between domesticated tomato (S. lycopersicum) and a wild relative (S. pennellii). Beyond obvious differences in the size, shape, and color of fruits are differences in metabolite content. Leaves between these species vary in size, complexity, and shape and non-cell-autonomously provide the majority of photosynthate to fruits. Shown are the S. pennellii introgression regions for ILs covering chromosome 2 as determined by two methods: RNA-Seq (C) and RESCAN (D). The depth of coverage (distance from midpoint on y axis) and genotype (color and direction on y axis) of each SNP/indel is plotted against chromosomal position (x axis). Polymorphisms that match S. pennellii are colored green and plotted on the top half of each IL panel, while polymorphisms matching cv M82 are plotted in magenta in the bottom halves. The coloring is on a continuum such that the color approaches black as a position’s genotype approaches heterozygosity. The y axis tick marks indicate depths of coverage ranging from 0 to 100 (C) or 0 to 20 (D). Subsequent to genotyping, introgression boundaries consistent between the RNA-Seq and RESCAN analyses were delineated. Using these breakpoints, S. pennellii and cv M82 regions are summarized by horizontal lines at the top and bottom of each IL panel, respectively.
Figure 2.
Figure 2.
Principal Components Resulting from an Elliptical Fourier Descriptor Analysis of Field Leaflet Shapes. Shown are the first five PCs, explaining 75% of all shape variance from >11,000 field-grown leaflets. Given is the percentage of variance in shape each PC explains and the heritability values of each PC, for lateral (Lat) and terminal (Term) leaflets. PC1 explains a large amount of all shape variance (44.4%) and relates to the length-to-width ratio of leaflets (similar to LftAR). PC2 (13.0%) explains asymmetry relating to the sampling of left and right distal lateral leaflets, which on average are mirror images of each other. The remaining PCs explain shape variance relating to the proximal-distal distribution of blade outgrowth along the leaflet. For all PCs, heritability is greater in the distal lateral leaflets relative to the terminal leaflet. PCs vary in heritability, and the most heritable PCs are 1 and 4. NA, not applicable.
Figure 3.
Figure 3.
Leaflet Shape, Serration, and Leaf Complexity Are Genetically Distinct Components. (A) Representative leaflets from ILs with significant shape QTL. Given are the direction and significance of length-to-width ratio change relative to cv M82 (AR), serration/lobing (circularity), and leaf complexity. Note that despite considerable accumulated genetic evidence suggesting otherwise, these features do not follow each other, and different ILs exhibit different combinations of these traits. (B) Graphs demonstrating the breaking between AR, circularity (Circ.), and complexity (Comp.). In each graph, AR is on the x axis for comparison showing IL values for circularity and complexity on the y axis. Colors indicate significance of trait deviations for the y axis. [See online article for color version of this figure.]
Figure 4.
Figure 4.
Relationship between Leaf Morphology and Previously Measured IL Traits. (A) Hierarchical clustering of leaf traits with previously studied traits. DEV (black), leaf development traits from this study; MOR (magenta), whole-plant, yield, and reproductive morphological traits as described by Schauer et al. (2006, ; MET (blue), metabolic traits described in the same studies; ENZ (yellow), enzymatic activities, as measured by Steinhauser et al. (2011); SEED (orange), seed metabolites, as described by Toubiana et al. (2012). Hierarchical clustering is based on absolute correlation values, with red denoting negative Pearson correlation coefficients and yellow positive. The top half of the plot shows significant correlations (<0.05) between traits after global multiple test adjustment, indicated in black. Trait identities are indicated as a marginal rug plot along the sides of the graph. The large group of highly correlated traits (in the top right-hand corner, indicated by the dotted line) is consistent with previous reports of negative correlation between MOR traits (including harvest index, [HI], indicated by an arrow) with fruit metabolite levels. DEV traits cluster away from this previously described relationship and closely associate with Brix, plant weight, and mono- and disaccharide levels, indicated by the dotted lined box toward the bottom of the graph. A more detailed view of the hierarchical clustering is found in Supplemental Figure 50 online. (B) Detailed analysis of the clustering reveals unexpected whole-plant relationships between traits. For example, LftAR, LftRound, and PC1 (all highly heritable traits describing leaflet length-to-width ratio) most closely cluster with traits relating to the dimensions of seeds and fruit, suggesting that the morphology of disparate organ types is regulated by common genetic elements. Relevant significant correlations, as multiple test–adjusted for the traits shown, are shown with red asterisks. The traits represented in (B) are indicated in (A) by a red box.
Figure 5.
Figure 5.
An Association between Photosynthetic Gene Expression and Leaf Morphology. (A) Hierarchical clustering of traits and gene expression profiles in the vegetative apex measured across the 76 ILs. Gene expression profiles across ILs were regressed against traits and only those genes with at least one significant correlation with a trait were considered. Colors indicate significant correlation after multiple test adjustment with a gene expression profile and the class to which the correlated trait belongs (DEV, black/white; MOR, magenta; MET, blue; ENZ, yellow; and SEED, orange). One cluster of genes (indicated by an asterisk) significantly correlate with numerous DEV traits related to leaf development. (B) Gene Ontology enrichment analysis of the gene group with an asterisk reveals numerous significant categories related to photosynthesis.

Comment in

References

    1. Abramoff M.D., Magelhaes P.J., Ram S.J. (2004). Image processing with ImageJ. Biophotonics International 11: 36–42
    1. Bailey I.W., Sinnott E.W. (1915). A botanical index of Cretaceous and Tertiary climates. Science 41: 831–834 - PubMed
    1. Barkoulas M., Galinha C., Grigg S.P., Tsiantis M. (2007). From genes to shape: Regulatory interactions in leaf development. Curr. Opin. Plant Biol. 10: 660–666 - PubMed
    1. Baxter C.J., Carrari F., Bauke A., Overy S., Hill S.A., Quick P.W., Fernie A.R., Sweetlove L.J. (2005). Fruit carbohydrate metabolism in an introgression line of tomato with increased fruit soluble solids. Plant Cell Physiol. 46: 425–437 - PubMed
    1. Benjamini Y., Hochberg Y. (1995). Controlling the false discovery rate: A practical and powerful approach to multiple testing. J. R. Stat. Soc. B 57: 289–300

Publication types

MeSH terms