

Intragenomic heterogeneity of 16S rRNA genes causes overestimation of prokaryotic diversity
- PMID: 23872556
- PMCID: PMC3811346
- DOI: 10.1128/AEM.01282-13
Intragenomic heterogeneity of 16S rRNA genes causes overestimation of prokaryotic diversity
Abstract
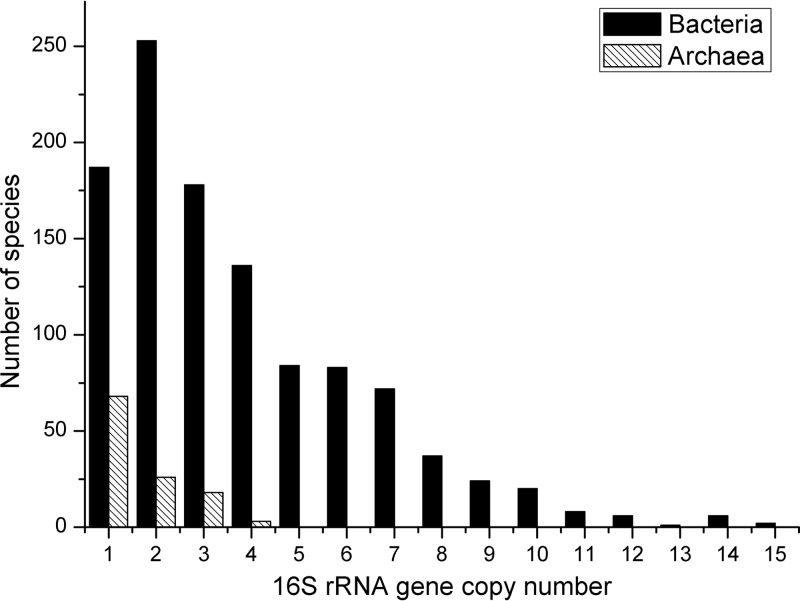
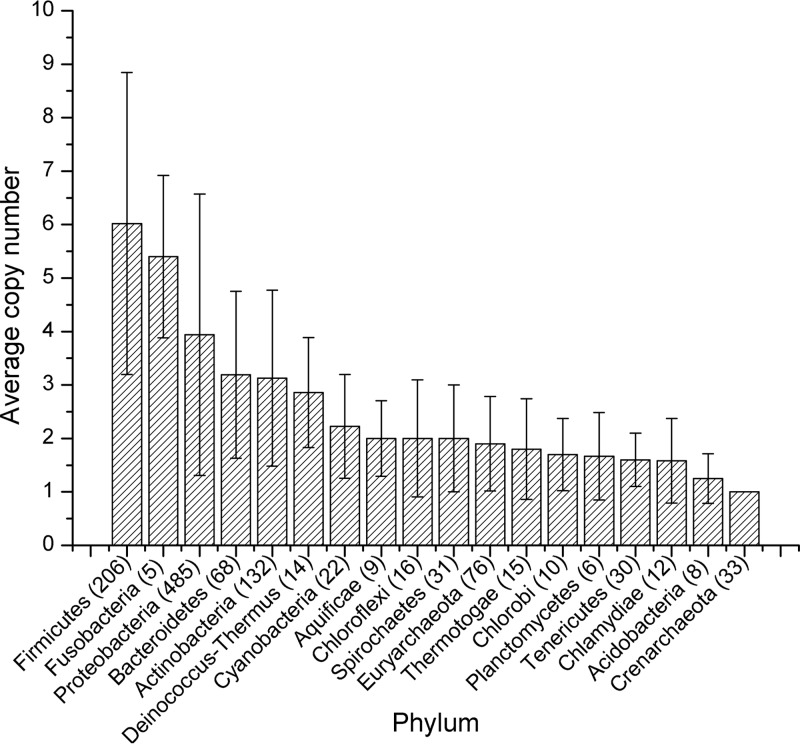
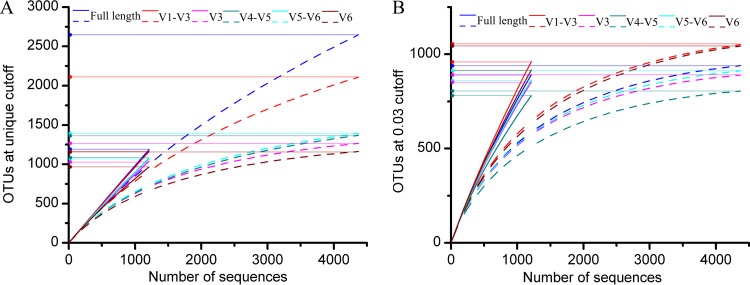
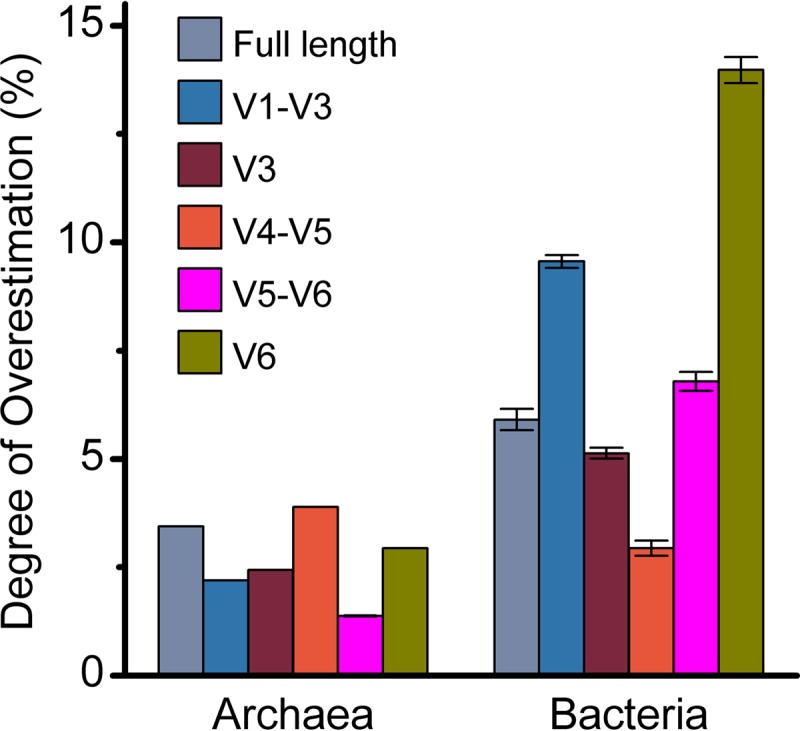
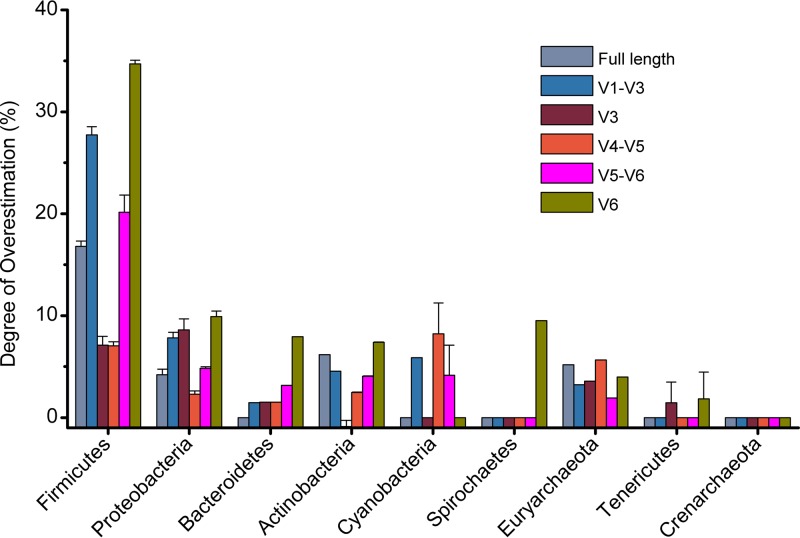
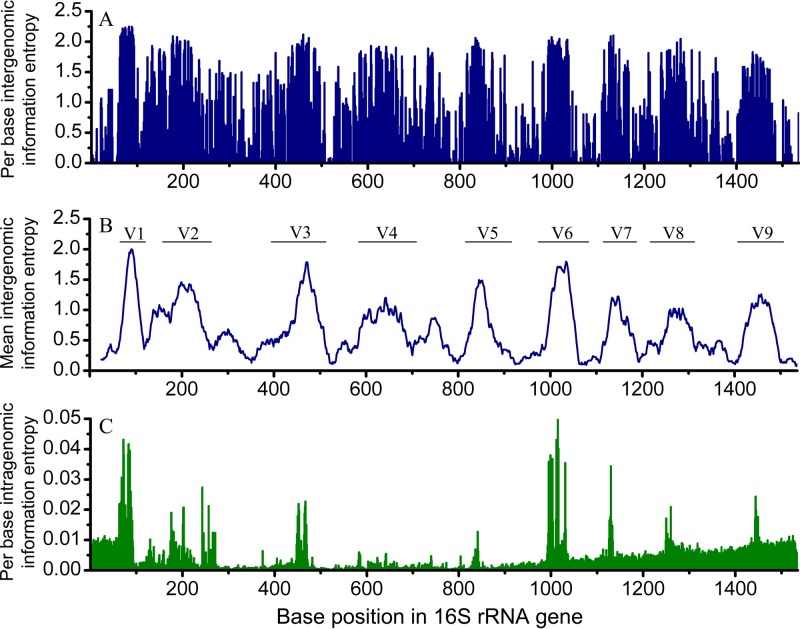
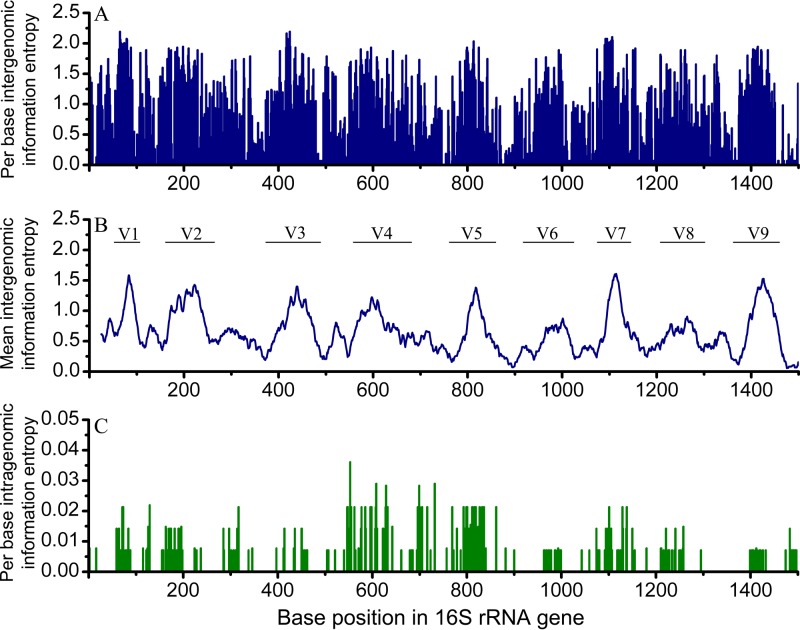
Ever since Carl Woese introduced the use of 16S rRNA genes for determining the phylogenetic relationships of prokaryotes, this method has been regarded as the "gold standard" in both microbial phylogeny and ecology studies. However, intragenomic heterogeneity within 16S rRNA genes has been reported in many investigations and is believed to bias the estimation of prokaryotic diversity. In the current study, 2,013 completely sequenced genomes of bacteria and archaea were analyzed and intragenomic heterogeneity was found in 952 genomes (585 species), with 87.5% of the divergence detected being below the 1% level. In particular, some extremophiles (thermophiles and halophiles) were found to harbor highly divergent 16S rRNA genes. Overestimation caused by 16S rRNA gene intragenomic heterogeneity was evaluated at different levels using the full-length and partial 16S rRNA genes usually chosen as targets for pyrosequencing. The result indicates that, at the unique level, full-length 16S rRNA genes can produce an overestimation of as much as 123.7%, while at the 3% level, an overestimation of 12.9% for the V6 region may be introduced. Further analysis showed that intragenomic heterogeneity tends to concentrate in specific positions, with the V1 and V6 regions suffering the most intragenomic heterogeneity and the V4 and V5 regions suffering the least intragenomic heterogeneity in bacteria. This is the most up-to-date overview of the diversity of 16S rRNA genes within prokaryotic genomes. It not only provides general guidance on how much overestimation can be introduced when applying 16S rRNA gene-based methods, due to its intragenomic heterogeneity, but also recommends that, for bacteria, this overestimation be minimized using primers targeting the V4 and V5 regions.
Figures
Similar articles
-
Microbial Diversity Biased Estimation Caused by Intragenomic Heterogeneity and Interspecific Conservation of 16S rRNA Genes.Appl Environ Microbiol. 2023 May 31;89(5):e0210822. doi: 10.1128/aem.02108-22. Epub 2023 Apr 27. Appl Environ Microbiol. 2023. PMID: 37129483 Free PMC article.
-
Intragenomic heterogeneity between multiple 16S ribosomal RNA operons in sequenced bacterial genomes.FEMS Microbiol Lett. 2003 Nov 7;228(1):45-9. doi: 10.1016/S0378-1097(03)00717-1. FEMS Microbiol Lett. 2003. PMID: 14612235
-
Use of 16S rRNA and rpoB genes as molecular markers for microbial ecology studies.Appl Environ Microbiol. 2007 Jan;73(1):278-88. doi: 10.1128/AEM.01177-06. Epub 2006 Oct 27. Appl Environ Microbiol. 2007. PMID: 17071787 Free PMC article.
-
Microbial phylogeny and diversity: small subunit ribosomal RNA sequence analysis and beyond.Microbiol Res. 2011 Feb 20;166(2):99-110. doi: 10.1016/j.micres.2010.02.003. Epub 2010 Mar 11. Microbiol Res. 2011. PMID: 20223646 Review.
-
Phylogenetic systematics of microorganisms inhabiting thermal environments.Biochemistry (Mosc). 2007 Dec;72(12):1299-312. doi: 10.1134/s0006297907120048. Biochemistry (Mosc). 2007. PMID: 18205614 Review.
Cited by
-
Genomic-Based Restriction Enzyme Selection for Specific Detection of Piscirickettsia salmonis by 16S rDNA PCR-RFLP.Front Microbiol. 2016 May 9;7:643. doi: 10.3389/fmicb.2016.00643. eCollection 2016. Front Microbiol. 2016. PMID: 27242682 Free PMC article.
-
A practical introduction to microbial molecular ecology through the use of isolation chips.Ecol Evol. 2018 Dec 11;8(24):12286-12298. doi: 10.1002/ece3.4748. eCollection 2018 Dec. Ecol Evol. 2018. PMID: 30619545 Free PMC article.
-
Microbial Diversity in Groundwater and Its Response to Seawater Intrusion in Beihai City, Southern China.Front Microbiol. 2022 Jul 13;13:876665. doi: 10.3389/fmicb.2022.876665. eCollection 2022. Front Microbiol. 2022. PMID: 35910635 Free PMC article.
-
A Genus Definition for Bacteria and Archaea Based on a Standard Genome Relatedness Index.mBio. 2020 Jan 14;11(1):e02475-19. doi: 10.1128/mBio.02475-19. mBio. 2020. PMID: 31937639 Free PMC article.
-
Multilocus Sequence Analysis, a Rapid and Accurate Tool for Taxonomic Classification, Evolutionary Relationship Determination, and Population Biology Studies of the Genus Shewanella.Appl Environ Microbiol. 2019 May 16;85(11):e03126-18. doi: 10.1128/AEM.03126-18. Print 2019 Jun 1. Appl Environ Microbiol. 2019. PMID: 30902862 Free PMC article.
References
-
- Liao DQ. 2000. Gene conversion drives within genic sequences: concerted evolution of ribosomal RNA genes in bacteria and archaea. J. Mol. Evol. 51:305–317 - PubMed
-
- Fox GE, Wisotzkey JD, Jurtshuk P. 1992. How close is close: 16S rRNA sequence identity may not be sufficient to guarantee species identity. Int. J. Syst. Bacteriol. 42:166–170 - PubMed
Publication types
MeSH terms
Substances
LinkOut - more resources
Full Text Sources
Other Literature Sources
Molecular Biology Databases
