. 2013 Sep;16(9):1331-9.
doi: 10.1038/nn.3464. Epub 2013 Jul 21.

Cellular mechanisms of brain state-dependent gain modulation in visual cortex

Affiliations

Cellular mechanisms of brain state-dependent gain modulation in visual cortex

Pierre-Olivier Polack et al. Nat Neurosci. 2013 Sep.

Abstract

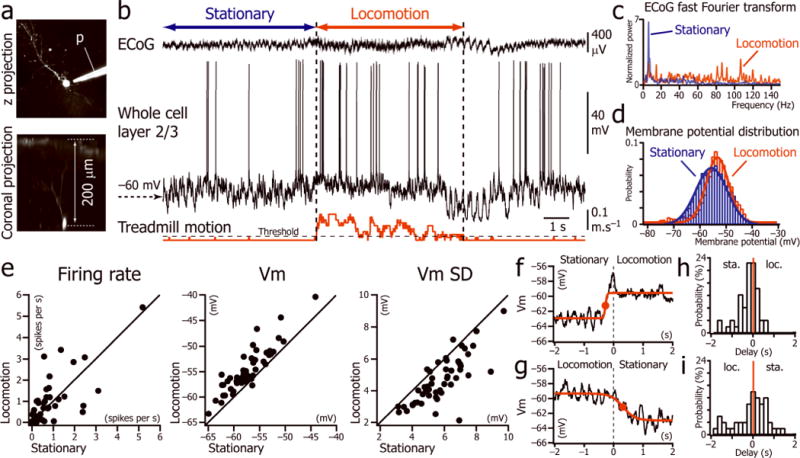
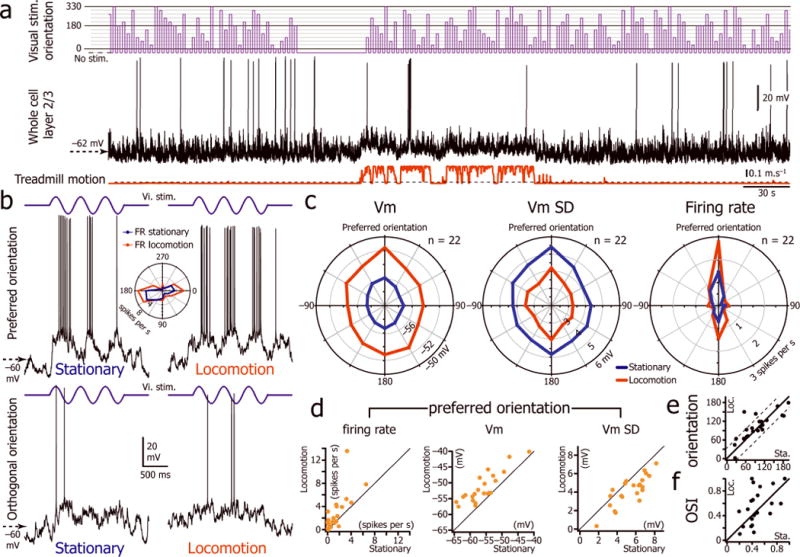
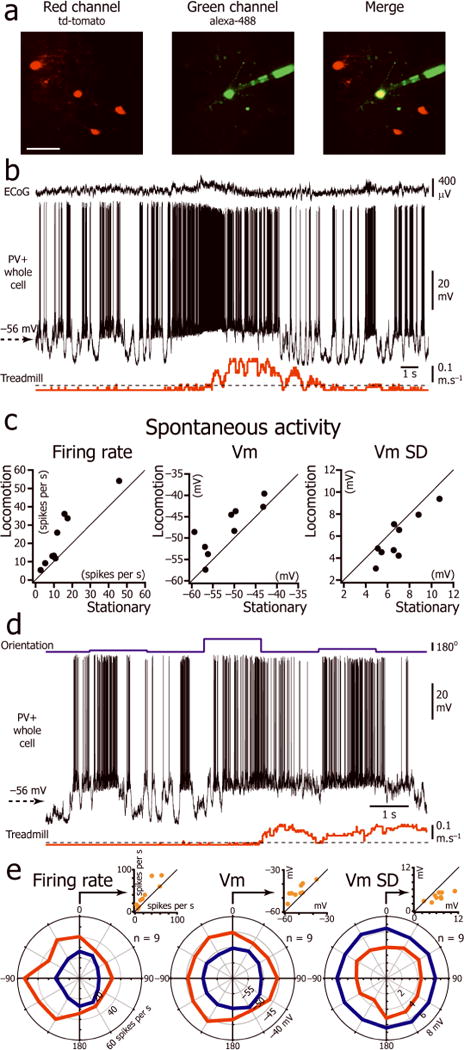
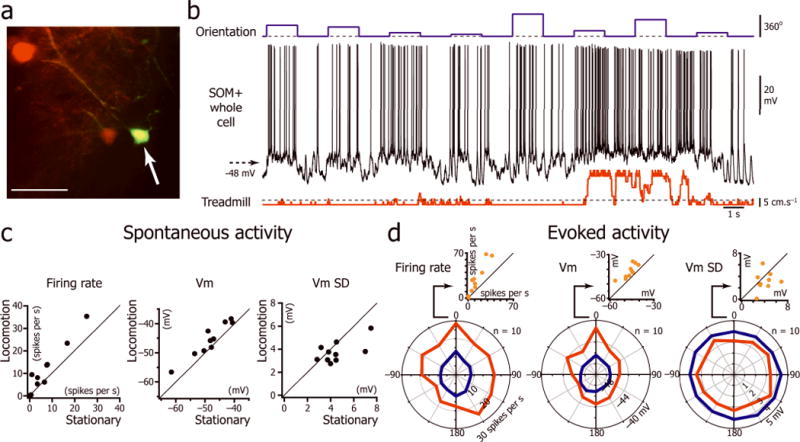
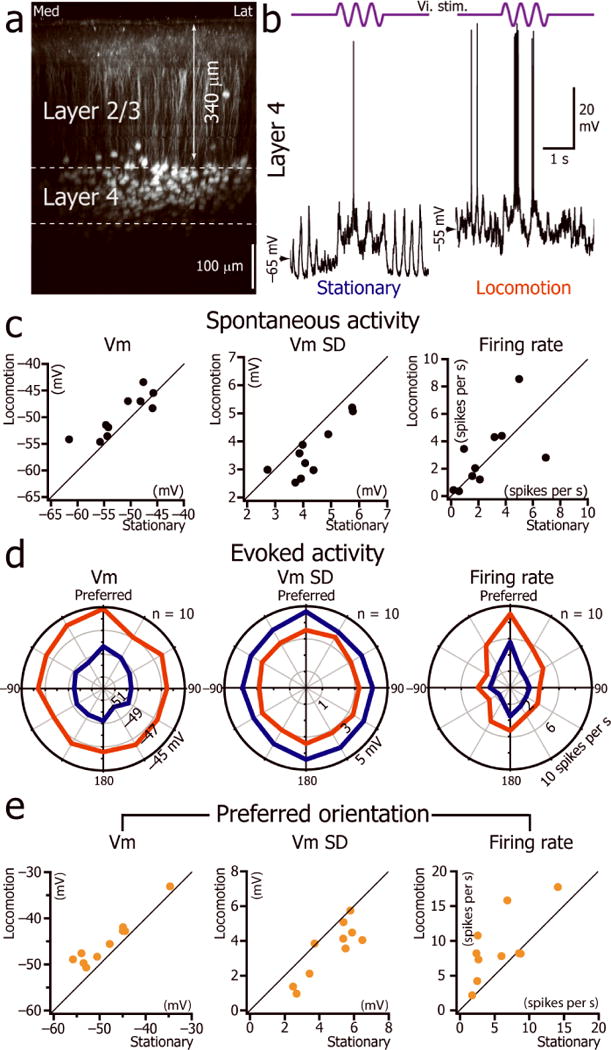
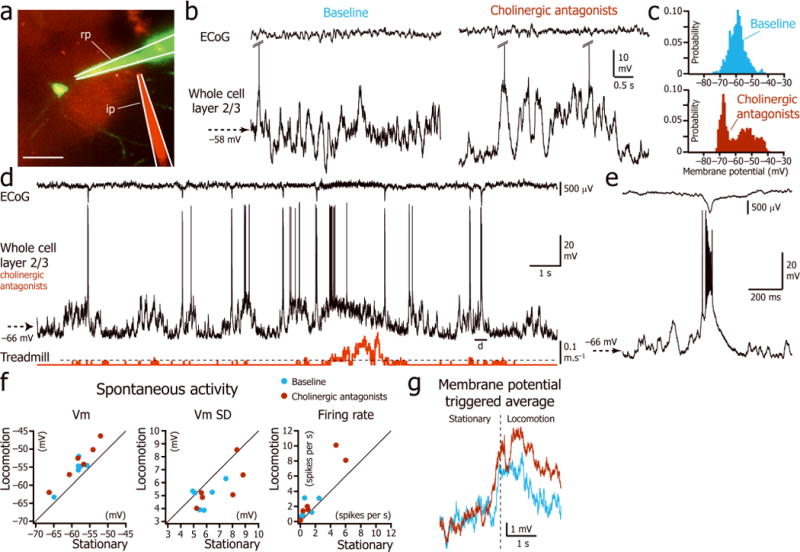
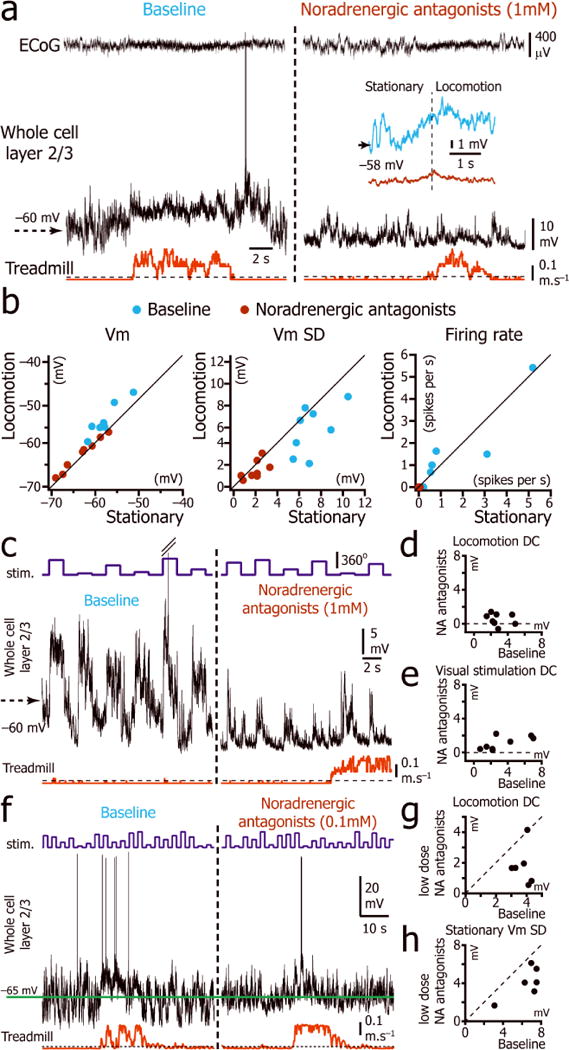
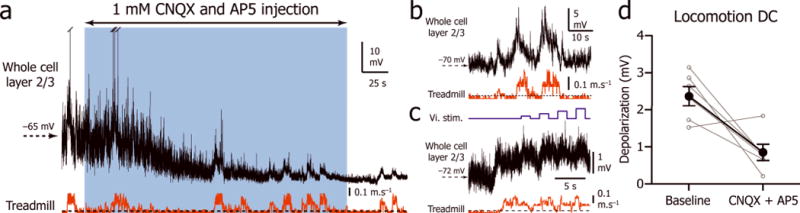
Visual cortical neurons fire at higher rates to visual stimuli during locomotion than during immobility, while maintaining orientation selectivity. The mechanisms underlying this change in gain are not understood. We performed whole-cell recordings from layer 2/3 and layer 4 visual cortical excitatory neurons and from parvalbumin-positive and somatostatin-positive inhibitory neurons in mice that were free to rest or run on a spherical treadmill. We found that the membrane potential of all cell types became more depolarized and (with the exception of somatostatin-positive interneurons) less variable during locomotion. Cholinergic input was essential for maintaining the unimodal membrane potential distribution during immobility, whereas noradrenergic input was necessary for the tonic depolarization associated with locomotion. Our results provide a mechanism for how neuromodulation controls the gain and signal-to-noise ratio of visual cortical neurons during changes in the state of vigilance.


Figures

Figure 1
Figure 1
Spontaneous activity of L2/3 neurons during stationary and locomotion periods. (a) Two-photon images of a V1 L2/3 neuron labeled with Alexa-594 through the recording pipette (p). (b) Current-clamp recording of a L2/3 neuron (middle trace) simultaneously with V1 ECoG (top trace) and treadmill motion (bottom trace). Period of locomotion (between vertical dotted lines) defined as beginning when the velocity is greater than the first step of velocity detection (threshold) for more than 1s, and resuming when velocity is lower than threshold for more than 1s. (c) Fast Fourier transforms of the ECoG signal shown in bduring the periods labeled “stationary” and “locomotion”. (d) Distributions of the Vm fitted by Gaussian functions during the periods labeled “stationary” and “locomotion” in b. (e) Plots of the mean firing rate, the mean Vm and the Vm standard deviation (Vm SD) during stationary versus locomotion periods (n=53 neurons from 36 mice). (f, g) Vm averages triggered by the beginning (f) and the end (g) of 62 locomotion episodes in one neuron. Times at half rise (red dots)of the sigmoid fits were used to determine the delay between the Vm depolarization and the beginning and end of locomotion episodes. (h, i) Distribution of delays between depolarization and beginning of locomotion (loc.) (h); and repolarization and immobility (sta.) (i) for all the neurons (n= 53 from 36 mice).
Figure 2
Figure 2
Locomotion is associated with an increase in the gain of L2/3 excitatory neurons. (a) V1 L2/3 whole cell recording (middle trace) during the presentation of drifting gratings of 12 different orientations (top trace) interleaved with the presentation of an isoluminant gray screen (“no stim.”) while the animal was free to run or rest on the spherical treadmill (bottom trace). (b) Vm changes (bottom traces) evoked in the same L2/3 neuron by three cycles of a drifting grating at 2 Hz (top traces, vi. stim.) of preferred orientation (180 degrees, top panels) and orthogonal orientation (270 degrees, bottom panels) during stationary (left) and locomotion (right) periods. Inset: orientation tuning curve of the neuron during immobility (blue) and locomotion (red). (c) Orientation tuning curve for the Vm, Vm SD and firing rate of the L2/3 neuronal population during immobility and locomotion (n=22 neurons from 18 mice). (d) Plots of firing rate, Vm and Vm SD measured for the preferred orientation during the stationary periods versus the locomotion periods (n=22 neurons from 18 mice). (e) Plot of the preferred orientation measured during immobility versus locomotion. Beyond the dashed lines the difference of orientation is greater than 30 degrees. (f) Plot of the orientation selectivity index (OSI) measured during immobility versus locomotion. OSI = 1 correspond to a perfectly oriented neuron.
Figure 3
Figure 3
Effect of locomotion on Vm of L2/3 parvalbumin positive interneurons. (a) In vivo two-photon image of a neuron (yellow) injected with Alexa-488 (green) during the recording in a mouse expressing tdTomato (red) in PV+ neurons. Scale bar: 50 μm. (b) Spontaneous activity of a L2/3 PV+ interneuron during immobility and locomotion. (c) Plots of firing rate, Vm and Vm SD during immobility versus locomotion for 9 L2/3 PV+ interneurons (8 mice). (d) Vm of the neuron shown in c during the presentation of drifting gratings of three different orientations (top trace) interleaved with presentation of an isoluminant gray screen. (e) Orientation tuning curve of the L2/3 PV+ interneuron population for firing rate, Vm, and Vm SD during immobility and locomotion (n=9 neurons from 8 mice). The orientation “0” was assigned for each neuron to the orientation at which the stationary firing rate evoked by the visual stimulus was maximal. Insert: Plot of firing rate, Vm, and Vm SD during immobility versus locomotion for the orientation “0”.
Figure 4
Figure 4
Effect of locomotion on the intracellular activity of L2/3 somatostatin positive interneurons. (a) In vivo two-photon imaging of a neuron (arrow) injected with Alexa-488 (green) during the intracellular recording in a mouse expressing tdTomato in SOM+ neurons (red). Scale bar: 50 μm. (b) Vm activity evoked by a series of drifting gratings interleaved with isoluminant gray screens (top trace) of a L2/3 SOM+ interneuron during immobility and locomotion. (c) Plots for 10 L2/3 SOM+ interneurons of the spontaneous firing rate, Vm and Vm SD during immobility versus locomotion (8 mice). (d) L2/3 SOM+ interneuron population orientation tuning curves for the firing rate, Vm, Vm SD during immobility and locomotion (n=10 neurons from 8 mice). The orientation “0” was assigned for each neuron to the orientation at which the stationary firing rate evoked by the visual stimulus was maximal. Insert: Plot of firing rate, Vm, and Vm SD during immobility versus locomotion for the orientation “0”.
Figure 5
Figure 5
L4 neuron signal-to-noise ratio increases during locomotion. (a) Coronal view of V1 in a SCNN1a-Cre × Ai9 mouse expressing tdTomato in L4. (b) Current-clamp whole cell recordings from a V1 L4 neuron during the presentation of a 2Hz drifting grating of preferred orientation (top trace) when the animal was immobile (left) or during locomotion (right). (c) Plots of the spontaneous Vm, Vm SD and firing rate of L4 neurons during immobility versus locomotion (n= 10neurons from 10 mice). (d) L4 population orientation tuning curve for Vm, the Vm SD and firing rate during immobility and locomotion (n=10 neurons from 10 mice). (e) Plot of mean Vm, Vm SD and mean firing rate during immobility versus locomotion for the preferred orientation.
Figure 6
Figure 6
Effect of cholinergic antagonists on the L2/3 neuron Vm during stationary and locomotion periods. (a) Two-photon image of a L2/3 neuron labeled with Alexa-488 (green) through the recording pipette (rp) and the local drug injection via an injection pipette (ip) visualized by addition of Alexa-594 (red) to the drug vehicle. Scale bar: 50 μm. (b) L2/3 neuron spontaneous activity during immobility before (left) and after (right) local injection of cholinergic antagonists. (c) Distribution of the Vm for the two examples shown in b. (d) Vm (middle trace) and ECoG (top trace) during stationary and locomotion periods (bottom trace) after local injection of cholinergic antagonists atropine and mecamylamine. (e) Magnified view of the paroxysmal burst associated with the ECoG spike indicated in d. (f) Superimposition of the plots of the spontaneous Vm, Vm SD and firing rate during immobility versus locomotion during baseline (blue) and cholinergic blockade (maroon). (n = 6 neurons from 6 mice). (g) Superimposition of the averages of the Vm triggered by the beginning of locomotion (vertical dotted line) during baseline (blue; n = 57 episodes in 6 neurons) and cholinergic blockade (maroon; n= 144 episodes in 6 neurons).
Figure 7
Figure 7
Effect of norepinephrine antagonists on the Vm of L2/3 neurons during stationary and locomotion periods. (a) Vm (middle trace) and ECoG (top trace) recordings during stationary and locomotion periods (bottom trace) before (left) and after (right) local injection of noradrenergic antagonistsprazosin, yohimbine, and propranolol. Inset: Average of the Vm triggered by the beginning of locomotion (vertical dotted line) during baseline (blue; n = 58 episodes in 8 neurons from 8 mice) and noradrenergic blockade (maroon; n= 79 episodes in 8 neurons from 8 mice). (b) Plot of the spontaneous baseline (blue) and noradrenergic blockade (maroon) Vm, Vm SD and firing rate during immobility versus locomotion. (c) Activity evoked by a series of drifting gratings (top trace) to a L2/3 neuron (middle trace) before (left) and after (right) local injection of noradrenergic antagonists. (d) Plot of the difference between the mean Vm during locomotion and the mean Vm during immobility, during baseline periods versus during noradrenergic (NA) blockade. (n = 8 neurons). (e) Plot of the mean depolarization during visual stimulation (all orientations) during baseline versus during noradrenergic blockade. (n = 8 neurons from 8 mice). (f) Vm recording (middle trace) during stationary and locomotion periods (bottom trace) while visual stimulation was presented (top trace) before (left) and after (right) local injection of low dose (0.1 mM) noradrenergic antagonists prazosin, yohimbine, and propranolol. Green horizontal line indicates the mean stationary Vm during baseline. (g) Plot of the difference between the locomotion Vm and stationary Vm during baseline versus partial noradrenergic blockade (n = 6 neurons from 6 mice). (h) Plot of the stationary Vm SD during baseline versus partial noradrenergic blockade (n = 6 neurons from 6 mice).
Figure 8
Figure 8. Effect of glutamatergic antagonists on the Vm of L2/3 neurons during stationary and locomotion periods
(a) Vm (top trace) recordings during stationary and locomotion periods (bottom trace) before (left), during (blue box) and after (right) local injection of 1mM AMPA and NMDA antagonists CNQX and AP5. (b) Tonic depolarization of the Vm (top trace) during locomotion episodes (bottom trace) during blockade of the spontaneous activity by CNQX and AP5 in another neuron. (c) Recording of the Vm (middle trace) of a third neuron during the transition between stationary and locomotion (bottom trace) while visual stimuli are presented (top trace). (d)) Plot of the difference between the locomotion Vm and stationary Vm during baseline and during glutamatergic blockade (n = 6 neurons from 6 mice). Solid circles indicate mean ±s.e.m. The decrease in locomotion depolarization during glutamatergic blockade is significant (Mann-Whitney U Test, p = 0.009).

References

    1. Harris KD, Thiele A. Cortical state and attention. Nature reviews. Neuroscience. 2011;12:509–523. - PMC - PubMed
    1. Ringach DL. Spontaneous and driven cortical activity: implications for computation. Current opinion in neurobiology. 2009;19:439–444. - PMC - PubMed
    1. Steriade M. Corticothalamic resonance, states of vigilance and mentation. Neuroscience. 2000;101:243–276. - PubMed
    1. Buzsáki G, Draguhn A. Neuronal Oscillations in Cortical Networks. Science. 2004;304:1926–1929. - PubMed
    1. Hasenstaub A, Sachdev RN, McCormick DA. State changes rapidly modulate cortical neuronal responsiveness. The Journal of neuroscience. 2007;27:9607–9622. - PMC - PubMed

Publication types

MeSH terms