. 2013 Sep;16(9):1266-74.
doi: 10.1038/nn.3473. Epub 2013 Jul 21.

TARP γ-7 selectively enhances synaptic expression of calcium-permeable AMPARs

Affiliations

TARP γ-7 selectively enhances synaptic expression of calcium-permeable AMPARs

Dorota Studniarczyk et al. Nat Neurosci. 2013 Sep.

Abstract

Regulation of calcium-permeable AMPA receptors (CP-AMPARs) is crucial in normal synaptic function and neurological disease states. Although transmembrane AMPAR regulatory proteins (TARPs) such as stargazin (γ-2) modulate the properties of calcium-impermeable AMPARs (CI-AMPARs) and promote their synaptic targeting, the TARP-specific rules governing CP-AMPAR synaptic trafficking remain unclear. We used RNA interference to manipulate AMPAR-subunit and TARP expression in γ-2-lacking stargazer cerebellar granule cells--the classic model of TARP deficiency. We found that TARP γ-7 selectively enhanced the synaptic expression of CP-AMPARs and suppressed CI-AMPARs, identifying a pivotal role of γ-7 in regulating the prevalence of CP-AMPARs. In the absence of associated TARPs, both CP-AMPARs and CI-AMPARs were able to localize to synapses and mediate transmission, although their properties were altered. Our results also establish that TARPed synaptic receptors in granule cells require both γ-2 and γ-7 and reveal an unexpected basis for the loss of AMPAR-mediated transmission in stargazer mice.


Figures

Figure 1
Figure 1
GluA2 knockdown in cerebellar granule cells results in expression of CP-AMPARs. (a) Global average current-voltage relationships recorded from control (black, n =17) and ΔGluA2 cells (red, n = 6 cells) in response to 20 μM AMPA. Grey and pink shaded areas denote s.e.m. (b) Rectification index values for control, ΔGluA2, and GFP transfected cells (n = 10 cells). *** P < 0.0001. (c) Global average current-voltage relationships recorded from ΔGluA2 cells (n = 6 cells) before and after bath application of 100 μM NASPM. (d) Percentage block by NASPM at −60 and +60 mV in wild-type (n = 6 cells) and ΔGluA2 cells (n = 6 cells). *** P < 0.0001. (e) Representative macroscopic responses to 100 ms application of 1 mM AMPA onto outside-out patches at −60 mV. Three individual responses from each of three different patches (I, II and III) are shown for wild-type and ΔGluA2 cells (traces are filtered at 2 kHz, for display). Long-lived bursts of openings (selected examples highlighted in red) were present in the tail of the macroscopic currents from ΔGluA2 patches; in wild-type patches openings were much briefer and less discernible (see Methods). (f) Representative current-variance plots from non-stationary fluctuation analysis. Symbols denote mean variance in each of ten equally spaced amplitude bins. Vertical error bars denote s.e.m. In each case, the weighted-mean single-channel current from the weighted parabolic fit to the data is shown. The dashed lines indicate the background current variance. (g) Pooled data showing a dramatic increase in single-channel conductance after GluA2 knockdown (n = 7 and 4 patches from wild-type and ΔGluA2 cells, respectively). ** P < 0.01. (h) Single-channel events were directly resolved in 11 of 12 patches from ΔGluA2 cells but in 0 of 18 patches from wild-type cells. In panels b, d, g and h, box-and-whisker plots indicate the median value (black line), the mean (cross), the 25-75th percentiles (box) and the 10-90th percentiles (whiskers); open circles show individual values.
Figure 2
Figure 2
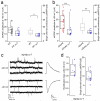
CP-AMPARs mediate mEPSCs following GluA2 knockdown. (a) Representative AMPAR-mediated mEPSCs recorded at positive and negative membrane potentials from a WT control cell and a ΔGluA2 cell. Right hand panels show the corresponding mean events. (b) Pooled data showing a decrease in rectification index following GluA2 knockdown (n = 9 and 12 WT and ΔGluA2 cells, respectively; *** P < 0.001). (c) Representative current-variance plots from peak-scaled non-stationary fluctuation analysis. Symbols denote mean variance in each of 30 equally spaced amplitude bins. In each case, the weighted-mean single-channel current from the weighted parabolic fit to the data is shown. The dashed line indicates the background current variance. (d) Pooled data showing the increased synaptic single-channel conductance in ΔGluA2 compared to wild-type cells (n = 17 and 13 cells, respectively; ** P = 0.01). (e) Scatter plot illustrating the shift in single-channel conductance and rectification index following GluA2 knockdown. Open symbols denote individual cells and closed symbols indicate the corresponding mean values (error bars denote s.e.m.). In panels b and d, box-and-whisker plots indicate the median value (black line), the mean (cross), the 25-75th percentiles (box) and the 10-90th percentiles (whiskers); open circles show individual values.
Figure 3
Figure 3
CP-AMPARs are successfully trafficked to the cell surface in stg/stg cerebellar granule cells. (a) Representative whole-cell current records obtained in the presence of 20 μM AMPA during ramp changes in membrane voltage. The traces are from a stg/stg cell (black) and a stg/stg ΔGluA2 (red). Grey trace shows the voltage protocol. (b) Global average current-voltage relationship from stg/stg ΔGluA2 cells (n = 5 cells) showing marked inward rectification. Shaded area denotes s.e.m. (c) Representative macroscopic currents evoked by rapid application of 1 mM AMPA onto an outside-out patch from a stg/stg ΔGluA2 cell. Red highlights indicate selected examples of clear channel openings in the tail of the current. (d) Representative current-variance plot from non-stationary fluctuation analysis. Symbols denote mean variance in each of ten equally spaced amplitude bins. Vertical error bars denote s.e.m. The weighted-mean single-channel current from the parabolic fit to the data is shown. The dashed line indicates the background current variance. (e) Pooled data showing single-channel conductance estimates from NSFA and resolved channel openings (n = 7 and 9 patches, respectively from stg/stg ΔGluA2 cells). ** P < 0.01. (f) Representative mEPSCs recorded at +60 and −60 mV from a stg/stg cerebellar granule cell after GluA2 knockdown. Right-hand panel shows averaged event at −60 mV and absence of detected events at +60 mV. (g) Representative current-variance plot from peak-scaled non-stationary fluctuation analysis. Symbols denote mean variance in each of 30 equally spaced amplitude bins. The weighted-mean single-channel current from the parabolic fit to the data is shown. The dashed line indicates the background current variance. (h) Pooled data showing the decreased weighted mean single-channel conductance (from psNSFA) in stg/stg ΔGluA2 cells (n = 9 cells) compared to wild-type ΔGluA2 cells (grey box-and-whisker plot from Fig. 2d; ** P < 0.01). In panels e and h, box-and-whisker plots indicate the median value (black line), the mean (cross), the 25-75th percentiles (box) and the 10-90th percentiles (whiskers); open circles show individual values.
Figure 4
Figure 4
Presence of γ-7 determines the level of surface expression of CI-AMPARs in wild-type and stg/stg cerebellar granule cells. (a) Representative whole-cell current records from a wild-type cell (black) and a Δγ-7 cell (blue) obtained in the presence of 20 μM AMPA during ramp changes in membrane voltage. Grey trace shows the voltage protocol. (b) Pooled data showing AMPA-evoked whole-cell current (−90 mV) following knockdown of γ-7 (n = 17 wild-type and 8 Δγ-7 cells; # P = 0.055 Welch t-test and P < 0.05 robust methods (see Supplementary Table 2). (c) Global average current-voltage relationship recorded from Δγ-7 cells (n = 8 cells) indicating a lack of rectification. Shaded area denotes s.e.m. (d) Pooled data showing that rectification index did not change following knockdown of γ-7 (n = 8 Δγ-7 cells). For comparison, the grey box-and-whisker plot for wild-type cells is from Fig. 1b. (e-h) Corresponding data showing the restoration of whole-cell currents following knockdown of γ-7 in stg/stg granule cells (n = 8 and 6 cells for stg/stg and stg/stg Δγ-7, respectively). In panel f and h, pooled data showing the whole-cell current and rectification index in stg/stg ΔGluA2 cells are shown for comparison (n = 5 cells; red). ** P < 0.01. In panels b, d, f and h, box-and-whisker plots indicate the median value (black line), the mean (cross), the 25-75th percentiles (box) and the 10-90th percentiles (whiskers); open circles show individual values.
Figure 5
Figure 5
Single and double knockdown experiments suggest a role of γ-7 in the regulation of synaptic AMPARs. (a) Pooled data illustrating the mEPSC amplitude at −60 mV (n = 12 and 9 cells) and reduction in synaptic single-channel conductance (n = 13 and 9 cells) following the knockdown of γ-7 in wild-type granule cells (CI-AMPARs). * P <0.05. The grey box-and-whisker plot for WT is from Fig. 2d. (b) Corresponding data showing the effect of γ-7 knockdown in WT ΔGluA2 granule cells n = 17 ΔGluA2 and 8 ΔGluA2Δγ-7 cells). ** P < 0.01. The grey box-and-whisker plot for WT ΔGluA2 cells is from Fig. 2d. (c) Representative mEPSCs recorded at +60 and −60 mV from a stg/stg cerebellar granule cell after knockdown of γ-7. Right-hand panel shows averaged events at the two potentials. (d) Pooled data showing rectification index and single-channel conductance for stg/stg Δγ-7 cells (n = 6 and 9 cells). In panels a, b and d, box-and-whisker plots indicate the median value (black line), the mean (cross), the 25-75th percentiles (box) and the 10-90th percentiles (whiskers); open circles show individual values.
Figure 6
Figure 6
AMPAR subunits GluA2 and GluA4 co-immunoprecipitate with TARP γ-7 in cerebellar lysates from both wild-type and stg/stg mice. γ-7 additionally co-immunoprecipitates with γ-2 in wild-type cerebellum. γ-7 protein complexes were immunoprecipitated (IP) with anti- γ-7 antibody then western blotted, along side input samples and IgG controls, using anti-GluA4, anti-GluA2 or anti- γ-2 antibodies (IB; immunoblot). Input fractions were 1.5% of the total, except for wild type GluA2 and γ-2 where they were 0.5%. In each case the nearest molecular weight markers are indicated. Each immunoblot illustrated is representative of 2-5 replicates.Illustrated blots are cropped; un-cropped blots are shown in Supplementary Figure 3.
Figure 7
Figure 7
Over-expression of γ-7 in cerebellar granule cells causes a switch from CI- to CP-AMPARs. (a) Representative whole-cell current records from a wild-type cell (black) and a +γ-7 cell (orange) obtained in the presence of 20 μM AMPA during ramp changes in membrane voltage. Grey trace shows the voltage protocol. (b) Representative records (as in a) showing the effect of over-expression of γ-2 (cyan). (c) Global average current-voltage relationships recorded from +γ-2 (cyan, n = 8) and +γ-7 cells (orange, n = 5). Shaded areas denote s.e.m. (d) Pooled data showing the effects of over-expression of γ-7 (n = 5 cells) and γ-2 (n = 8 cells) on rectification index. The grey box-and-whisker plot for wild-type cells is from Fig. 1b. *** P < 0.001. (e) Representative mEPSCs recorded at +60 and −60 mV from a wild-type cerebellar granule cell after over-expression of γ-7. Right-hand panel shows averaged events at the two potentials. (f) Pooled data showing changes in mEPSC amplitude, rectification index and single-channel conductance following over-expression of γ-7 (n = 7, 4 and 6 cells). For comparison, the grey box-and-whisker plots for wild-type cells are from Figs. 5a, 2b and 2d. * P < 0.05. ** P < 0.01. In panels d and f, box-and-whisker plots indicate the median value (black line), the mean (cross), the 25-75th percentiles (box) and the 10-90th percentiles (whiskers); open circles show individual values.

Similar articles

Cited by

References

    1. Traynelis SF, et al. Glutamate receptor ion channels: structure, regulation, and function. Pharmacol Rev. 2010;62:405–496. - PMC - PubMed
    1. Kuner R, et al. Late-onset motoneuron disease caused by a functionally modified AMPA receptor subunit. Proceedings of the National Academy of Sciences of the United States of America. 2005;102:5826–5831. - PMC - PubMed
    1. Liu B, et al. Ischemic insults direct glutamate receptor subunit 2-lacking AMPA receptors to synaptic sites. J Neurosci. 2006;26:5309–5319. - PMC - PubMed
    1. Park JS, et al. Persistent inflammation induces GluR2 internalization via NMDA receptor-triggered PKC activation in dorsal horn neurons. J Neurosci. 2009;29:3206–3219. - PMC - PubMed
    1. Gangadharan V, et al. Peripheral calcium-permeable AMPA receptors regulate chronic inflammatory pain in mice. J Clin Invest. 2011;121:1608–1623. - PMC - PubMed

Publication types

MeSH terms