. 2013 Sep;45(9):1083-7.
doi: 10.1038/ng.2705. Epub 2013 Jul 21.

Independent specialization of the human and mouse X chromosomes for the male germ line

Affiliations

Independent specialization of the human and mouse X chromosomes for the male germ line

Jacob L Mueller et al. Nat Genet. 2013 Sep.

Abstract

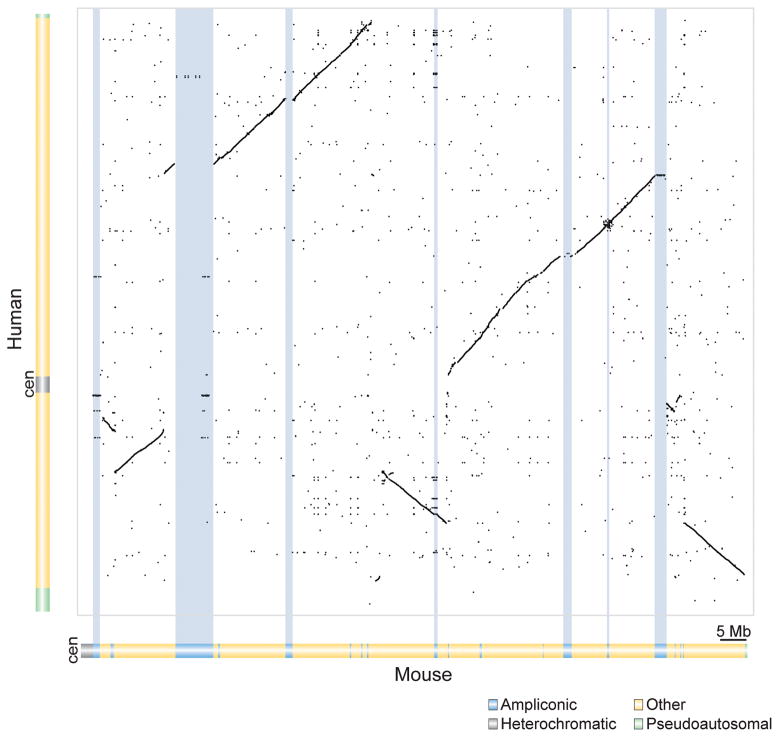
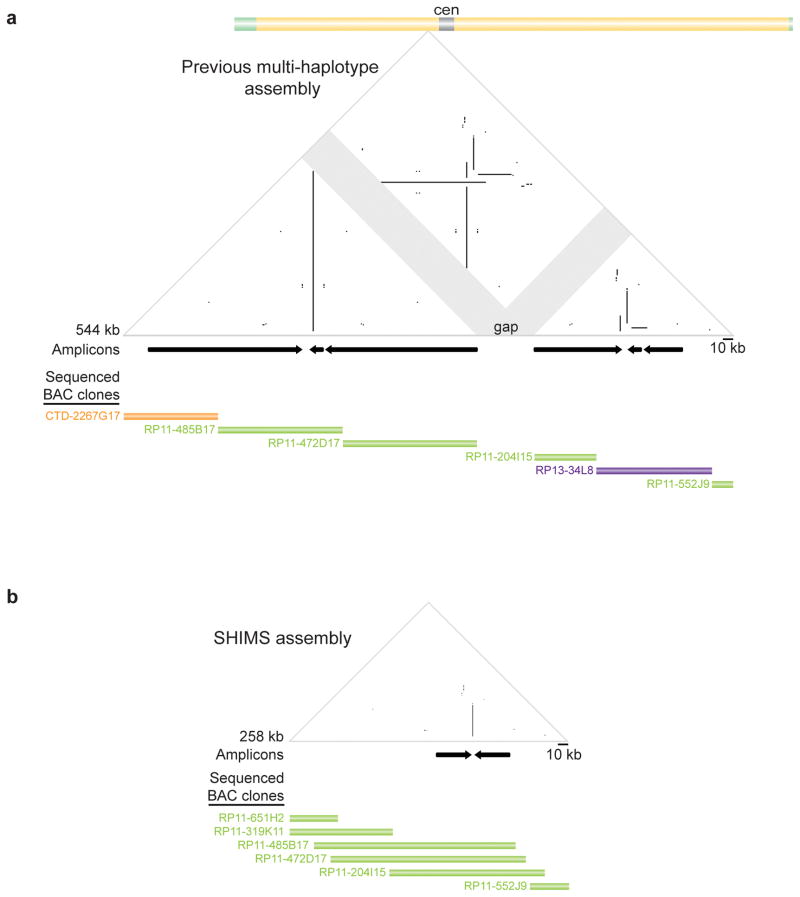
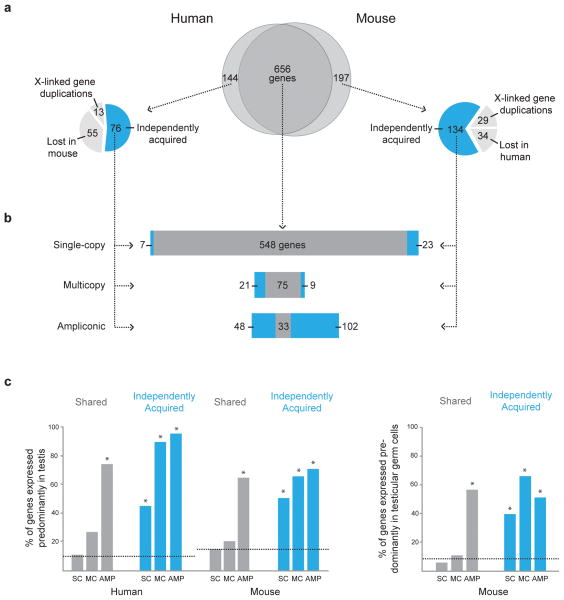
We compared the human and mouse X chromosomes to systematically test Ohno's law, which states that the gene content of X chromosomes is conserved across placental mammals. First, we improved the accuracy of the human X-chromosome reference sequence through single-haplotype sequencing of ampliconic regions. The new sequence closed gaps in the reference sequence, corrected previously misassembled regions and identified new palindromic amplicons. Our subsequent analysis led us to conclude that the evolution of human and mouse X chromosomes was bimodal. In accord with Ohno's law, 94-95% of X-linked single-copy genes are shared by humans and mice; most are expressed in both sexes. Notably, most X-ampliconic genes are exceptions to Ohno's law: only 31% of human and 22% of mouse X-ampliconic genes had orthologs in the other species. X-ampliconic genes are expressed predominantly in testicular germ cells, and many were independently acquired since divergence from the common ancestor of humans and mice, specializing portions of their X chromosomes for sperm production.


Figures

Figure 1
Figure 1. Dot-plot comparison of nucleotide sequences of human and mouse X chromosomes reveals large, divergent ampliconic regions on mouse X chromosome
Dot plot generated from BLASTZ nucleotide alignments of the human X chromosome assembly, prior to our SHIMS refinement (vertical axis), and the single-haplotype mouse X chromosome assembly (horizontal axis); each dot represents >70% nucleotide identity, within a 10-kb window, at that position. Within the plot, diagonal lines indicate syntenic blocks between the two chromosomes; regions lacking such diagonals are comprised of species-specific sequences. Blue shading highlights divergent ampliconic regions, each >500 kb in length, on the mouse X chromosome.
Figure 2
Figure 2. Comparison of mosaic and SHIMS sequence assemblies across one region of human X chromosome
a, Triangular dot-plot highlights sequence similarities within mosaic (multi-haplotype) assembly. Each dot represents 100% identity within a window of 100 nucleotides; direct repeats appear as horizontal lines, inverted repeats as vertical lines, and palindromes as vertical lines that nearly intersect the baseline; gaps are indicated by gray shading. Black arrows immediately below plots denote positions and orientations of amplicons. Further below, sequenced BACs from CTD, RP-11, and RP-13 libraries (each from a different individual) contributing to the assembly are depicted as orange, green, and purple bars, respectively; each bar reflects extent and position within assembly of finished sequence for that BAC. (As per the human genome assembly standard, finished-sequence overlaps between adjoining BACs are limited to 2 kb.) GenBank accession numbers in Supplementary Table 1. b, SHIMS assembly of same region. All BACs derive from RP-11 library (one male) and are fully sequenced; each BAC’s finished sequence extensively overlaps those of adjoining BACs.
Figure 3
Figure 3. Comparison of X-linked gene classes between human and mouse
a, At center, Venn diagram depicts all human and mouse X-linked genes that are shared or not shared. To left and right, pie charts depict species-specific genes independently acquired in that lineage (blue), duplicated from an ancestral X-linked gene in that lineage (light gray), or lost in the opposite lineage (light gray). Venn diagram and pie charts are drawn to scale (by gene number). b, Horizontal bar stacks of single-copy, multicopy and ampliconic genes shared (dark gray) and independently acquired (blue) on human and mouse X chromosomes. Bar stacks are to scale (by gene number). c, Percentages of genes expressed predominantly in testis and in testicular germ cells. Horizontal dotted lines represent percentages of autosomal genes exhibiting testis- or testicular-germ-cell-predominant expression. SC, single-copy; MC, multicopy; AMP, ampliconic. Each asterisk indicates Chi-square test with Yates’ correction p < 0.0001 (degrees of freedom = 1) when compared to either autosomal genes or X-linked single-copy genes.

References

    1. Ohno S. Sex Chromosomes and Sex-linked Genes. Springer; Berlin: 1967.
    1. Kuroiwa A, et al. Conservation of the rat X chromosome gene order in rodent species. Chromosome Res. 2001;9:61–7. - PubMed
    1. Delgado CL, Waters PD, Gilbert C, Robinson TJ, Graves JA. Physical mapping of the elephant X chromosome: conservation of gene order over 105 million years. Chromosome Res. 2009;17:917–26. - PubMed
    1. Prakash B, Kuosku V, Olsaker I, Gustavsson I, Chowdhary BP. Comparative FISH mapping of bovine cosmids to reindeer chromosomes demonstrates conservation of the X-chromosome. Chromosome Res. 1996;4:214–7. - PubMed
    1. Ross MT, et al. The DNA sequence of the human X chromosome. Nature. 2005;434:325–37. - PMC - PubMed

Publication types