

doi: 10.1038/nmeth.2568.
Epub 2013 Jul 21.
Imaging bacterial protein expression using genetically encoded RNA sensors
Affiliations
- PMID: 23872791
- PMCID: PMC3758421
- DOI: 10.1038/nmeth.2568
Item in Clipboard
Imaging bacterial protein expression using genetically encoded RNA sensors
Nat Methods.
2013 Sep.
Abstract
The difficulties in imaging the dynamics of protein expression in live bacterial cells can be overcome by using fluorescent sensors based on Spinach, an RNA that activates the fluorescence of a small-molecule fluorophore. These RNAs selectively bind target proteins and exhibit fluorescence increases that enable protein expression to be imaged in living Escherichia coli. These sensors are key components of a generalizable strategy to image protein expression in a single bacterium in real time.
Figures
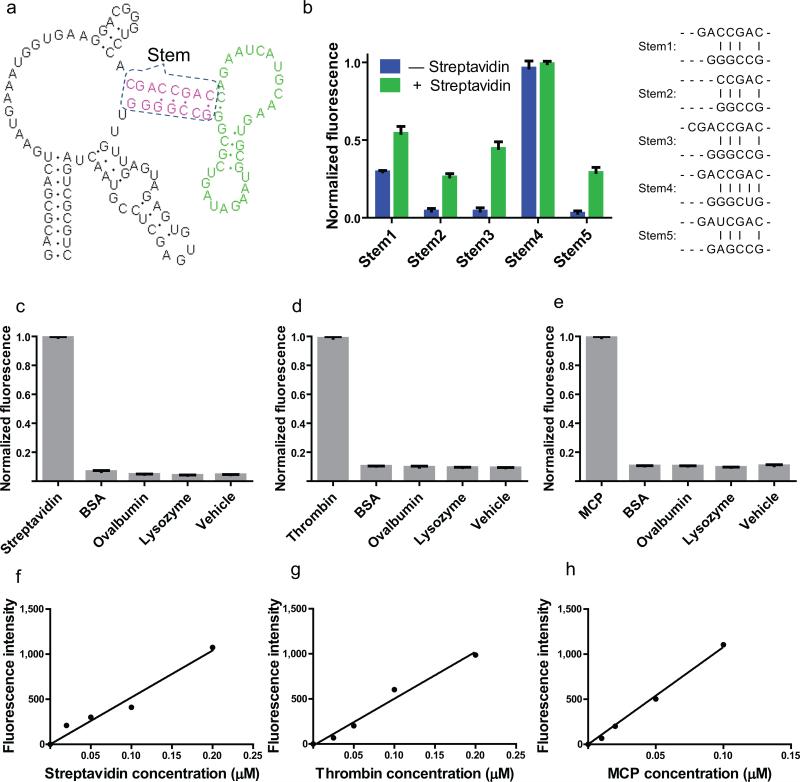
(a) The secondary structure and modular design of streptavidin sensors. The three modular components of the streptavidin sensor are depicted. The recognition module (green) constitutes an aptamer that binds to streptavidin. The transducer module (red) comprises two strands which form a weakly base paired stem. Folding of the recognition domain provides additional stability that facilitates the hybridization of the stem region in the recognition module. The Spinach module (black) binds to and activates the fluorescence of DFHBI, but only when the transducer module forms a stem. (b) Optimization of stem transducer modules for streptavidin sensors. The streptavidin aptamer was fused to Spinach by one of five different transducer modules. These transducer modules contained different lengths and combination of G-C, A-U and mismatched base pairs, and were chosen because they were predicted to have a very low probability of duplex formation using the prediction software Mfold. Streptavidin sensors containing different stems (stem 1-5) were incubated with 10 μM DFHBI, 0.2 μM RNA in the presence or absence of 100 μg/ml (1.7 μM) streptavidin, and fluorescence emission was measured. The optimal transducer module (stem 3) was chosen because in the context of the sensor it displayed low background fluorescence, with a 10.3-fold increase in fluorescence signal upon incubation with streptavidin. The experiment was replicated three times, an average fluorescence signal and SEM were calculated and show in bar graph. (c) Emission spectra of the RNA sensor for streptavidin in the presence or absence of streptavidin. Spectra were collected using 0.2 μM RNA, 10 μM DFHBI and 100 μg/ml (1.7 μM) streptavidin. Fluorescence signal is negligible in the absence of streptavidin and increases 10.3-fold in the presence of streptavidin. (d) Emission spectra of the RNA sensor for human thrombin in the presence or absence of thrombin. Spectra were collected using 0.2 μM RNA, 10 μM DFHBI and 40 μg/mL (1.0 μM) thrombin. Fluorescence signal is negligible in the absence of thrombin and increases 6.9-fold in the presence of thrombin. (e) Emission spectra of the RNA sensor for MS2 coat protein (MCP) in the presence or absence of MS2. Spectra were collected using 0.5 μM RNA, 10 μM DFHBI and 155 μg/ml (4 μM) MCP. Fluorescence signal is negligible in the absence of MS2 and increases 41.7-fold in the presence of MCP. (f) Selectivity of streptavidin sensor. 0.2 μM RNA and 10 μM DFHBI were incubated with 0.1 mg/ml (2 μM) streptavidin or 2 μM competing proteins and assayed for fluorescence emission at 500 nm. Only baseline fluorescence is seen in the presence of competing proteins. The experiment was replicated three times, an average fluorescence signal and SEM were calculated and show in bar graph. (g) Selectivity of human thrombin sensor. 0.2 μM RNA and 10 μM DFHBI were incubated with 0.04 mg/ml (2 μM) thrombin or 2 μM competing proteins and assayed for fluorescence emission at 500 nm. Only baseline fluorescence is seen in the presence of competing proteins. The experiment was replicated three times, an average fluorescence signal and SEM were calculated and show in bar graph. (h) Selectivity of MS2 coat protein sensor. 0.2 μM RNA and 10 μM DFHBI were incubated with 0.078 mg/ml (2 μM) MS2 or 2 μM competing proteins and assayed for fluorescence emission at 500 nm. Only baseline fluorescence is seen in the presence of competing proteins. The experiment was replicated three times, an average fluorescence signal and SEM were calculated and show in bar graph. (i) Dose-response curve for fluorescence detection of streptavidin by the RNA-based streptavidin sensor. The fluorescence signal was linear between 0–0.2 μM streptavidin. (j) Dose-response curve for fluorescence detection of thrombin by the RNA-based thrombin sensor. The fluorescence signal was linear between 0–0.2 μM thrombin. (k) Dose-response curve for fluorescence detection of MCP by the RNA-based MCP sensor. The fluorescence signal was linear between 0–0.1 μM MCP.
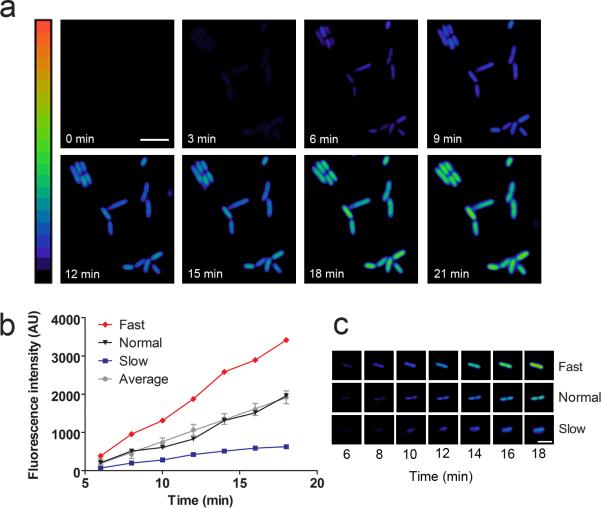
(a) Kinetics of MCP synthesis after viral infection. E. coli expressing the MCP sensor were infected with MS2 phage at an MOI of 10. MCP synthesis was monitored as an increase in fluorescence signal over time. Images are pseudocolored to show the fold increase in fluorescence at each time point following infection of MS2 phage. Color scale bar represents 0- to 20-fold changes in fluorescence signal. Scale bar, 5 μm. (b) MCP synthesis kinetics vary in individual cells. E. coli were infected at an MOI of 0.1 and fluorescence was monitored over time. One hundred cells were quantified and an average rate of fluorescence increase was calculated. The average values and SEM are shown (gray line). Based on this average rate, cells were either categorized as Fast (red line), Normal (black line), or Slow (blue line). (c) Representative examples of Fast and Slow cells. Fast and Slow cells accumulated MCP with a rate greater or less than two standard deviations from the mean rate, respectively. Time points following application of MS2 phage are indicated. (d) Percentage of cells in fast, average, and low categories for MCP synthesis. The rate of fluorescence increase in 85% of cells was within two standard deviations of the mean value (gray), whereas 4% of cells were faster than average (red), and 11% of cells were slower than average (blue).
References
Publication types
MeSH terms
Substances
Grants and funding
LinkOut - more resources
Full Text Sources
Other Literature Sources
