. 2013 Aug;90(8):788-98.
doi: 10.1097/OPX.0000000000000011.

Interpretation of low-vision rehabilitation outcome measures

Affiliations

Interpretation of low-vision rehabilitation outcome measures

Robert W Massof et al. Optom Vis Sci. 2013 Aug.

Abstract

Purpose: This article presents a theoretical interpretation of patient-reported outcomes of low-vision rehabilitation (LVR) using rating scale questionnaires and uses previously published results of LVR outcome studies to illustrate theoretical points and validate assumptions.

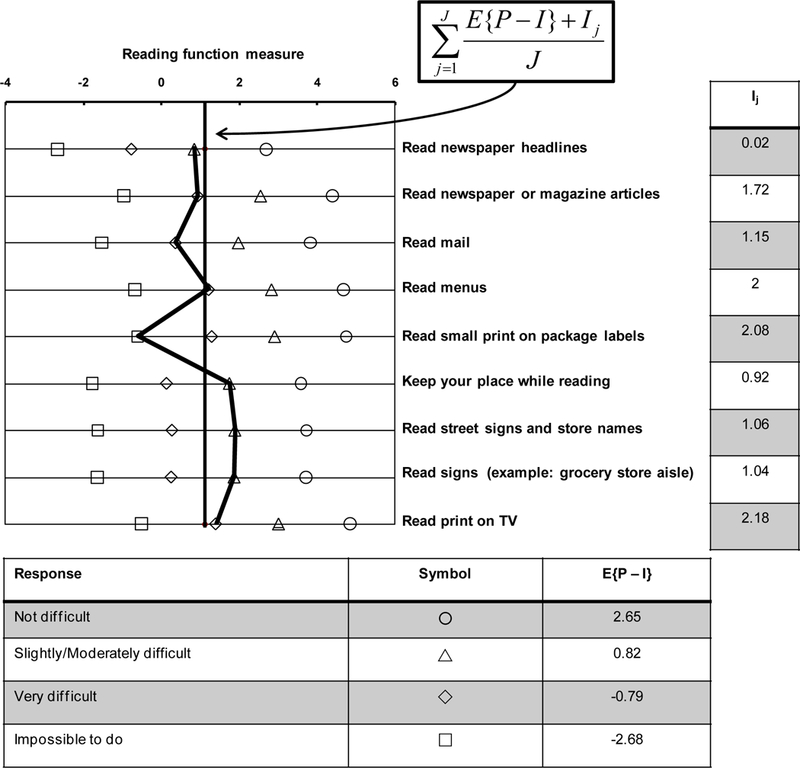
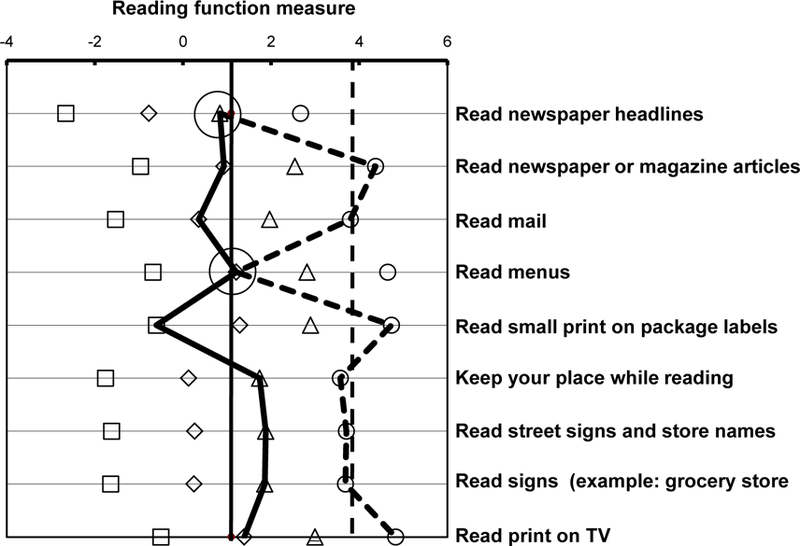
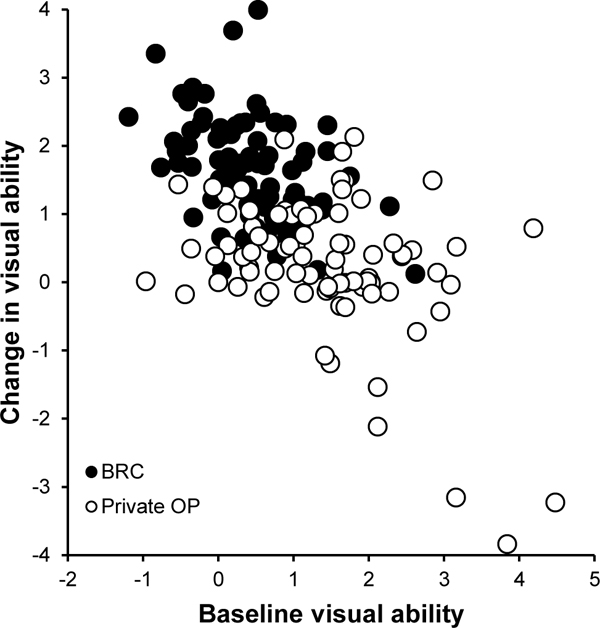
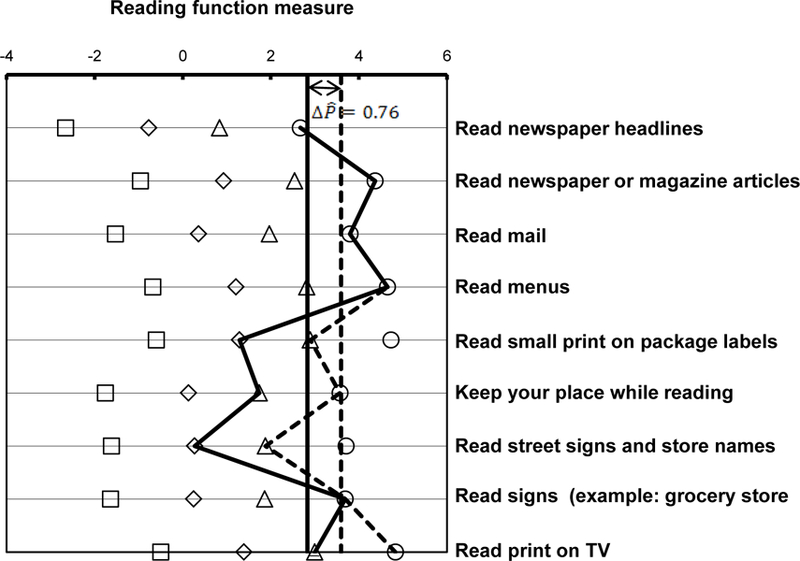
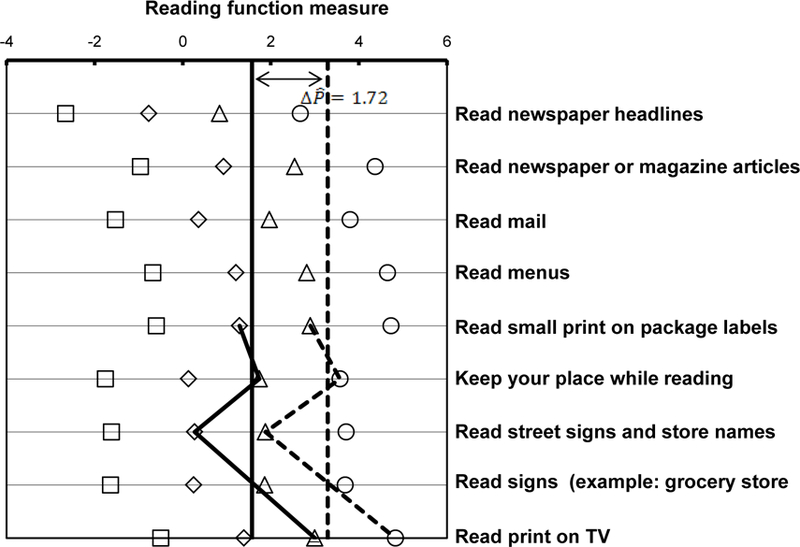
Theory: Patients' judgments of the difficulty they have performing tasks are interpreted as magnitude estimates of their functional reserve for each task, which is the difference between their visual ability and the visual ability demanded by the task. We assume that improvements in functional reserve can occur by increasing the patient's visual ability with medical, surgical, or refractive interventions or decreasing the visual ability demanded by the item with activity-specific vision assistive equipment, adaptations, and environmental modifications. Activity-specific interventions cause differential item functioning (intervention-related DIF). Intervention-related DIF makes the measured size of the treatment effect dependent on the item content and the mix of responsive and unresponsive items to intervention.

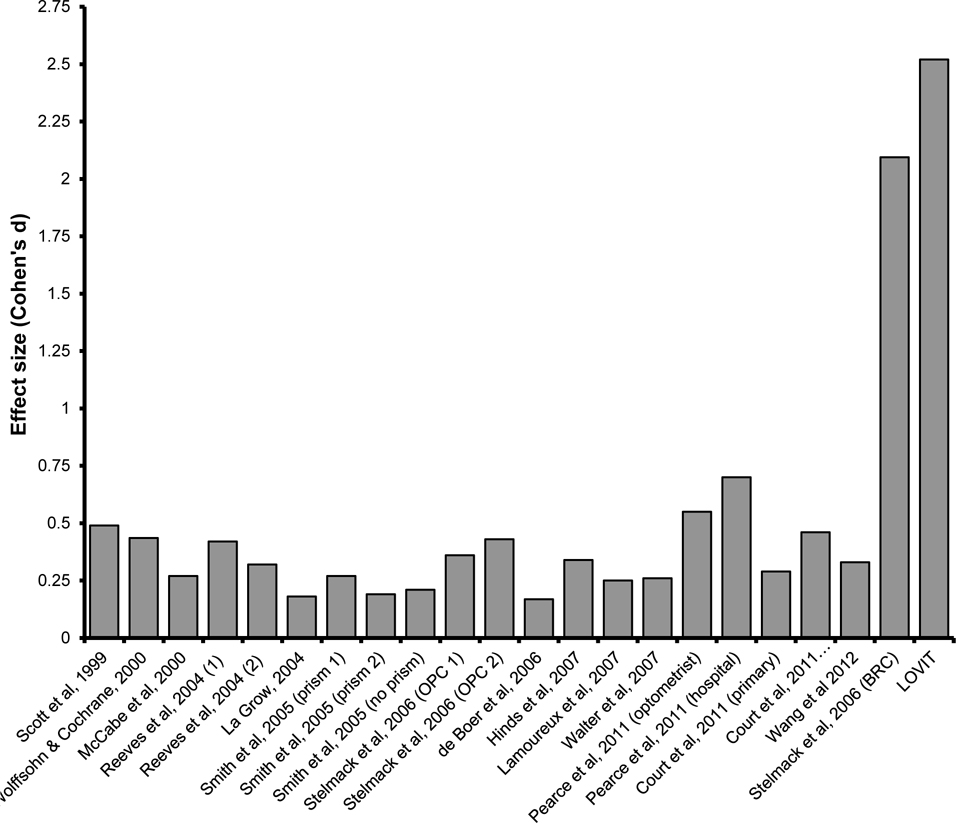
Conclusions: Because intervention-related DIF depends on the choice of items, the outcome measure selected should be appropriate to the aims of the intervention and the impairment level of the sample to demonstrate the full effects of an intervention. Items that are given extreme positive ratings at preintervention baseline (e.g., "not difficult") have no room for improvement. These items must also be filtered out because they will dilute the measured effect of the activity-specific interventions of LVR.


Figures

Figure 1.
Figure 1.
Keyform plot of pre-intervention baseline responses to reading items in the VA LV VFQ by a participant in LOVIT. Reading function person measure is plotted on the horizontal axis at the top of the figure. Each of the four difficulty ratings is represented by a different symbol identified in the table at the bottom of the figure. That table also lists average functional reserve for each response category. Each row in the figure corresponds to a different reading item identified by the item labels on the right of the figure. The item measures are listed in the table to the right of the item descriptions. The response symbols are positioned on the horizontal axis according to the sum of functional reserve and the item measure. The participant’s responses to the reading items are connected by the solid black lines. The solid vertical line corresponds to the average of the sums of average functional reserve and the item measures, which mathematically is an estimate of the person measure.
Figure 2.
Figure 2.
Scatter plot of person measures estimated from average functional reserve (vertical axis) compared to person measures estimated using maximum likelihood estimation procedures with the Rasch model (horizontal axis) for LOVIT participants at pre-intervention baseline. There is strong agreement between the two sets of estimated measures (r2 = 0.98).
Figure 3.
Figure 3.
Keyform plot for the same LOVIT participant whose responses are shown in Figure 1. The solid lines connect the participant’s difficulty ratings at baseline and the solid vertical line is the average person measure estimate across all reading items (reproduction of the results shown in Figure 1). The dashed lines connect the same participant’s difficulty ratings at post-intervention follow-up. For two items, “Read newspaper headlines” and “Read menus”, the difficulty rating at follow-up was the same as the difficulty rating at baseline (highlighted with large circles). The difficulty ratings for all other items at follow-up were lower than they were at baseline. The dashed vertical line is the average of the person measure estimates for each item across all nine reading items.
Figure 4.
Figure 4.
Comparison of effect sizes for different low vision rehabilitation outcome studies and groups of patients within studies. Effect size is expressed as the difference between the mean outcome score at post-intervention follow-up and the score at pre-intervention baseline divided by the standard deviation of the baseline score distribution. Different studies employed different VFQs as the outcome measure and different methods of scoring.
Figure 5.
Figure 5.
Scatter plot of changes in visual ability (i.e., visual ability measured at post-intervention follow-up minus visual ability measured at baseline) versus visual ability measured at baseline for VA Blind Rehabilitation Center inpatients (filled circles) and for outpatients at private low vision rehabilitation centers (open circles).
Figure 6.
Figure 6.
Keyform plot of a low vision patient’s responses to VA LV VFQ reading items at pre-intervention baseline (solid lines) and at post-intervention follow-up (dashed lines). Note that this patient responded “not difficult” (open circles) to five of the items at baseline. The reading function person measure estimated from all nine responses at baseline is the intersection of the solid vertical line with the reading function measure axis. The reading function person measure estimated from all nine responses at post-intervention follow-up is the intersection of the dashed vertical line with the reading function measure axis. The estimated change in the person measure corresponds to the separation of the vertical lines on the reading function measure axis (ΔP = 0.76).
Figure 7.
Figure 7.
Keyform plot of the same baseline (solid lines) and follow-up responses (dashed lines) to VA LV VFQ reading items that are plotted in Figure 6, except that the items for which responses at baseline were “not difficult” are removed. The solid vertical line is the average person measure estimate from pre-intervention baseline responses to the four retained items and the dashed vertical line is the average person measure estimate from post-intervention follow-up responses to the same four retained items. By filtering out the items that were rated “not difficult” at baseline, the estimated change in person measure increased to ΔP = 1.72.

Similar articles

Cited by

References

    1. Binns AM, Bunce C, Dickinson C, Harper R, Tudor-Edwards R, Woodhouse M, Linck P, Suttie A, Jackson J, Lindsay J, Wolffsohn J, Hughes L, Margrain TH. How effective is low vision service provision? A systematic review. Surv Ophthalmol 2012;57:34–65. - PubMed
    1. Scott IU, Smiddy WE, Schiffman J, Feuer WJ, Pappas CJ. Quality of life of low-vision patients and the impact of low-vision services. Am J Ophthalmol 1999;128:54–62. - PubMed
    1. Smith HJ, Dickinson CM, Cacho I, Reeves BC, Harper RA. A randomized controlled trial to determine the effectiveness of prism spectacles for patients with age-related macular degeneration. Arch Ophthalmol 2005;123:1042–50. - PubMed
    1. Lamoureux E, Pesudovs K. Vision-specific quality-of-life research: a need to improve the quality. Am J Ophthalmol 2011;151:195–7. - PubMed
    1. Las Hayas C, Bilbao A, Quintana JM, Garcia S, Lafuente I. A comparison of standard scoring versus Rasch scoring of the visual function index-14 in patients with cataracts. Invest Ophthalmol Vis Sci 2011;52:4800–7. - PubMed

Publication types

MeSH terms