. 2013 Jun 21:5:ecurrents.outbreaks.bb1e879a23137022ea79a8c508b030bc.
doi: 10.1371/currents.outbreaks.bb1e879a23137022ea79a8c508b030bc.
Forecasting peaks of seasonal influenza epidemics
Affiliations
- PMID: 23873050
- PMCID: PMC3712489
- DOI: 10.1371/currents.outbreaks.bb1e879a23137022ea79a8c508b030bc
Item in Clipboard
Forecasting peaks of seasonal influenza epidemics
PLoS Curr.
.
Abstract
We present a framework for near real-time forecast of influenza epidemics using a simulation optimization approach. The method combines an individual-based model and a simple root finding optimization method for parameter estimation and forecasting. In this study, retrospective forecasts were generated for seasonal influenza epidemics using web-based estimates of influenza activity from Google Flu Trends for 2004-2005, 2007-2008 and 2012-2013 flu seasons. In some cases, the peak could be forecasted 5-6 weeks ahead. This study adds to existing resources for influenza forecasting and the proposed method can be used in conjunction with other approaches in an ensemble framework.
Figures
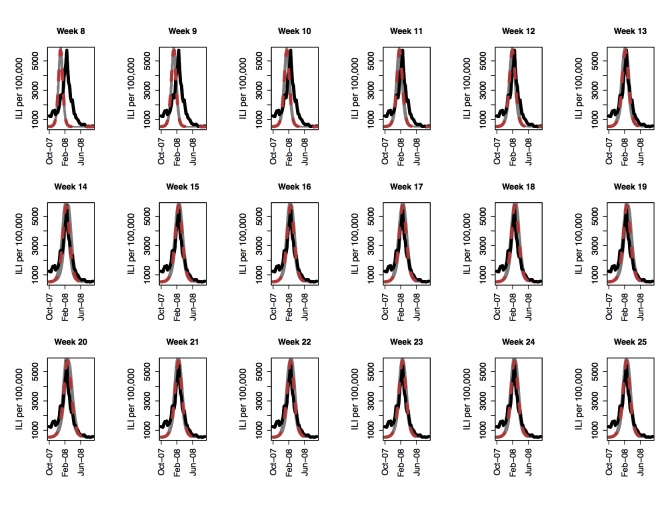
Actual peak is observed on week 20. The black curve is the GFT data, the red line is the mean predicted curve and the grey curves show fifty replicates of the stochastic process.
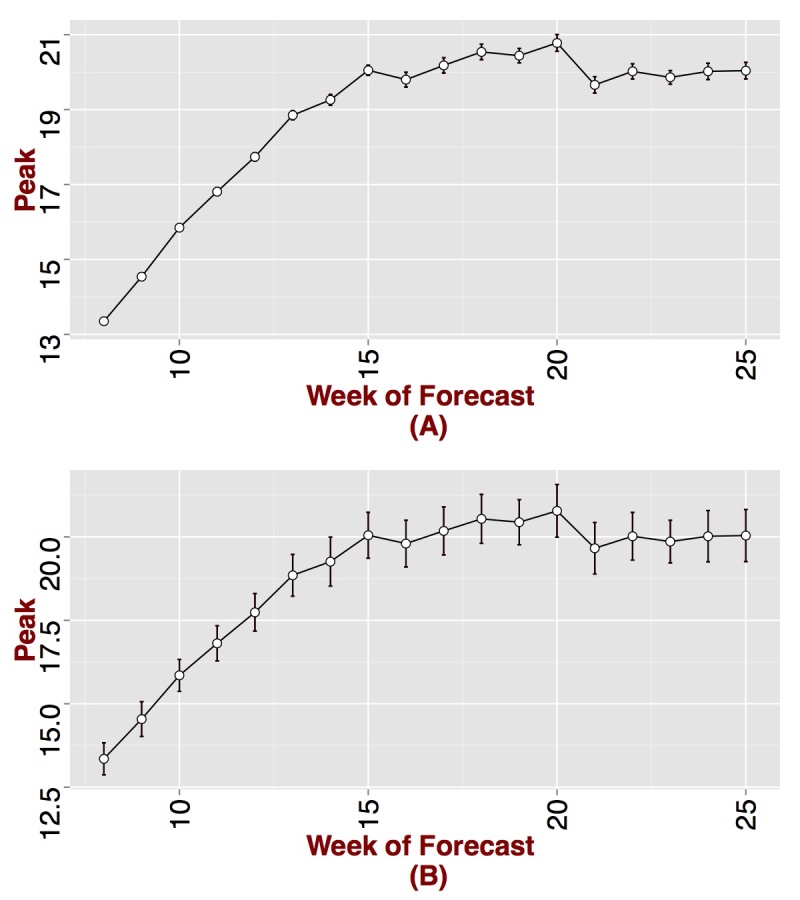
(A) 95% CI around the mean and (B) standard deviations around the mean. The true peak is observed on week 20.
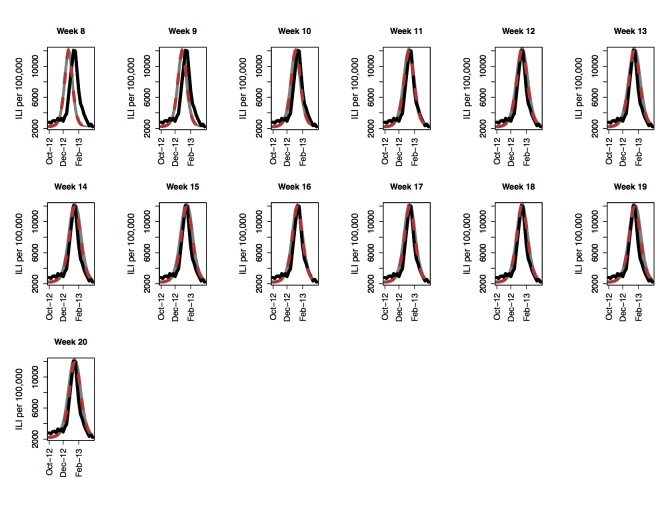
Actual peak is observed on week 15. The black curve is the GFT data, the red line is the mean predicted curve and the grey curves show fifty replicates of the stochastic process.
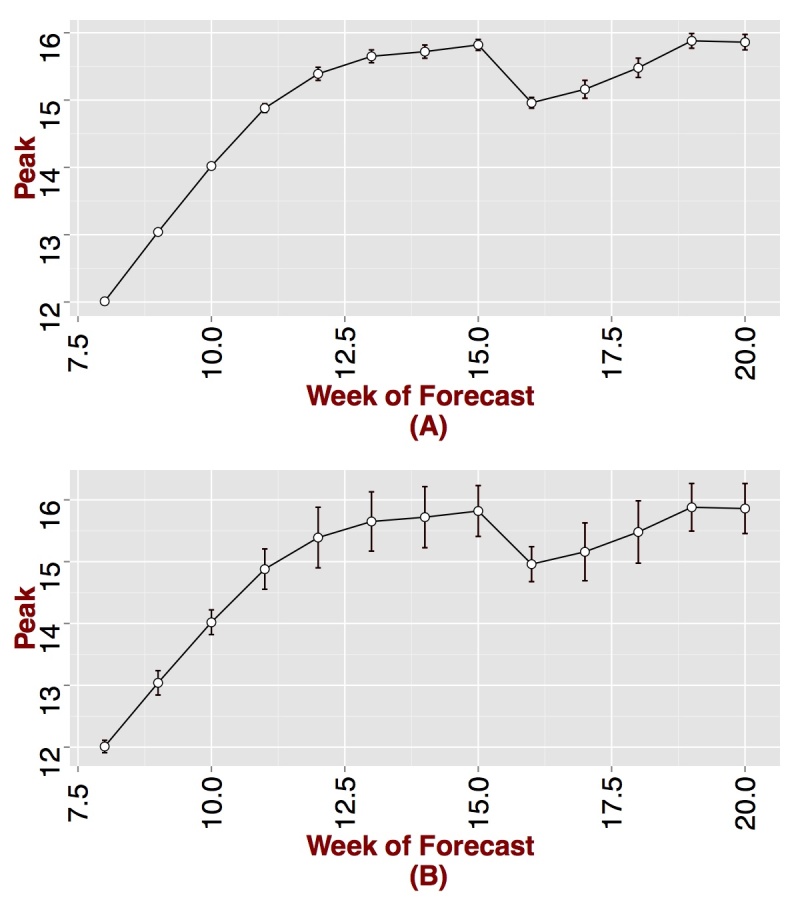
(A) 95% CI around the mean and (B) standard deviations around the mean. The true peak is observed on week 15.
References
-
- Longini IM, Fine PEM, Thacker SB (1986) Predicting the global spread of new infectious agents. American Journal of Epidemiology 123: 383-391. - PubMed
-
- Towers S, Feng Z (2009) Pandemic h1n1 influenza: predicting the course of a pandemic and assessing the efficacy of the planned vaccination programme in the united states. Euro surveillance : bulletin europeen sur les maladies transmissibles = European communicable disease bulletin 14: 19358. - PubMed
Grants and funding
LinkOut - more resources
Full Text Sources
Other Literature Sources