. 2013 Sep;15(9):1067-78.
doi: 10.1038/ncb2804. Epub 2013 Jul 21.

Uba1 functions in Atg7- and Atg3-independent autophagy

Affiliations

Uba1 functions in Atg7- and Atg3-independent autophagy

Tsun-Kai Chang et al. Nat Cell Biol. 2013 Sep.

Abstract

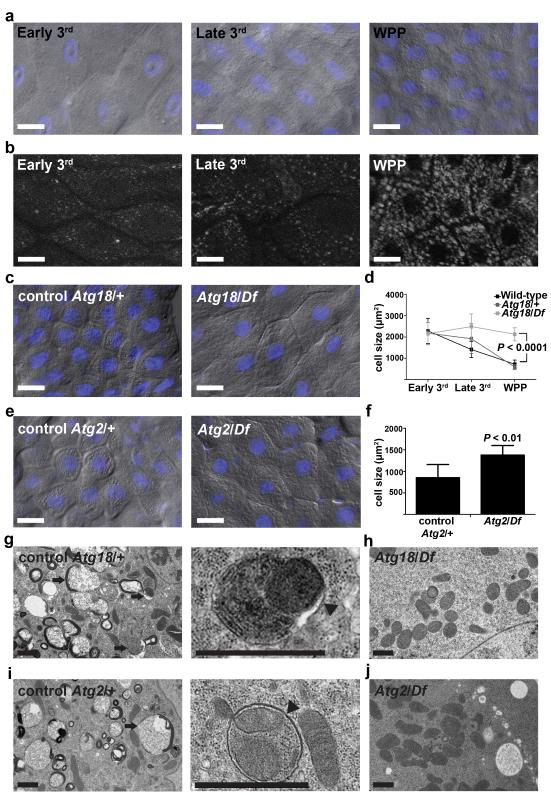
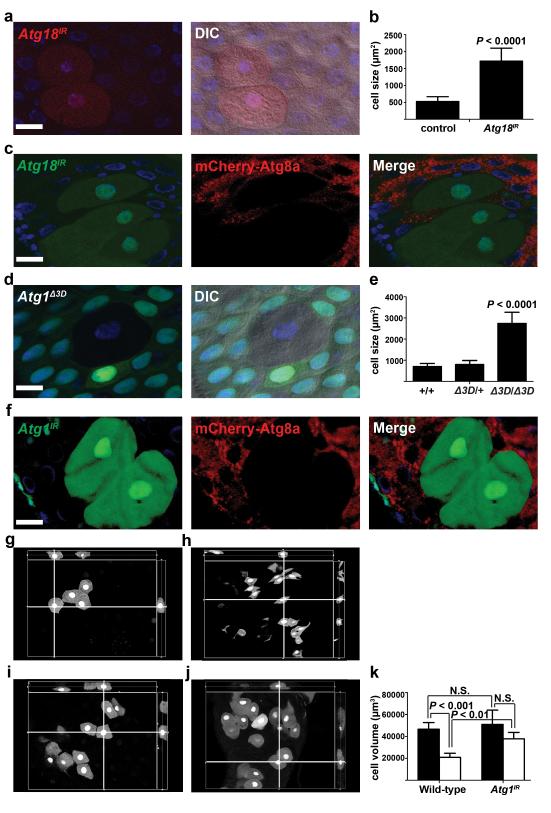
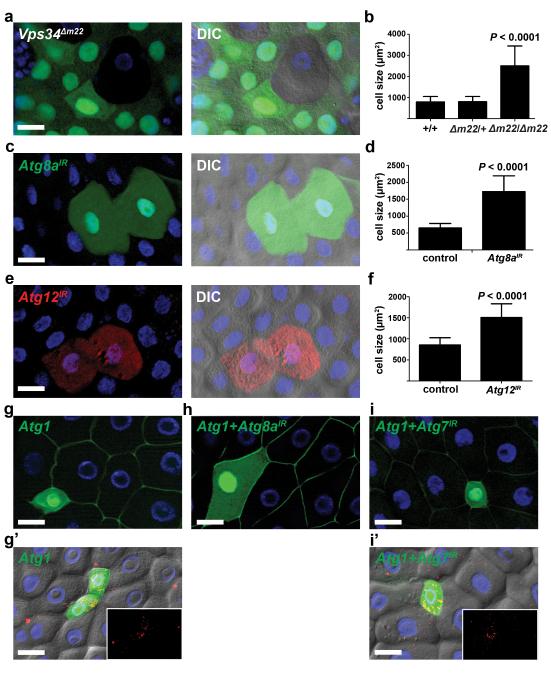
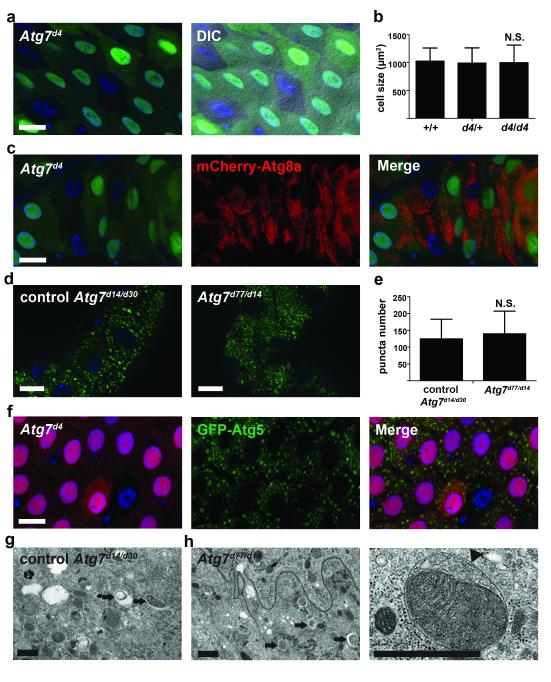
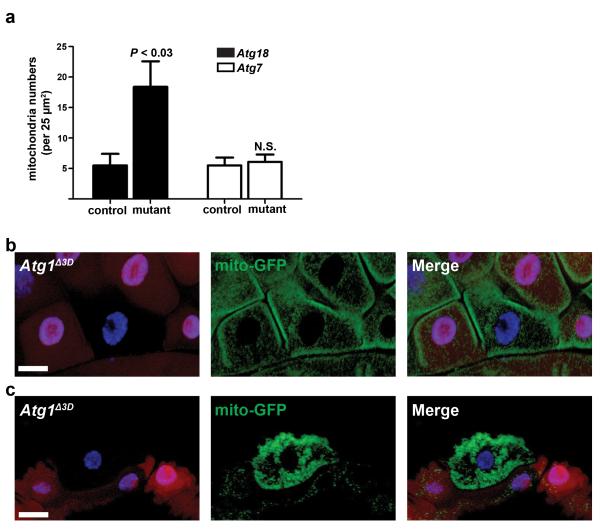
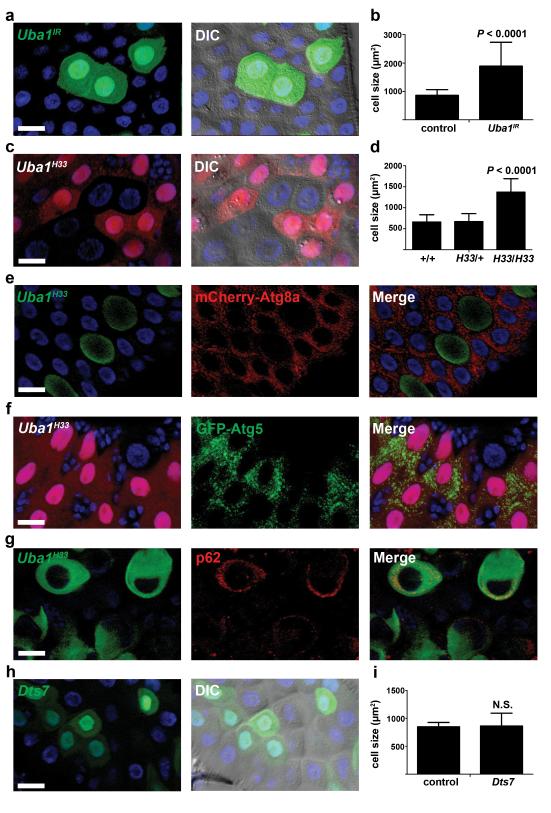
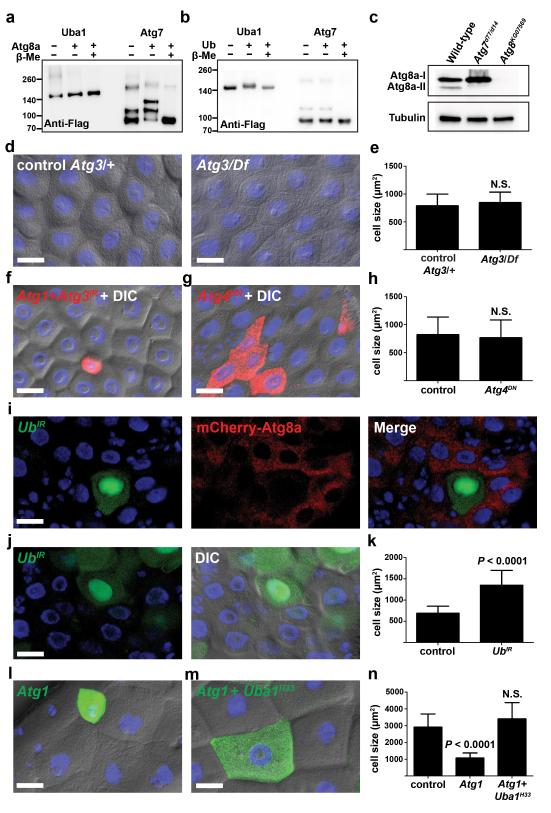
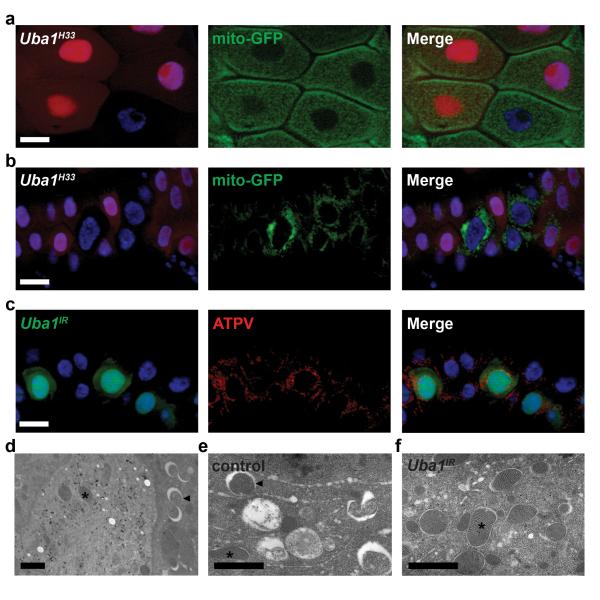
Autophagy is a conserved process that delivers components of the cytoplasm to lysosomes for degradation. The E1 and E2 enzymes encoded by Atg7 and Atg3 are thought to be essential for autophagy involving the ubiquitin-like protein Atg8. Here, we describe an Atg7- and Atg3-independent autophagy pathway that facilitates programmed reduction of cell size during intestine cell death. Although multiple components of the core autophagy pathways, including Atg8, are required for autophagy and cells to shrink in the midgut of the intestine, loss of either Atg7 or Atg3 function does not influence these cellular processes. Rather, Uba1, the E1 enzyme used in ubiquitylation, is required for autophagy and reduction of cell size. Our data reveal that distinct autophagy programs are used by different cells within an animal, and disclose an unappreciated role for ubiquitin activation in autophagy.


Figures

Figure 1
Figure 1
Atg18 and Atg2 are required for programmed cell size reduction in the Drosophila midgut. (a) Representative differential interference contrast (DIC) microscopy images of midgut cells from wild-type animals at the early third instar larval (Early 3rd), late third instar larval (Late 3rd) and at puparium formation (white prepupal, WPP) stages. (b) Autophagy detected by formation of mCherry-Atg8a punctate spots in midgut cells from wild-type animals at indicated stages. Representative images are shown. (c) Midguts from control Atg18KG03090/wild-type (Atg18/+), n =14, and Atg18KG03090/Df(3L)6112 mutant (Atg18/Df), n = 11, animals at puparium formation analyzed by DIC microscopy. Representative images are shown. (d) Wild-type, control (Atg18KG03090/+) and Atg18 mutant (Atg18/Df) midgut cell size quantification (μm2) at indicated stages, n = 10 animal intestines/genotype with 5 cells measured/intestine/stage. (e) DIC images of midgut cells from Atg2EP3697/wild-type control (Atg2/+) and Atg2EP3697/Df(3L)6091 mutant (Atg2/Df) animals at puparium formation. Representative images are shown. (f) Cell size quantification (μm2) from e, n = 12 (Atg2/+) and n = 7 (Atg2/Df) animal intestines/genotype with 5 cells measured/intestine. (g-j) Representative TEM images of intestine cells 2 hours after puparium formation. (g,i) Control Atg18KG03090/wild-type (Atg18/+, g) and Atg2EP3697/wild-type control (Atg2/+, i) cells with an enlarged image showing a double membrane structure (arrowhead) that surrounds a mitochondrion and endoplasmic reticulum. Arrows indicate autolysosomes. (h,j) Atg18KG03090/Df(3L)6112 mutant (Atg18/Df, h) cell and Atg2EP3697/Df (Atg2/Df, j) mutant cells lacking autophagic structures. Quantification is shown as mean ± standard deviation (s.d.). Scale bars represent 20 μm (a-c and e) and 1 μm (g-j).
Figure 2
Figure 2
Programmed size reduction is cell autonomous and requires Atg18 and Atg1. (a) Midguts dissected from animals expressing Atg18IR specifically in DsRed-marked clones of cells at puparium formation and analyzed by fluorescence and DIC microscopy. Representative images are shown. (b) Quantification (μm2) from a, n = 12 animal intestines/genotype with 1-5 cells measured/intestine. (c) Midguts expressing mCherry-Atg8a in all cells, and expressing Atg18IR specifically in GFP-marked cell clones dissected from animals at 2 h after puparium formation. Representative images are shown. (d) Midguts dissected from animals at puparium formation that contain an Atg1Δ3D loss-of-function mutant cell clone (lacking GFP) and analyzed by fluorescence and DIC microscopy. Wild-type (+/+) control cell possesses stronger GFP and heterozygous Atg1Δ3D/wild-type (Δ3D/+) cells have weaker GFP. Representative images are shown. (e) Quantification (μm2) from d, n = 7 (+/+), n = 8 (Δ3D/+), and n = 8 (Δ3D/Δ3D) animal intestines/genotype with 1-5 cells measured/intestine. (f) Midguts dissected from animals expressing mCherry-Atg8a in all cells, and expressing Atg1IR specifically in GFP-marked clones of cells at 2 h after puparium formation. Representative images are shown. (g-j) Representative cut views from 3D reconstitution images from wild-type (g,h) and Atg1 knockdown (i,j) cells at early 3rd instar larval stage (g,i) and at puparium formation (h,j). (k) Quantification of cell volume (μm3) from g-j, n = 5 animal intestines/genotype with 1-5 cells measured/intestine/stage. Black columns: early 3rd instar larval stage. White columns: puparium formation stage. Quantification is shown as mean ± s.d.. N.S.: no significance. Scale bars represent 20 μm.
Figure 3
Figure 3
Autophagy is necessary and sufficient for cell size reduction. (a) Midguts dissected from animals at puparium formation that contain Vps34Δm22 loss-of-function mutant cell clones (lacking GFP) and analyzed by fluorescence and DIC microscopy. Wild-type (+/+) control cells possess stronger GFP and heterozygous Vps34Δm22/wild-type (Δm22/+) cells have weaker GFP. Representative images are shown. (b) Quantification (μm2) from a, n = 14 animal intestines/genotype with 1-5 cells measured/intestine. (c) Midguts dissected from animals expressing Atg8aIR specifically in GFP-marked clones of cells at puparium formation and analyzed by fluorescence and DIC microscopy. Representative images are shown. (d) Cell size quantification (μm2) from c, n = 10 animal intestines/genotype with 1-5 cells measured/intestine. (e) Midguts dissected from animals expressing Atg12IR specifically in DsRed-marked clones of cells at puparium formation and analyzed by fluorescence and DIC microscopy. Representative images are shown. (f) Cell size quantification (μm2) from e, n = 14 animal intestines/genotype with 1-5 cells measured/intestine. (g-i) Midguts dissected from early third instar larvae that mis-express Atg1GS10797 (Atg1) (g, GFP in nucleus and cytoplasm), both Atg1 + Atg8aIR (h), or both Atg1 + Atg7IR (i) and stained to detect Discs large (green) on the cortex of all cells. Representative images are shown. (g’ and i’) DIC images of midguts expressing mCherry-Atg8a in all cells, Atg1 (g’), and Atg1 + Atg7IR (i’) in GFP-marked clones of cells. mCherry-Atg8a puncta are shown in insets. Representative images are shown. Quantification is shown as mean ± s.d.. Scale bars represent 20 μm.
Figure 4
Figure 4
Atg7 is not required for programmed cell size reduction and autophagy. (a) Midguts dissected from animals at puparium formation that contain Atg7d4 loss-of-function mutant cell clones (lacking GFP) and analyzed by fluorescence and DIC microscopy. Wild-type (+/+) control cells possess stronger GFP and heterozygous Atg7d4/wild-type (d4/+) cells have weaker GFP. Representative images are shown. (b) Cell size quantification (μm2) from a, n = 8 animal intestines/genotype with 1-5 cells measured/intestine. (c) Midguts expressing mCherry-Atg8a in all cells, and with Atg7d4 loss-of-function clone cells (lacking GFP) at 2h after puparium formation. Representative images are shown. (d) Gastric caeca expressing GFP-Atg8a in all cells from control (Atg7d30/d14) and Atg7 mutant (Atg7d77/d14) animals. Representative images are shown. (e) Quantification of GFP-Atg8a puncta number from d, n = 31 animal intestines/genotype with puncta quantified in image field/intestine. (f) Midguts expressing GFP-Atg5 in in enterocytes (larger nuclei) with an Atg7d4 loss-of-function clone cell (lacking RFP) at puparium formation. Representative images are shown. (g,h) Representative TEM images of intestine cells 2 h after puparium formation. Arrows indicate autolysosomes. (g) Control (Atg7d30/d14) and (h) Atg7 mutant (Atg7d77/d14) cells both contain autophagic structures. (h) Enlarged Atg7 mutant cell image of a double membrane autophagosome (arrowhead) surrounding a mitochondrion. Quantification is shown as mean ± s.d.. N.S.: no significance. Scale bars represent 20 μm (a,c,d, and f) and 1 μm (g,h).
Figure 5
Figure 5
Autophagy is required for clearance of mitochondria. (a) Quantification of mitochondria numbers from Atg18 control (Atg18KG03090/wild-type) and mutant (Atg18KG03090/Df(3L)6112) or Atg7 control (Atg7d30/d14) and mutant (Atg7d77/d14) TEM images. Mitochondria were quantified from 2 distinct 25 μm2 regions per cell from 2 cells per animal from at least 3 different animals/genotype. (b, c) Midguts dissected from either early third instar larvae (b) or at puparium formation (c) that express GFP-labeled mitochondria in all cells and contain an Atg1Δ3D loss-of-function mutant cell clone (lacking RFP). Wild-type control cells possess stronger RFP and heterozygous cells have weaker RFP. Representative images are shown. Quantification is shown as mean ± s.d.. N.S.: no significance. Scale bars represent 20 μm.
Figure 6
Figure 6
Uba1 is required for midgut cell programmed size reduction and autophagy. (a) Midguts dissected from animals expressing Uba1IR specifically in GFP-marked clones of cells at puparium formation and analyzed by fluorescence and DIC microscopy. Representative images are shown. (b) Cell size quantification (μm2) from a, n = 16 animal intestines/genotype with 1-5 cells measured/intestine. (c) Midguts dissected from animals at puparium formation that contain Uba1H33 loss-of-function mutant cell clones (lacking RFP) and analyzed by fluorescence and DIC microscopy. Wild-type (+/+) control cells possess stronger RFP and heterozygous Uba1H33/wild-type (H33/+) cells have weaker RFP. Representative images are shown. (d) Quantification (μm2) from c, n = 8 (+/+), n = 11 (H33/+), and n =11 (H33/H33) animal intestines/genotype with 1-5 cells measured/intestine. (e) Midguts dissected from animals at puparium formation that contain Uba1H33 loss-of-function MARCM mutant cell clones (GFP-positive) that also have mCherry-Atg8a expressed in all cells and analyzed by fluorescence microscopy. Control wild-type and heterozygous cells have no GFP. Representative images are shown. (f) Midguts expressing GFP-Atg5 in enterocytes (larger nuclei), and with an Uba1H33 loss-of-function clone cell (lacking RFP) at puparium formation analyzed by fluorescence microscopy. Representative images are shown. (g) Midguts dissected from animals at puparium formation that contain Uba1H33 loss-of-function MARCM mutant cell clones (GFP-positive) that are stained with p62 antibody and analyzed by fluorescence microscopy. Control wild-type and heterozygous cells have no GFP. Representative images are shown. (h) Midguts dissected from animals expressing Dts7, a dominant temperature sensitive mutant of the β2 subunit of the proteasome, specifically in GFP-marked cells at puparium formation and analyzed by fluorescence and DIC microscopy. Representative images are shown. (i) Cell size quantification (μm2) from h, n = 6 animal intestines/genotype with 1-5 cells measured/intestine. Quantification is shown as mean ± s.d.. N.S.: no significance. Scale bars represent 20 μm.
Figure 7
Figure 7
Role of Uba1 in midgut autophagy. (a and b) E1 charging assay for Uba1 and Atg7 with either Atg8a (a) or Ub (b), n = 2 experiments with independently isolated proteins and analyses. Flag-tagged baculoviral expressed E1s were incubated with either His-tagged Atg8a or Ub in the presence or absence of β-mercaptoethanol, separated by electrophoresis and blotted. Band shift was detected with anti-Flag antibody. Molecular weight ladders are indicated. Representative images are shown. Molecular weights: Flag-Uba1 135 kDa, Flag-Atg7 81 kDa, His-Atg8a 29kDa, Ub 9 kDa. (c) Midgut protein extracts at puparium formation from wild-type, Atg7 mutant (Atg7d77/d14) and Atg8 (Atg8KG07569) mutant blotted with anti-Atg8 and anti-Tubulin, n = 3 independent biological experiments. Representative images are shown. (d) Midguts from control Atg310/wild-type (Atg3/+), and Atg310/Df(3L)cat mutant (Atg3/Df) animals at puparium formation analyzed by DIC microscopy. Representative images are shown. (e) Cell size quantification (μm2) from d, n = 11 (Atg3/+) and n = 9 (Atg3/Df) animal intestines/genotype with 5 cells measured/intestine. (f) Midguts dissected from early 3rd instar larvae that mis-express Atg1GS10797 (Atg1) and Atg3IR only in the DsRed-marked cell clone and analyzed by fluorescence and DIC microscopy. Representative images are shown. (g) Midguts dissected from animals expressing Atg4DN specifically in DsRed-marked clones of cells at puparium formation and analyzed by fluorescence and DIC microscopy. Representative images are shown. (h) Cell size quantification (μm2) from g, n = 10 animal intestines/genotype with 1-5 cells measured/intestine. (i) Midguts dissected from animals expressing mCherry-Atg8a in all cells, and expressing UbIR specifically in GFP-marked clones of cells at puparium formation. Representative images are shown. (j) Midguts dissected from animals expressing UbIR specifically in GFP-marked clones of cells at puparium formation and analyzed by fluorescence and DIC microscopy. Representative images are shown. (k) Cell size quantification (μm2) from j, n = 12 animal intestines/genotype with 1-5 cells measured/intestine. (l,m) Midguts dissected from early third instar larvae that contain Atg1GS10797 (Atg1) mis-expression in either a wild-type GFP positive cell clone (l) or a Uba1H33 loss-of-function MARCM mutant cell clone (GFP-positive) (m) and analyzed by fluorescence and DIC microscopy. Control wild-type and heterozygous Uba1H33/wild-type cells have no GFP. Representative images are shown. (n) Quantification (μm2) from l and m, n = 22 (control), n = 16 (Atg1), and n =6 (Atg1 + Uba1H33) animal intestines/genotype with 1-5 cells measured/intestine. Quantification of control cells (l,m) were pooled since they are genetically identical. Quantification is shown as mean ± s.d.. N.S.: no significance. Scale bars represent 20 μm.
Figure 8
Figure 8
Uba1 is required for clearance of mitochondria. (a, b) Midguts dissected from either early third instar larvae (a) or at puparium formation (b) that express GFP-labeled mitochondria in enterocytes (larger nuclei) and contain Uba1H33 loss-of-function mutant cell clones (lacking RFP). Wild-type control cells possess stronger RFP and heterozygous cells have weaker RFP. Representative images are shown. (c) Midguts dissected at puparium formation that express Uba1IR (GFP in nucleus and cytoplasm) and stained with ATP synthase complex V (ATPV) to detect mitochondria in all cells. Representative images are shown. (d-f) Representative immuno-TEM images of Uba1IR clone cells at puparium formation. Uba1IR-expressing cells possess gold particles, while control cells lack gold particles (d). Control cells possess numerous autolysosomes in the cytoplasm (arrowheads) and few mitochondria (asterisks), while Uba1IR-expressing cells possess numerous mitochondria and few autophagic structures. Scale bars represent 20 μm (a-c) and 1 μm (d-f).

Comment in

References

    1. Mizushima N, Komatsu M. Autophagy: Renovation of Cells and Tissues. Cell. 2011;147:728–741. - PubMed
    1. Levine B, Yuan J. Autophagy in cell death: an innocent convict? J. Clin. Invest. 2005;115:2679–2688. - PMC - PubMed
    1. Baehrecke EH. Autophagy: dual roles in life and death? Nature Reviews Mol. Cell Biol. 2005;6:505–510. - PubMed
    1. Berry DL, Baehrecke EH. Growth arrest and autophagy are required for salivary gland cell degradation in Drosophila. Cell. 2007;131:1137–1148. - PMC - PubMed
    1. Hou YC, Chittaranjan S, Barbosa SG, McCall K, Gorski SM. Effector caspase Dcp-1 and IAP protein Bruce regulate starvation-induced autophagy during Drosophila melanogaster oogenesis. J. Cell Biol. 2008;182:1127–1139. - PMC - PubMed

Publication types

MeSH terms