. 2013 Sep 15;305(6):L419-31.
doi: 10.1152/ajplung.00411.2012. Epub 2013 Jul 19.

Reduced microtubule acetylation in cystic fibrosis epithelial cells

Affiliations

Reduced microtubule acetylation in cystic fibrosis epithelial cells

Sharon M Rymut et al. Am J Physiol Lung Cell Mol Physiol. .

Abstract

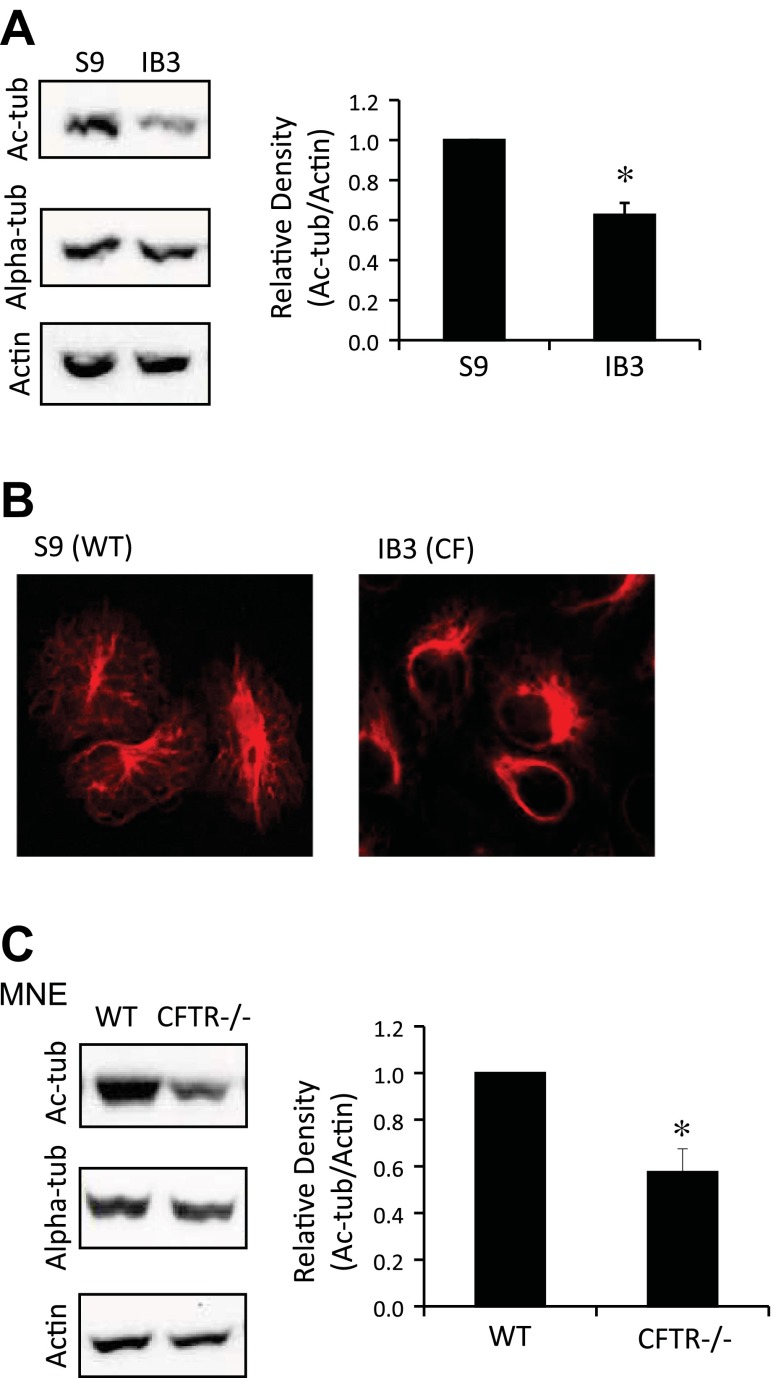
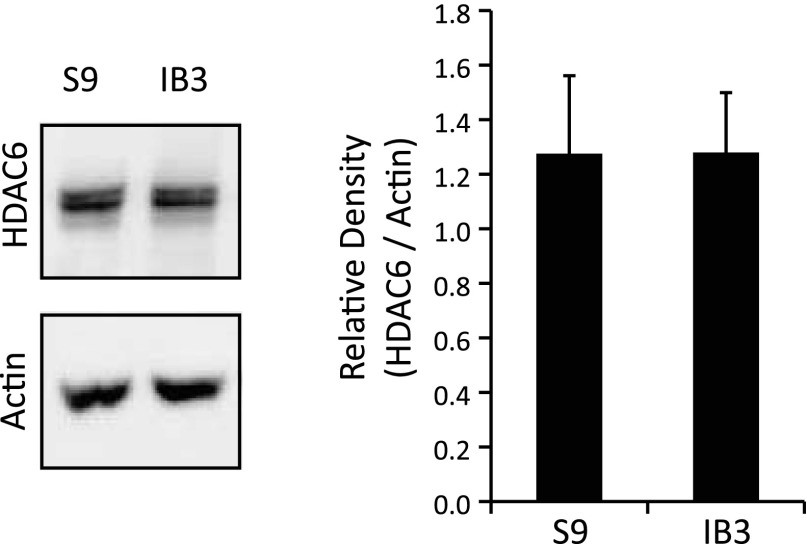
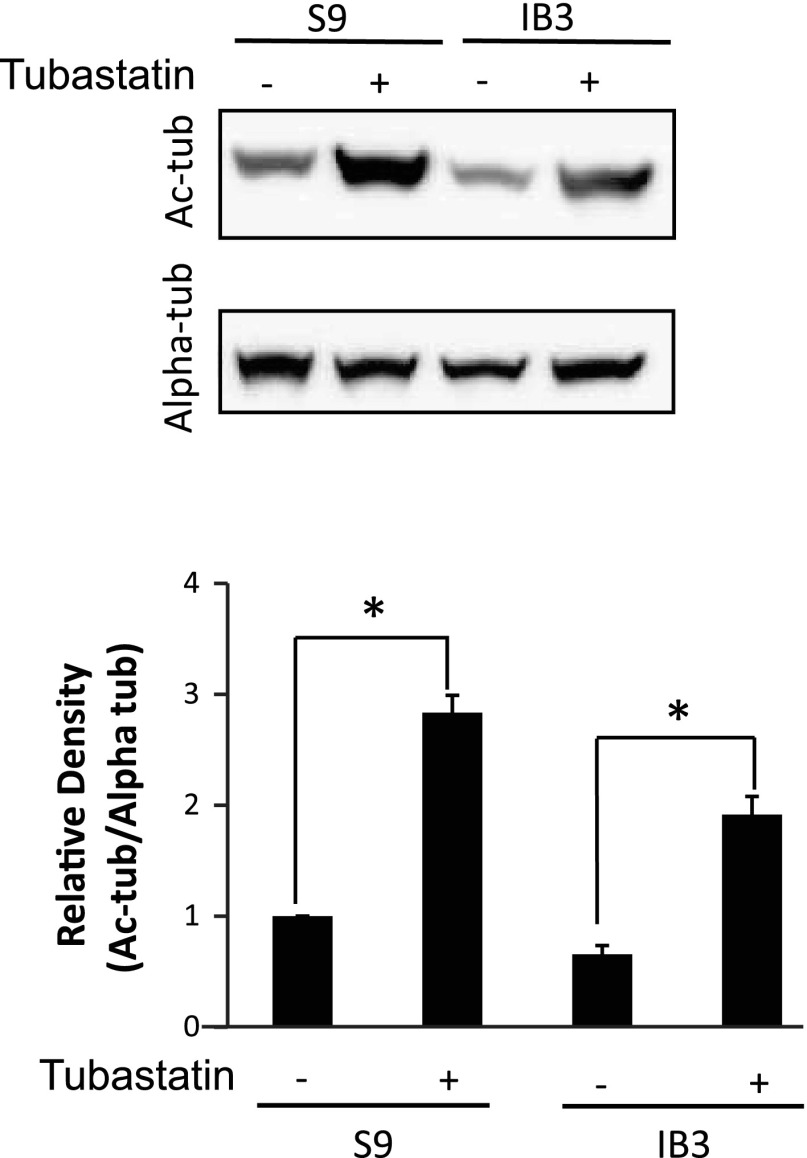
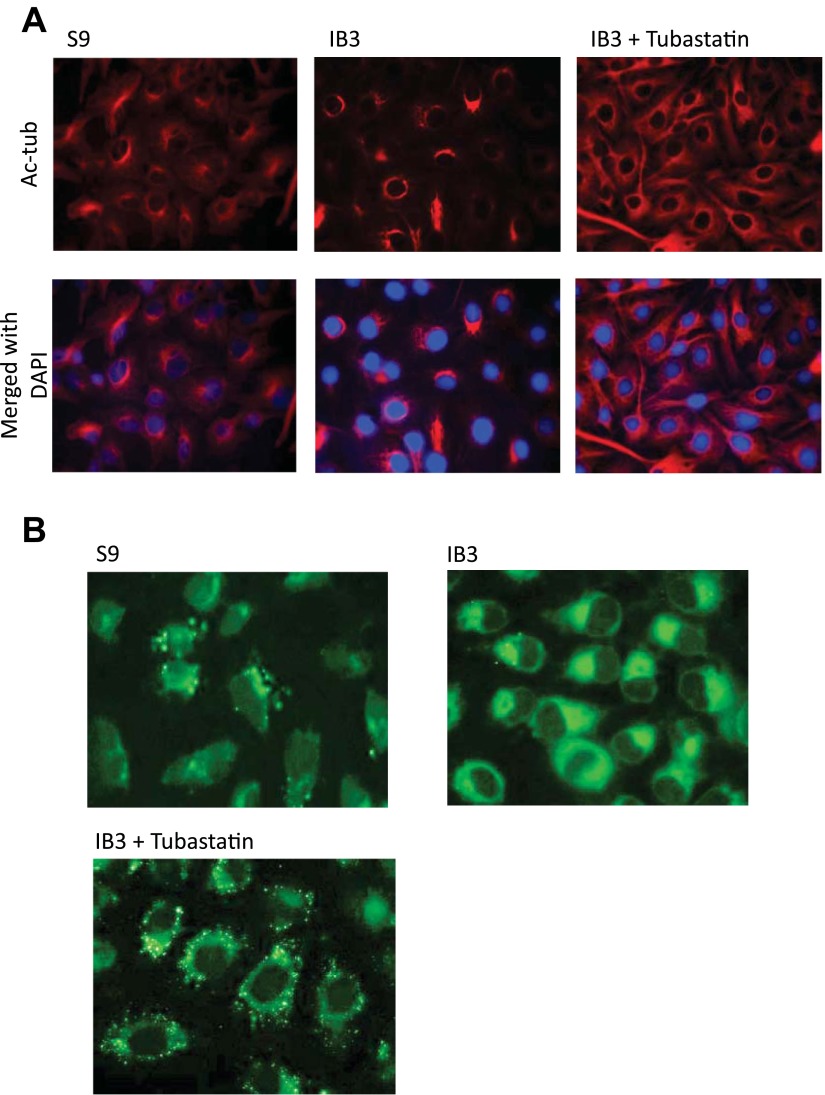
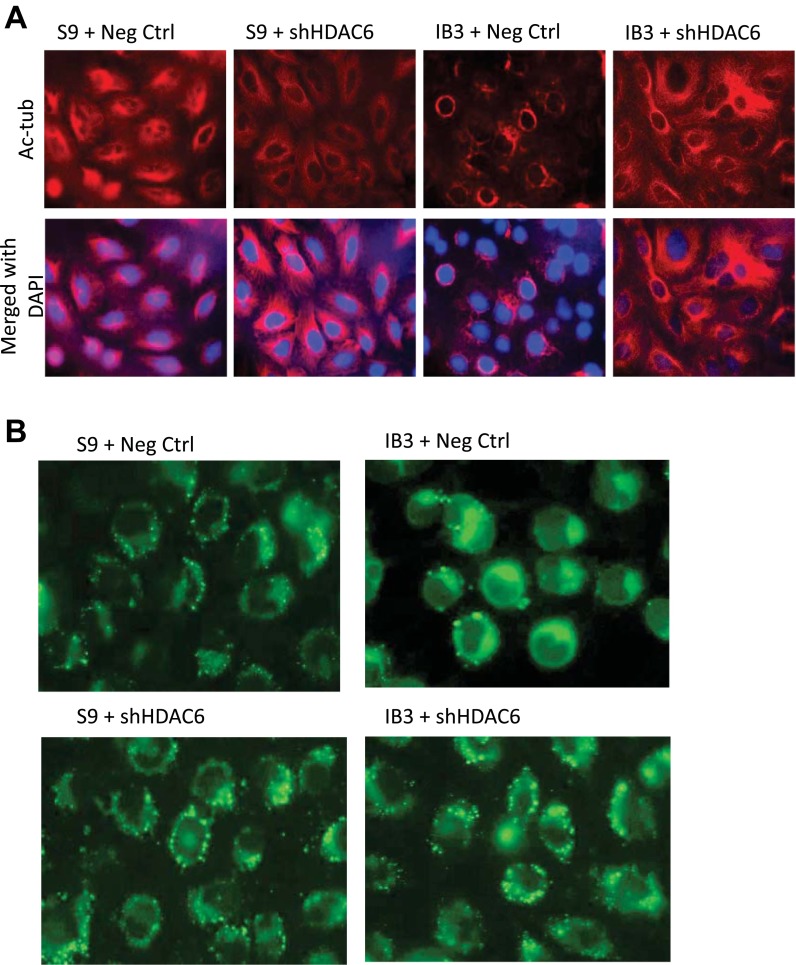
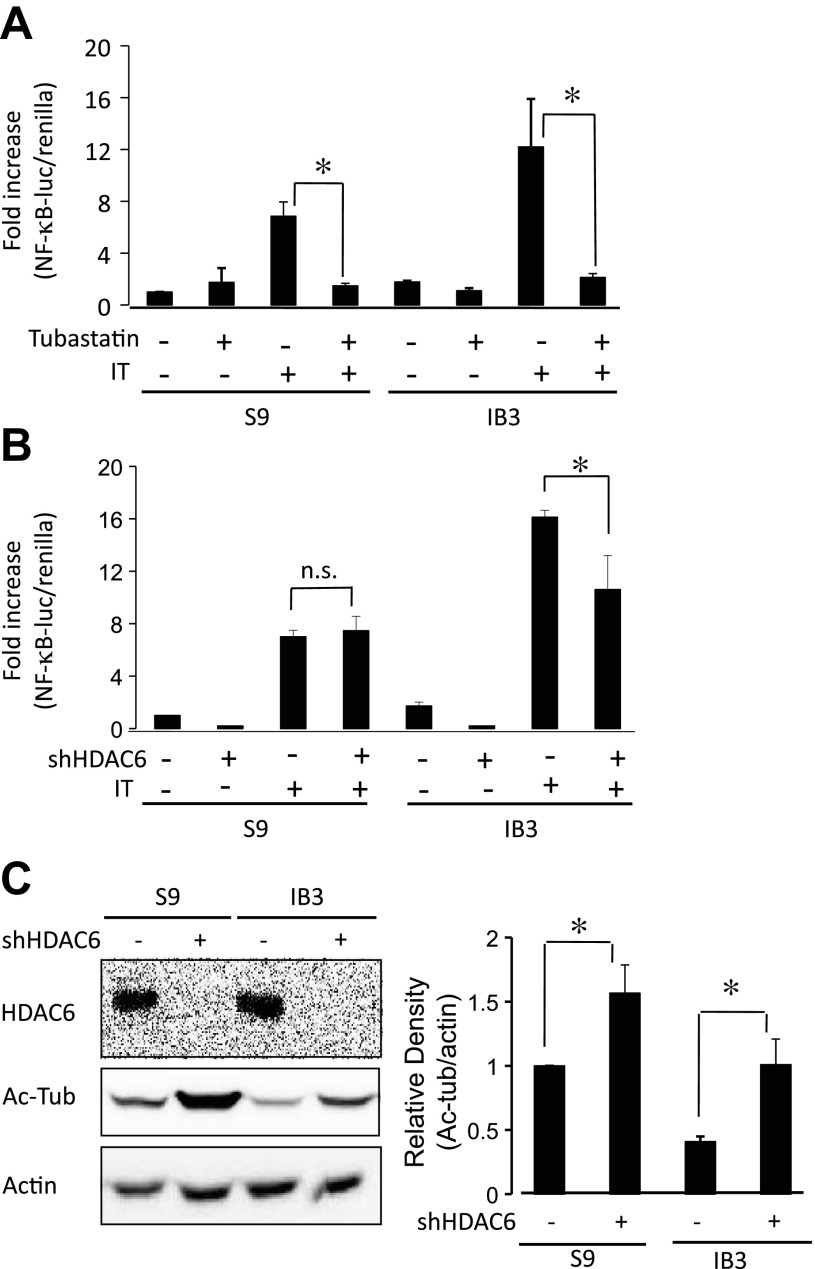
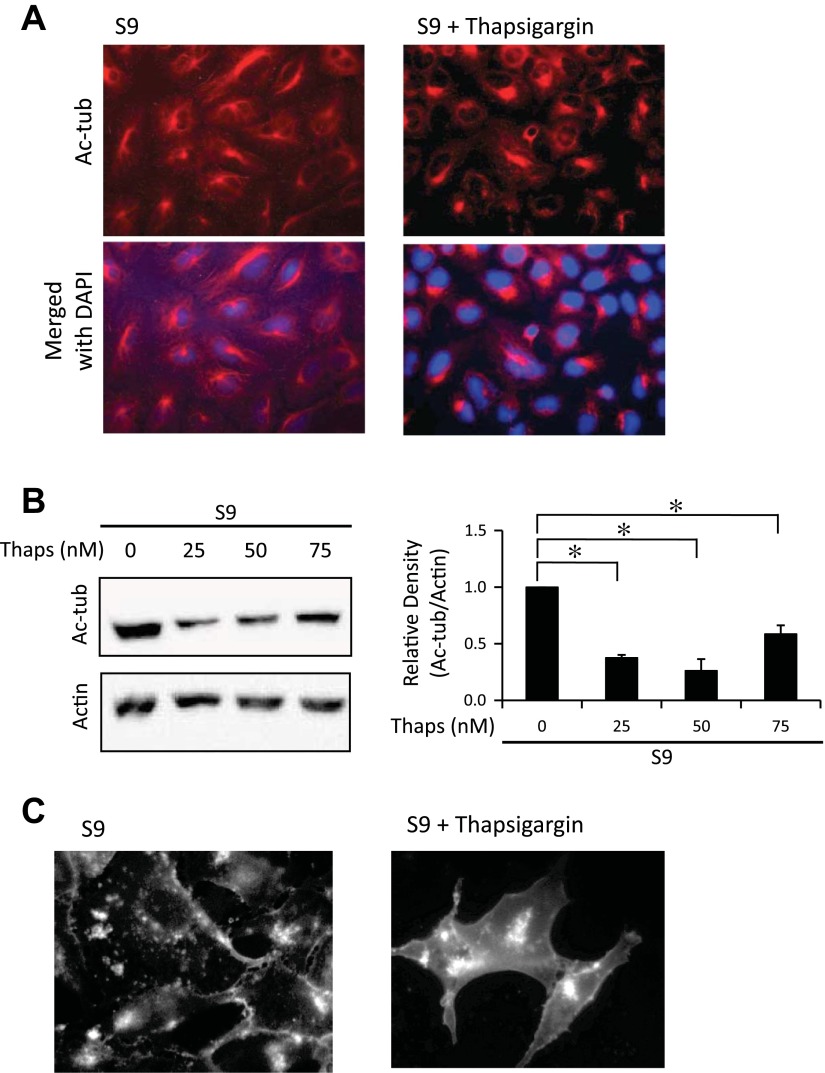
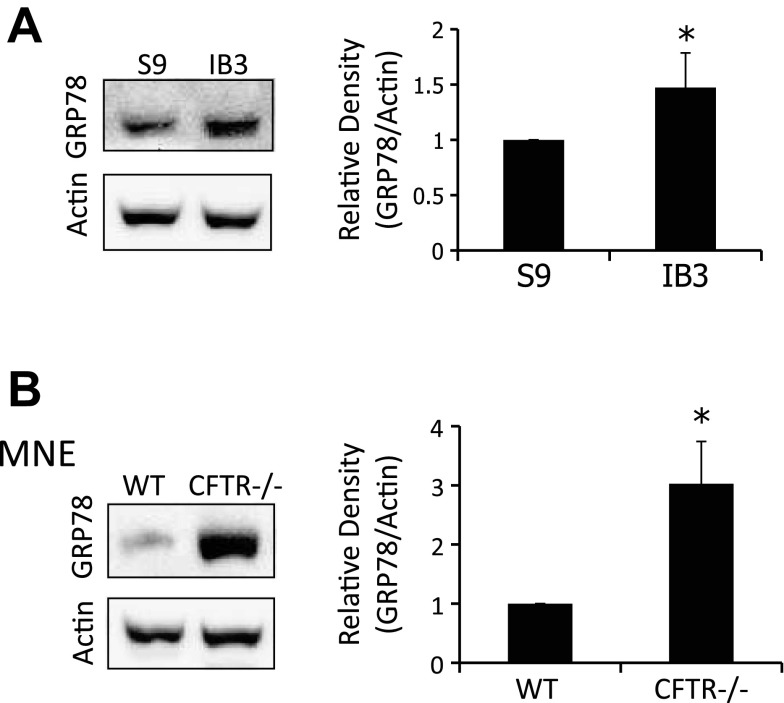
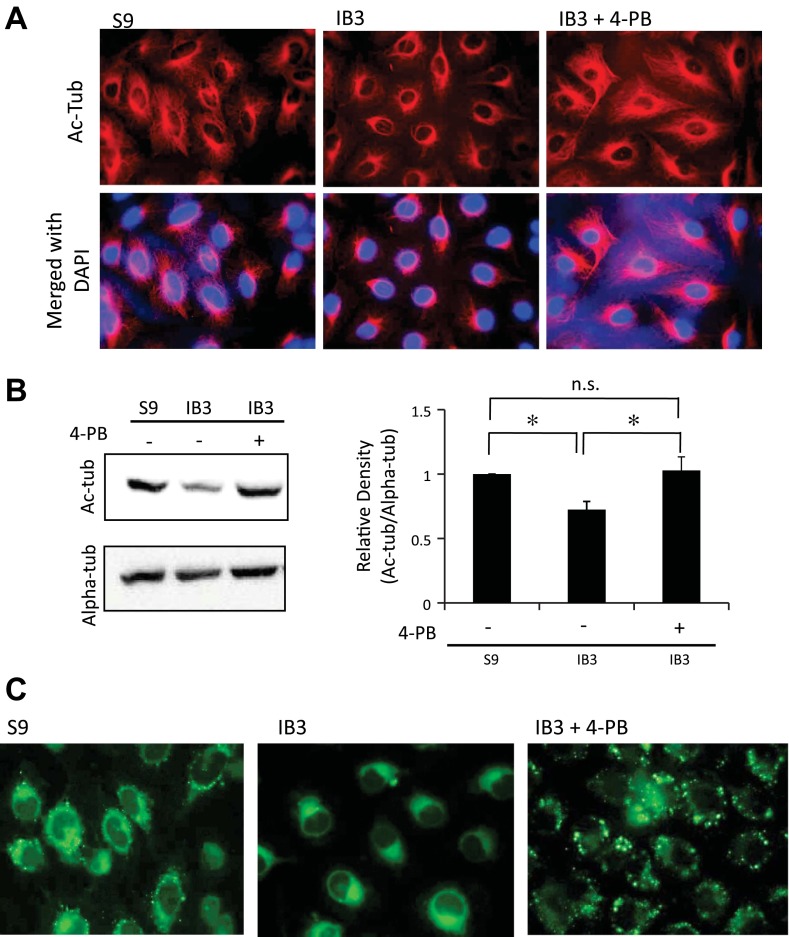
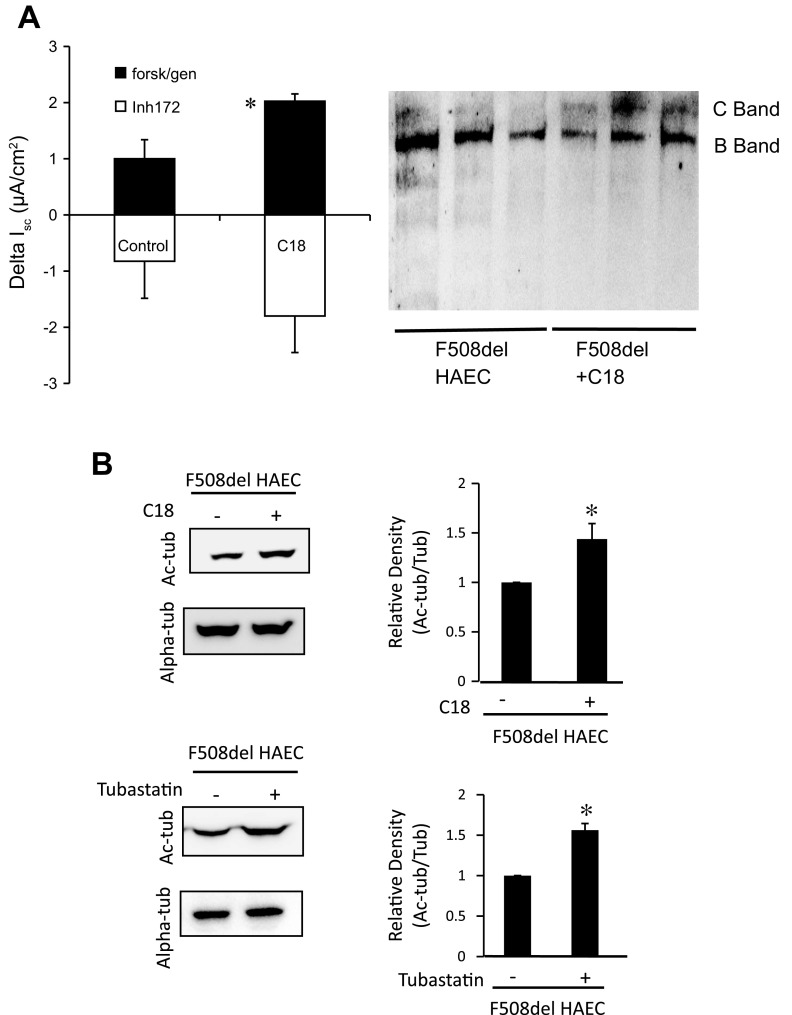
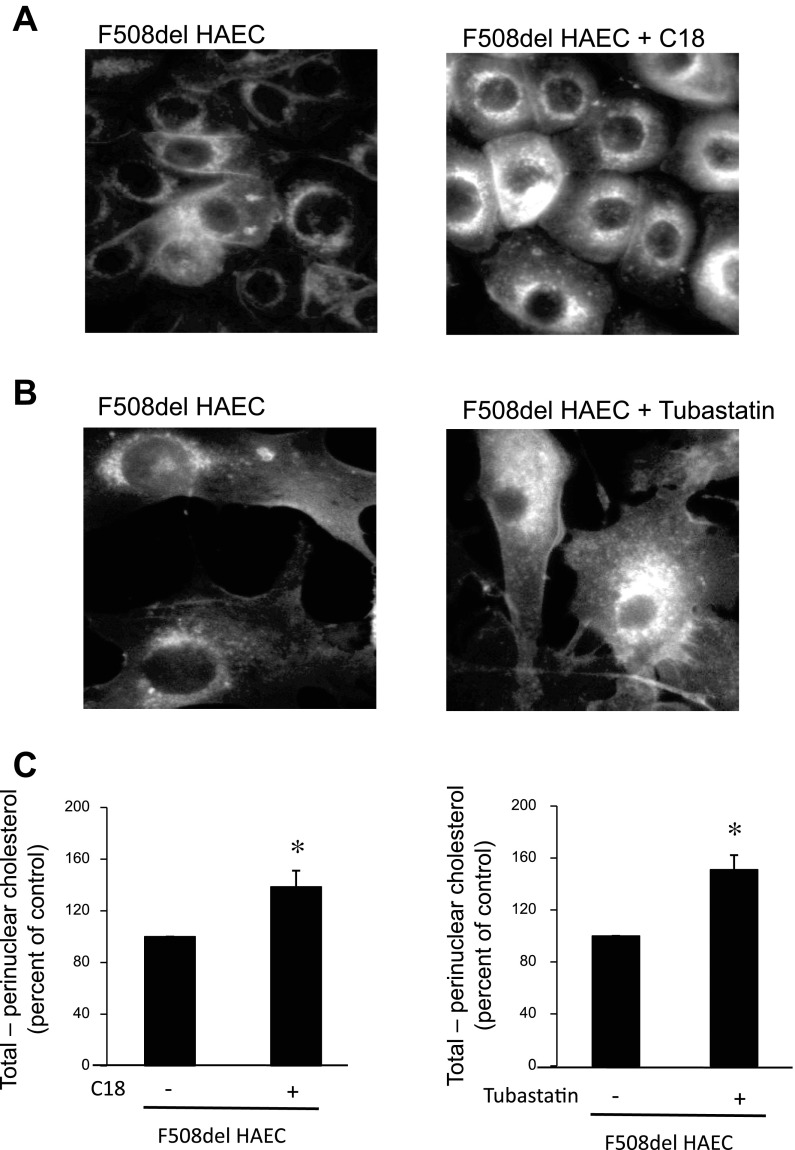
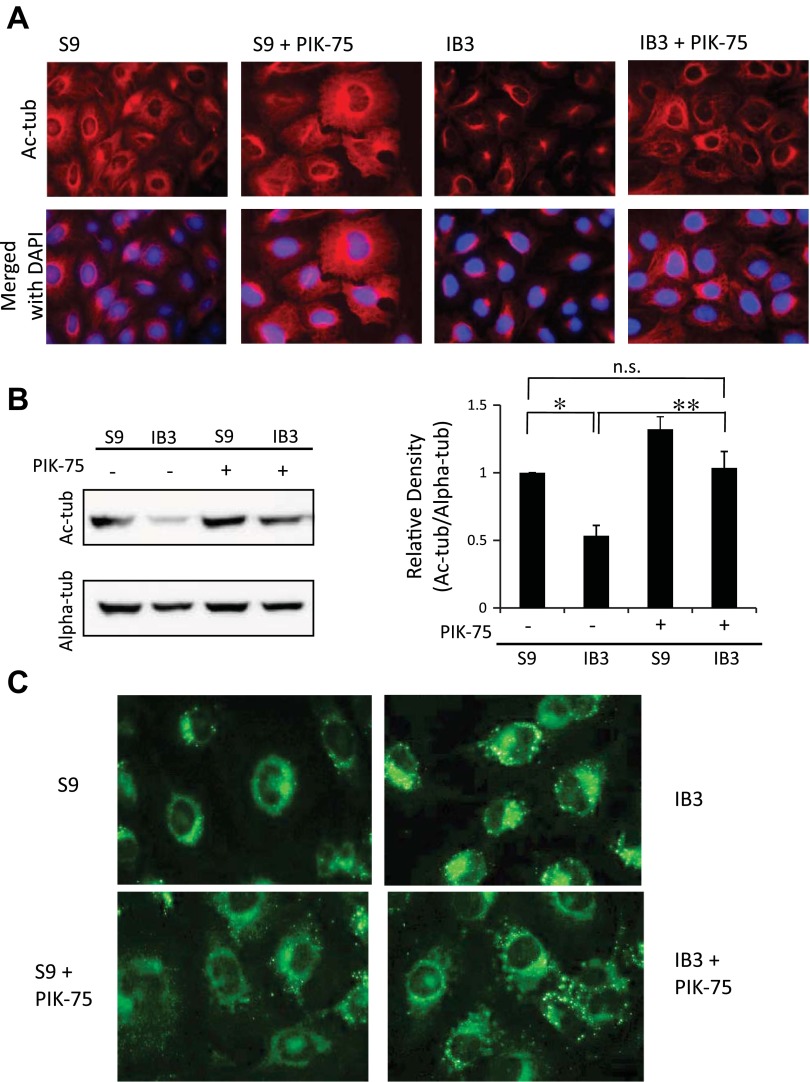
Dysfunctional cystic fibrosis transmembrane conductance regulator (CFTR) leads to many cellular consequences, including perinuclear accumulation of free cholesterol due to impaired endosomal transport. The hypothesis being tested is that CF-related perinuclear cholesterol accumulation due to disrupted endocytic trafficking occurs as a result of reduced microtubule (MT) acetylation. Here, it is identified that acetylated-α-tubulin (Ac-tub) content is reduced by ∼40% compared with respective wild-type controls in both cultured CF cell models (IB3) and primary Cftr-/- mouse nasal epithelial tissue. Histone deacetylase 6 (HDAC6) has been shown to regulate MT acetylation, which provides reasonable grounds to test its impact on reduced Ac-tub content on CF cellular phenotypes. Inhibition of HDAC6, either through tubastatin treatment or HDAC6 knockdown in CF cells, increases Ac-tub content and results in redistributed free cholesterol and reduced stimulation of NF-κB activity. Mechanistically, endoplasmic reticulum stress, which is widely reported in CF and leads to aggresome formation, is identified as a regulator of MT acetylation. F508del CFTR correction with C18 in primary airway epithelial cells restores MT acetylation and cholesterol transport. A significant role for phosphatidyl inositol-3 kinase p110α is also identified as a regulator of MT acetylation.

Keywords: cholesterol; cystic fibrosis; histone deacetylase 6; microtubule; phosphatidyl inositol-3 kinase p110α.


Figures

Fig. 1.
Fig. 1.
Acetylated-α-tubulin (Ac-tub) protein expression and distribution in immortalized cystic fibrosis (CF) cell models. A: wild-type (WT) (S9) and CF (IB3) cells were lysed and analyzed through Western blot. Representative blots and densitometry data of Ac-tub expression normalized to actin protein content are shown. Densitometry was obtained using Quantity One software. Results are presented as relative density (Ac-tub/actin). Significance was determined by t-test (n = 7; *P < 0.001). B: S9 and IB3 cells were immunostained using Ac-tub antibodies. Images are representative of 24 images from 5 separate experiments. C: lysates of excised mouse nasal epithelium (MNE) were analyzed for Ac-tub through Western blotting. Representative blots and densitometry data of Ac-tub expression normalized to actin protein content are shown. Densitometry was obtained using Quantity One software. Results are presented as relative density (Ac-tub/actin). Significance was determined by t-test (n = 8; *P < 0.01). CFTR, cystic fibrosis transmembrane conductance regulator.
Fig. 2.
Fig. 2.
Histone deacetylase 6 (HDAC6) expression in cultured WT and CF cells. S9 and IB3 cell lysates were examined for HDAC6 through Western blot analysis. A representative blot and densitometry data of HDAC6 expression normalized to actin protein content are shown. Densitometry was obtained using Quantity One software. Results are presented as relative density (HDAC6/actin). No significant difference in expression is found as determined by t-test (n = 3).
Fig. 3.
Fig. 3.
Effect of tubastatin treatment on Ac-tub content in S9 and IB3 cells. A representative blot and densitometry data of Ac-tub expression normalized to total α-tubulin (Alpha-tub) protein content are shown. Densitometry was obtained using Quantity One software. Results are presented as relative density (Ac-tub/Alpha-tub). Error bars represent SE, and significance was determined by t-test (*P < 0.001, n = 6).
Fig. 4.
Fig. 4.
Effect of pharmacological HDAC6 inhibition on microtubule acetylation and cholesterol transport. A: S9 and IB3 cells were either treated with vehicle or 10 μM tubastatin for 24 h. Cells were fixed and immunostained using Ac-tub antibodies (red) and DAPI (blue). Representative images are shown from triplicate experiments. B: 1-palmitoyl-2-[12-(7-nitro-2–1,3-benzoxadiazol-4-yl) amino] dodecanoyl (NBD)-cholesterol accumulation and redistribution after HDAC6 inhibition in CF cells. S9 and IB3 cells were either treated with vehicle or with 10 μM tubastatin for 24 h, along with NBD-cholesterol, a fluorescent cholesterol probe for 24 h. NBD-cholesterol was washed out of cells with fresh media with either vehicle or tubastatin for 3 h before being fixed. Representative images are shown from triplicate experiments.
Fig. 5.
Fig. 5.
Effects of HDAC6 knockdown on Ac-tub and cholesterol distribution. A: negative control and shHDAC6 knockdown S9 and IB3 cells were cultured for 3 days and then immunostained with Ac-tub antibodies (red). Nuclei were stained with DAPI (blue). Representative images are shown from triplicate experiments. B: negative control and shHDAC6 knockdown S9 and IB3 cells were cultured for 3 days and then stained with NBD-cholesterol for 18 h. Cells were washed out for 3 h with fresh media before being fixed. Representative images are shown from triplicate experiments.
Fig. 6.
Fig. 6.
Effects of HDAC6 knockdown on NF-κB activation and Ac-tub protein expression. A: effect of tubastatin on NF-κB-luciferase activation in S9 and IB3 cells stimulated with IL-1β/TNF-α (IT). Data presented as a fold increase compared with untreated S9 cells using the ratio of reporter construct per Renilla luciferase control as relative light units (NF-κB-luciferase/Renilla). Error bars represent SE; n = 4 for each condition. Significance determined by ANOVA with a Newman-Keuls post hoc multiple-comparison test. *P < 0.05. B: effect of HDAC6 knockdown by shRNA (shHDAC6) on NF-κB-luciferase activation in S9 and IB3 cells stably expressing control shRNA or targeted HDAC6 shRNA stimulated with IT. Significance determined by ANOVA with a Newman-Keuls post hoc multiple-comparison test. *P < 0.05; n = 5 for each condition. C: cell lysates of negative control and HDAC6 shRNA (shHDAC6) knockdown S9 and IB3 cells were lysed and analyzed for HDAC6 and Ac-tub by Western blot analysis. Representative blots (left) and densitometry data of Ac-tub expression normalized to actin protein content (right) are shown. Densitometry was obtained using Quantity One software. Results are presented as relative density (Ac-tub/actin). Significance was determined by ANOVA. Comparisons between groups are performed with the Newman-Keuls post hoc test. (n = 6; *P < 0.05).
Fig. 7.
Fig. 7.
Ac-tub protein expression decreases in the presence of endoplasmic reticulum (ER) stress. A: S9 cells were treated with 100 nM thapsigargin for 18 h. Cells were immunostained with Ac-tub antibodies (red) and DAPI (blue). Representative images are shown from triplicate experiments. B: S9 cells were treated with varying concentrations (0–75 nm) of thapsigargin for 18 h. Cell lysates were examined for Ac-tub through Western blot. A representative blot is shown, along with Ac-tub expression normalized to actin densitometry. Densitometry was obtained using Quantity One software. Results are presented as relative density (Ac-tub/actin). Significance was determined by ANOVA. Comparisons between groups were performed with the Newman-Keuls post hoc test with results shown compared with S9 NT (n = 3; *P < 0.05). C: S9 cells were either treated with vehicle or with 50 nM thapsigargin for 48 h and stained for free cholesterol with filipin. Representative images are shown from triplicate experiments.
Fig. 8.
Fig. 8.
ER stress is present in CF cells. A: S9 and IB3 cell lysates were analyzed through Western blot for glucose-regulated protein 78 (GRP78). A representative blot and densitometry data of GRP78 expression normalized to actin protein content are shown. Densitometry was obtained using Quantity One software. Results are presented as relative density (GRP78/actin). Significance was determined by t-test (n = 5; *P < 0.05). B: WT and CFTR−/− MNE were lysed and examined for GRP78 protein expression. A representative blot and densitometry data of GRP78 expression normalized to actin protein content are shown. Densitometry was obtained using Quantity One software. Results are presented as relative density (GRP78/actin). Significance was determined by t-test (n = 4; *P < 0.01).
Fig. 9.
Fig. 9.
Ac-tub protein expression is reestablished after treatment with an ER stress reliever, 4-phenylbutyrate (4-PB). A: S9 and IB3 cells were either treated with vehicle or 1 mM 4-PB for 48 h. Cells were immunostained with Ac-tub antibodies (red) and DAPI (blue). Representative images are shown from 4 experiments. B: S9 and IB3 cells were either treated with vehicle or 1 mM 4-PB for 48 h. Lysates were analyzed for Ac-tub protein expression through Western blot. A representative blot is shown, along with Ac-tub expression normalized to α-tubulin (Alpha-tub) densitometry. Densitometry was obtained using Quantity One software. Results are presented as relative density (Ac-tub/Alpha-tub). Significance was determined by t-test (n = 6; *P < 0.05). C: NBD-cholesterol accumulation and redistribution after relieving ER stress. S9 and IB3 cells were either treated with vehicle or with 1 mM 4-PB for 48 h. All cells were simultaneously incubated with NBD-cholesterol for 24 h. Fresh media with either vehicle or 4-PB was placed on the cells 3 h before being fixed. Representative images are shown from 4 experiments.
Fig. 10.
Fig. 10.
Efficacy of C18 correction of F508del CFTR in primary F508del human airway epithelial cells (HAEC). A: short-circuit current (Isc) responses in F508del HAECs in response to C18 treatment. ΔIsc in response to forskolin (20 μM)/genistein (50 μM) is 2.03 ± 0.67 in C18-treated cells compared with 1.00 ± 0.35 for controls (n = 4; P = 0.03). CFTR-mediated current determined by sensitivity to CFTRinh172 (10 μM). Error bars are SD, and significance is determined by t-test. Representative gel showing F508del CFTR band C in C18-treated cells is also shown. B: either small-molecule CFTR corrector C18 or HDAC6 inhibition with tubastatin leads to increased Ac-Tub expression and cholesterol distribution in F508del HAECs. F508del HAECs were treated with vehicle, 10 μM C18 for 72 h, or 10 μM tubastatin for 24 h. Lysates were analyzed for Ac-tub protein expression through Western blot. A representative blot is shown, along with Ac-tub expression normalized to α-tubulin (tub). Densitometry was obtained using Quantity One software. Results are presented as relative density (Ac-tub/tub). Significance was determined by t-test (C18 treated, n = 4; *P = 0.02; tubastatin treated, n = 3; *P = 0.001).
Fig. 11.
Fig. 11.
Effect of C18 or tubastatin treatment on cholesterol movement in F508del HAECs. CFTR corrector C18 (A) and HDAC6 inhibitor tubastatin (B) were tested for efficacy in improving cholesterol distribution in F508del HAECs. F508del HAECs were treated with vehicle, 10 μM C18 for 72 h, or 10 μM tubastatin for 24 h and imaged for cholesterol by filipin staining. Representative images are shown. C: quantification of cholesterol movement in primary F508del HAECs by subtracting perinuclear fluorescence from total cellular fluorescence (total − perinuclear fluorescence). Individual cells were quantified on multiple images from separate experiments. Each replicate represents data from an individual cell. Data are presented as percentages of control. Error bars represent SE, and significance was determined by t-test (C18 control, n = 35; C18 treated, n = 40; *P = 0.005; tubastatin control, n = 56; tubastatin treated, n = 46; *P < 0.001).
Fig. 12.
Fig. 12.
Mechanism of reestablishing Ac-tub involves p110α subunit of phosphatidyl inositol-3 kinase (PIK3CA). A: S9 and IB3 cells were either treated with vehicle or 0.5 μM PIK-75 for 24 h. Cells were immunostained with Ac-tub antibodies (red) and DAPI (blue). Representative images are shown from 4 experiments. B: S9 and IB3 cells were either treated with vehicle or 0.5 μM PIK-75 for 24 h. Lysates were analyzed for Ac-tub protein expression through Western blot. A representative blot is shown, along with Ac-tub expression normalized to α-tubulin (Alpha-tub) densitometry. Densitometry was obtained using Quantity One software. Results are presented as relative density (Ac-tub/Alpha-tub). Significance was determined by ANOVA. Comparisons between groups were performed with the Newman-Keuls post hoc test (n = 4; *P < 0.05). C: NBD-cholesterol accumulation and redistribution after PIK3CA inhibition. S9 and IB3 cells were either treated with vehicle (top) or with 0.5 μM PIK-75 for 24 h (bottom). All cells were simultaneously incubated with NBD-cholesterol for 24 h. Cells were washed out with fresh media with either vehicle or PIK-75 for 3 h before being fixed. Representative images are shown from 4 experiments.

Similar articles

Cited by

References

    1. Ammerpohl O, Trauzold A, Schniewind B, Griep U, Pilarsky C, Grutzmann R, Saeger HD, Janssen O, Sipos B, Kloppel G, Kalthoff H. Complementary effects of HDAC inhibitor 4-PB on gap junction communication and cellular export mechanisms support restoration of chemosensitivity of PDAC cells. Br J Cancer 96: 73–81, 2007 - PMC - PubMed
    1. Aniento F, Emans N, Griffiths G, Gruenberg J. Cytoplasmic dynein-dependent vesicular transport from early to late endosomes. J Cell Biol 123: 1373–1387, 1993 - PMC - PubMed
    1. Bananis E, Nath S, Gordon K, Satir P, Stockert RJ, Murray JW, Wolkoff AW. Microtubule-dependent movement of late endocytic vesicles in vitro: requirements for Dynein and Kinesin. Mol Biol Cell 15: 3688–3697, 2004 - PMC - PubMed
    1. Bartling TR, Drumm ML. Loss of CFTR results in reduction of histone deacetylase 2 in airway epithelial cells. Am J Physiol Lung Cell Mol Physiol 297: L35–L43, 2009 - PMC - PubMed
    1. Bartoszewski R, Rab A, Jurkuvenaite A, Mazur M, Wakefield J, Collawn JF, Bebok Z. Activation of the unfolded protein response by deltaF508 CFTR. Am J Respir Cell Mol Biol 39: 448–457, 2008 - PMC - PubMed

Publication types

MeSH terms