. 2013 Jul 15;27(14):1610-23.
doi: 10.1101/gad.214080.113.

ATR phosphorylates SMARCAL1 to prevent replication fork collapse

Affiliations

ATR phosphorylates SMARCAL1 to prevent replication fork collapse

Frank B Couch et al. Genes Dev. .

Abstract

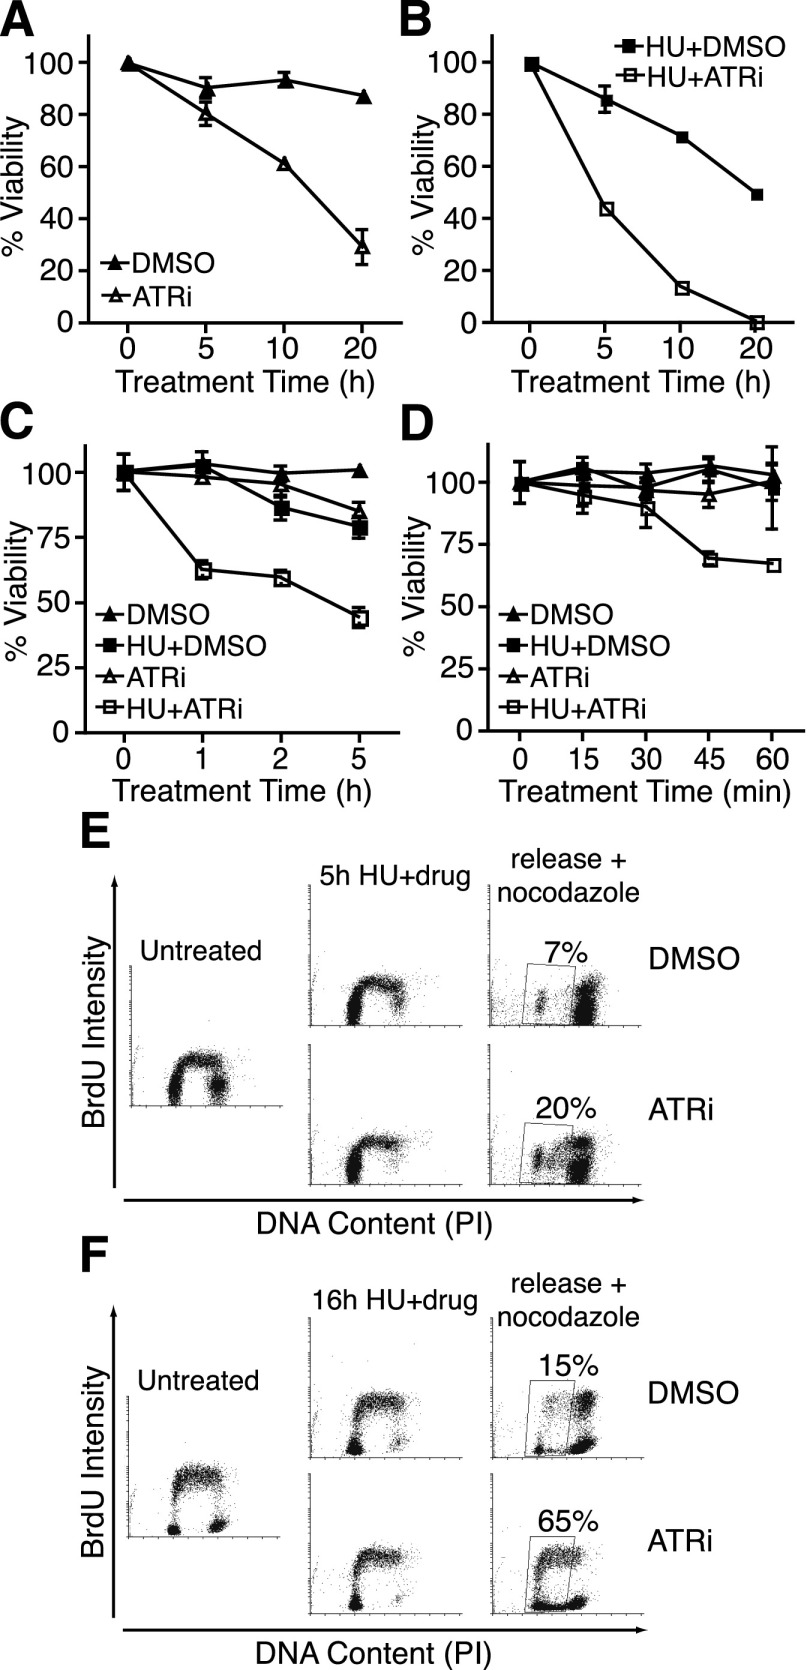
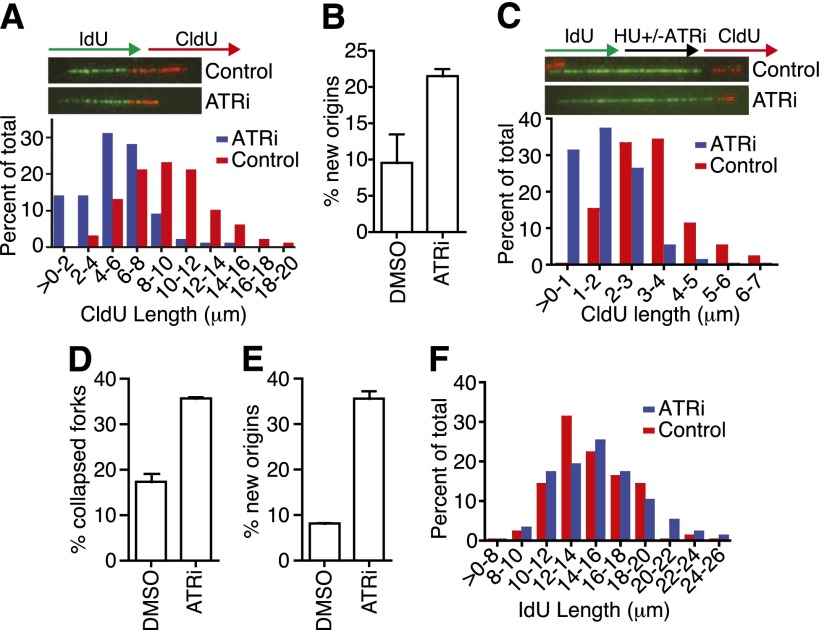
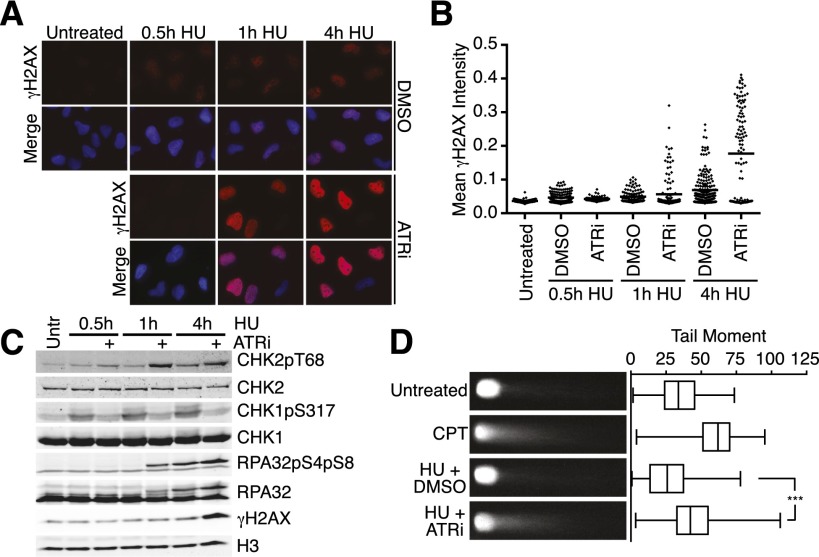
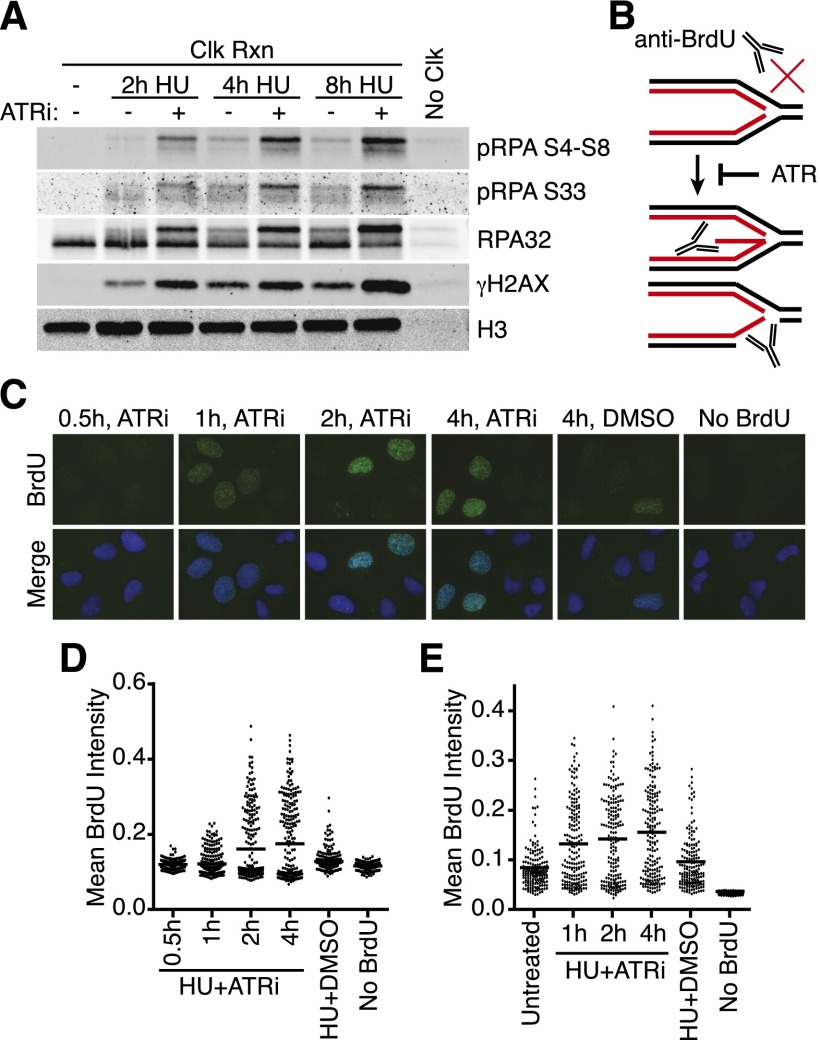
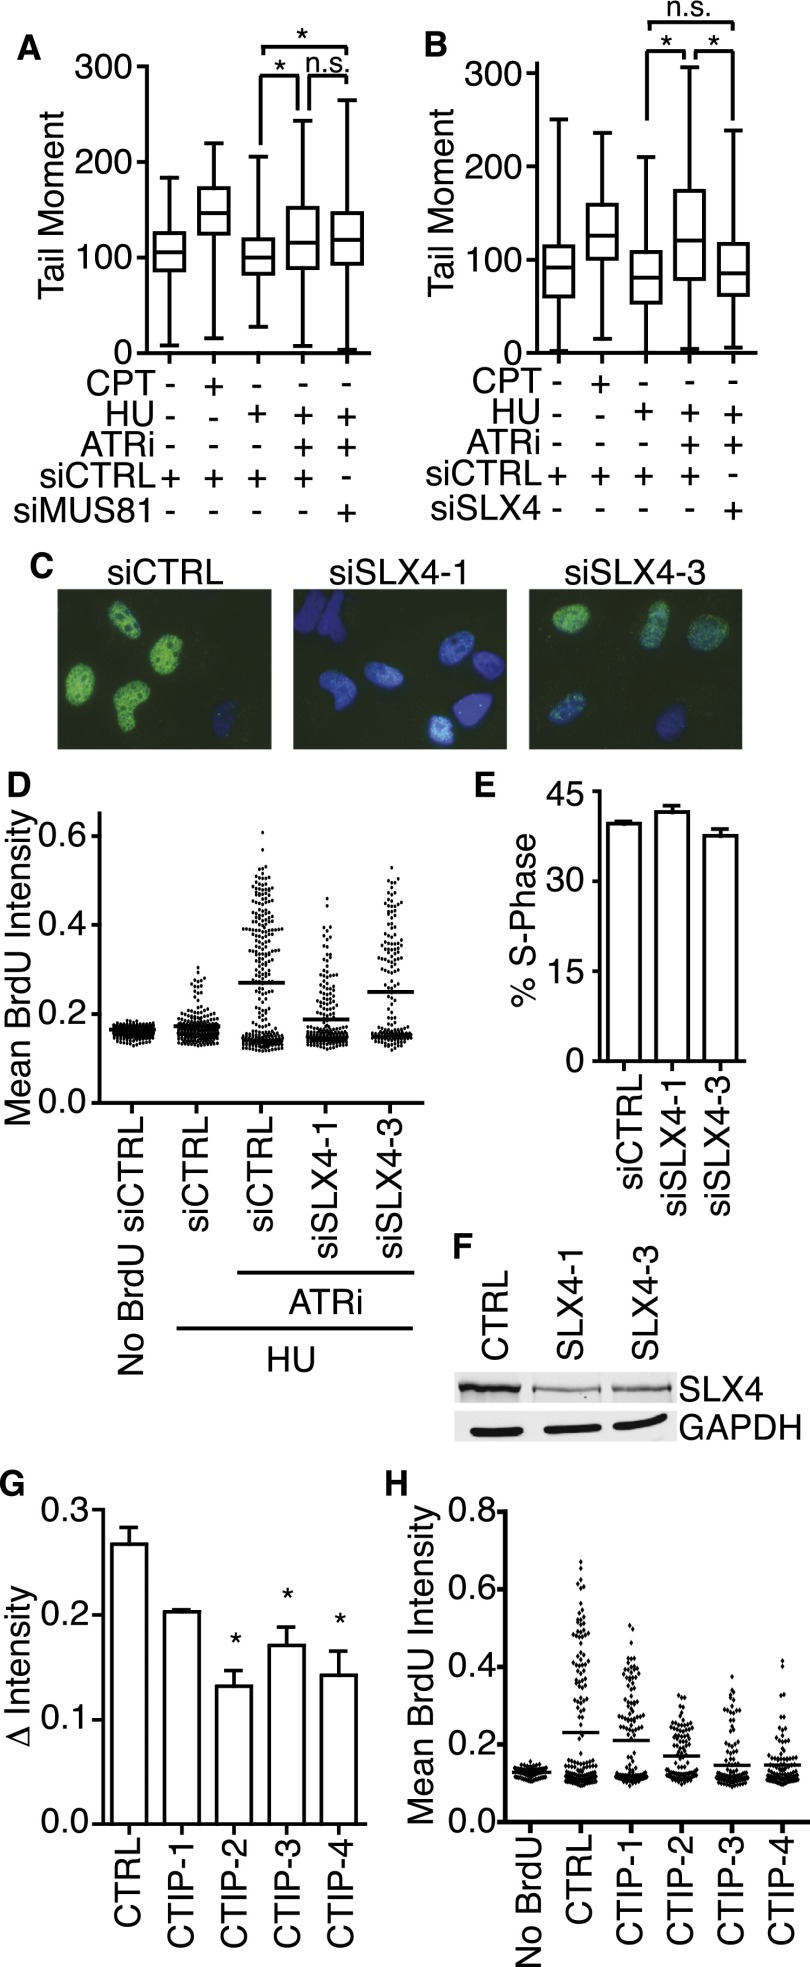
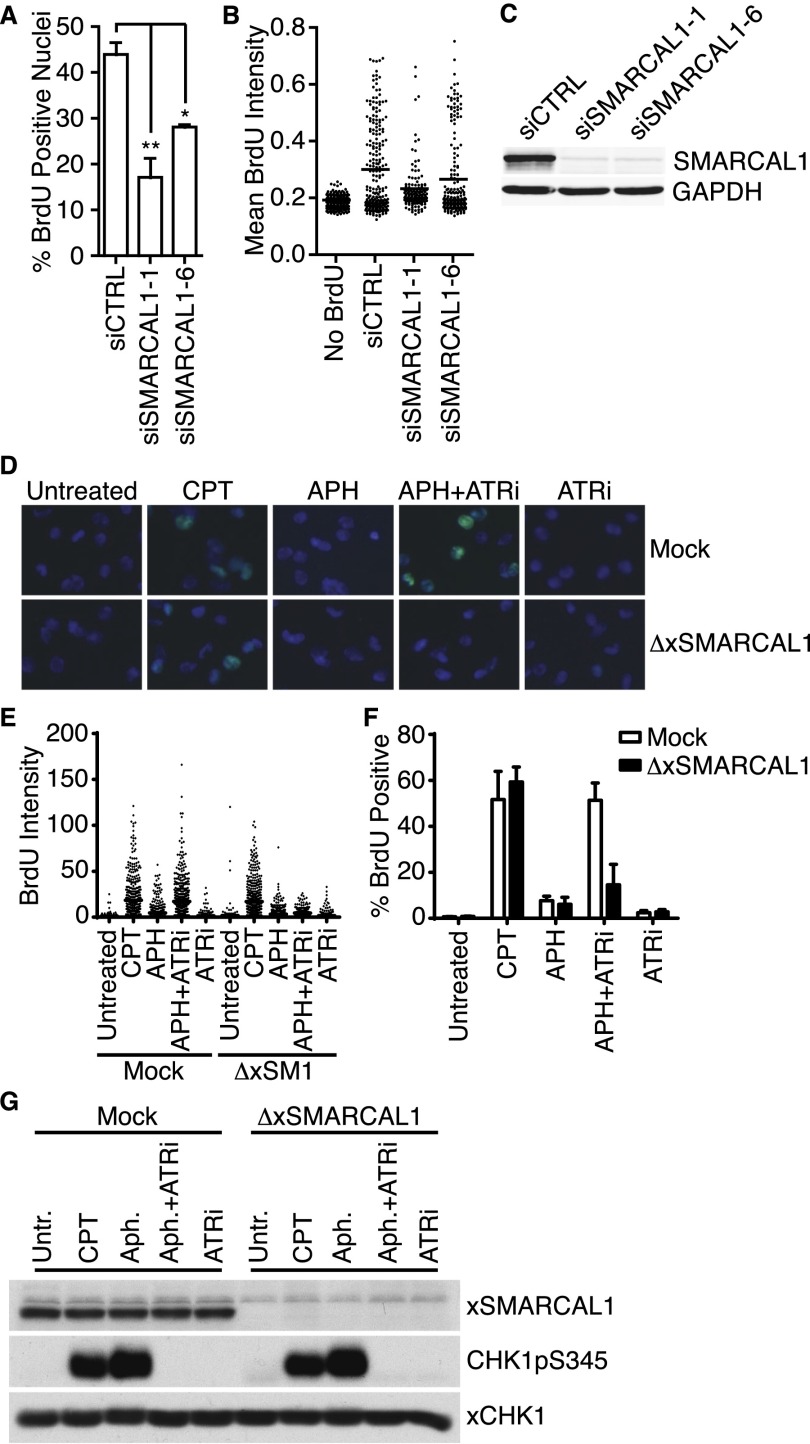
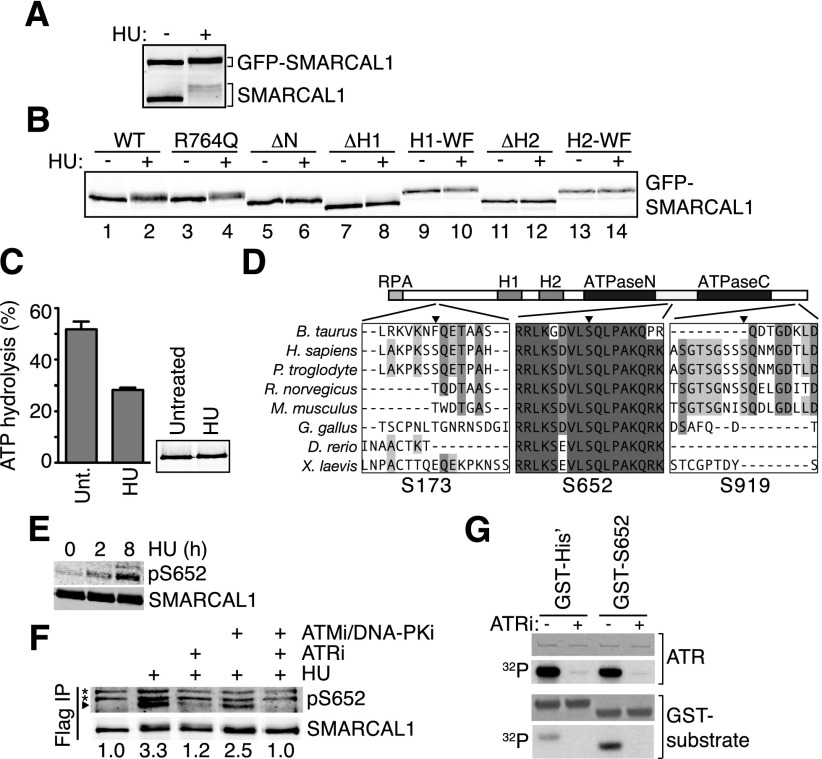
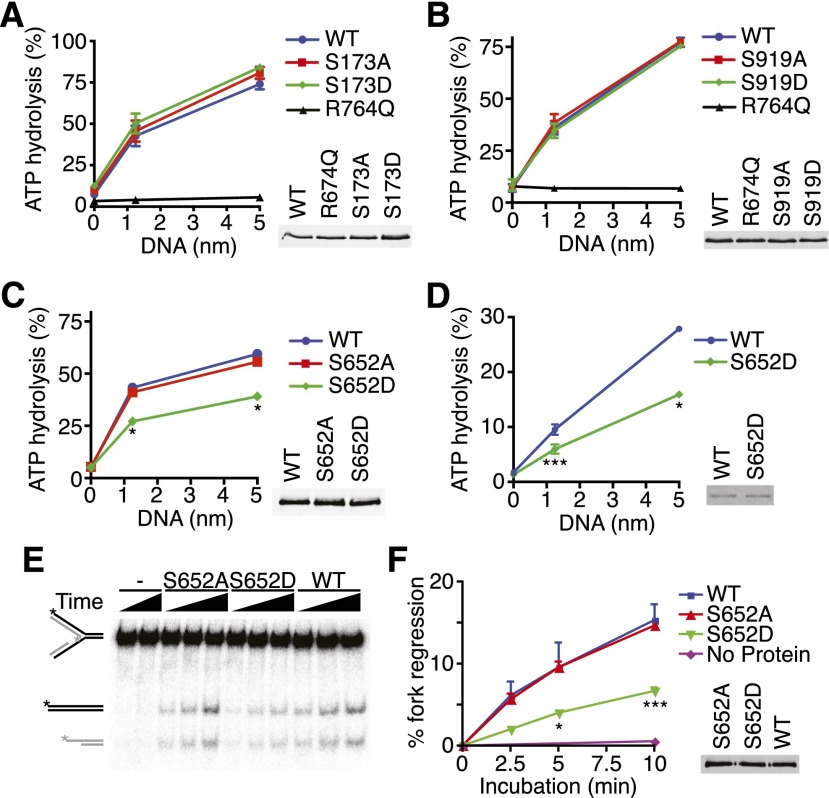
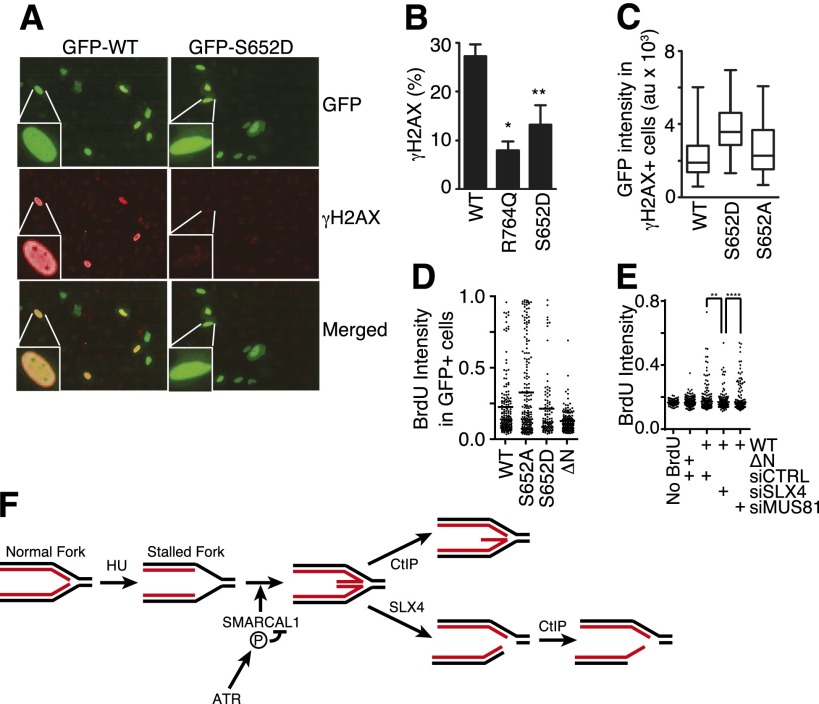
The DNA damage response kinase ataxia telangiectasia and Rad3-related (ATR) coordinates much of the cellular response to replication stress. The exact mechanisms by which ATR regulates DNA synthesis in conditions of replication stress are largely unknown, but this activity is critical for the viability and proliferation of cancer cells, making ATR a potential therapeutic target. Here we use selective ATR inhibitors to demonstrate that acute inhibition of ATR kinase activity yields rapid cell lethality, disrupts the timing of replication initiation, slows replication elongation, and induces fork collapse. We define the mechanism of this fork collapse, which includes SLX4-dependent cleavage yielding double-strand breaks and CtIP-dependent resection generating excess single-stranded template and nascent DNA strands. Our data suggest that the DNA substrates of these nucleases are generated at least in part by the SMARCAL1 DNA translocase. Properly regulated SMARCAL1 promotes stalled fork repair and restart; however, unregulated SMARCAL1 contributes to fork collapse when ATR is inactivated in both mammalian and Xenopus systems. ATR phosphorylates SMARCAL1 on S652, thereby limiting its fork regression activities and preventing aberrant fork processing. Thus, phosphorylation of SMARCAL1 is one mechanism by which ATR prevents fork collapse, promotes the completion of DNA replication, and maintains genome integrity.

Keywords: ATR; DNA damage response; DNA replication; HARP; SMARCAL1; cell cycle checkpoint.


Figures

Figure 1.
Figure 1.
Acute ATR inhibition causes rapid cell lethality and an inability to complete DNA replication after a replication stress challenge. (A–D) U2OS cells were treated with DMSO, 5 μM ATRi, and/or 3 mM HU for the indicated times and released into fresh growth medium for 10–14 d. Colonies were visualized by methylene blue staining. Results shown are mean ± standard error of the mean (SEM) of at least two independent experiments. (E,F) RPE-hTERT cells were labeled with 20 μM BrdU for 20 min, treated with 3 mM HU for 5 h (E) or 16 h (F) in the presence or absence of 5 μM ATRi, and then released into fresh growth medium containing 1 μg/mL nocodazole for 24 h prior to harvesting. Cells were then fixed, acid-denatured, stained with BrdU antibodies and propidium iodide, and analyzed by flow cytometry. Plots were made using Cyflogic software.
Figure 2.
Figure 2.
ATR regulates DNA replication initiation and elongation. (A,B) RPE-hTERT cells were labeled with IdU for 20 min and then with CldU for 20 min in the presence of DMSO (red bars) or 5 μM ATRi (blue bars) during both labeling periods before harvesting for fiber labeling. (A) Representative replication tracks and quantification of the length of CldU (red) tracks in dual-labeled tracks are shown. (B) Origin initiation was scored as the percentage of red-only tracks. (C–F) RPE-hTERT cells were labeled with IdU for 20 min, treated with 2 mM HU for 2 h in the presence of DMSO (red bars) or 5 μM ATRi (blue bars), and then labeled with CldU for 20 min before harvesting for fiber staining. Representative images and quantification of CldU (C) and IdU (F) track lengths in dual-labeled fibers are shown. Percentage of collapsed forks (green-only tracks) (D) and newly initiated origins (red-only tracks) (E) were quantitated. In all experiments, data was collected from several experimental samples with high-quality DNA fibers. Error bars are SEM.
Figure 3.
Figure 3.
Stalled replication forks collapse into DSBs when ATR is acutely inhibited. (A,B) U2OS cells were treated with 3 mM HU in the presence or absence of 5 μM ATRi for the indicated times before preparation for immunofluorescence using anti-γH2AX antibodies. Dot plot of mean γH2AX intensity per nucleus is shown in B. (C) U2OS were cells treated with 3 mM HU in the presence or absence of 5 μM ATRi for the indicated times. Following treatment, cell lysates were separated by SDS-PAGE and then immunoblotted to detect the indicated proteins and phosphorylation levels. (D) U2OS cells were treated for 1 h with 1 μM CPT or for 4 h with 3 mM HU in the presence or absence of 5 μM ATRi. Neutral COMET assay was performed, and at least 100 individual cells were scored for tail moment using CometScore software. Representative images and a box and whisker plot are shown. Samples were compared with one-way ANOVA (P < 0.0001). Bonferroni's multiple comparison test was used as a follow-up to compare untreated versus CPT (P < 0.0001) and HU+DMSO versus HU+ATRi (P < 0.0001).
Figure 4.
Figure 4.
ATR inhibition causes both nascent and parental ssDNA accumulation at stalled replication forks. (A) 293T cells were labeled with EdU for 10 min prior to addition of 3 mM HU and 5 μM ATRi as indicated. Samples were processed for iPOND, and captured proteins were separated by SDS-PAGE and then immunoblotted. (B) Model for nascent-strand ssDNA assay. Black and red lines indicate template and nascent DNA strands, respectively. Without DNA denaturation, BrdU antibodies will not recognize intact replication forks but will recognize the labeled, nascent DNA when single-stranded. (C,D) The newly synthesized DNA in replicating U2OS cells was labeled for 10 min with 10 μM BrdU before addition of 3 mM HU and 5 μM ATRi as indicated. “No BrdU” sample is 4-h HU+ATRi treatment without BrdU prelabeling. DMSO samples were labeled with BrdU and treated with 3 mM HU for 4 h. After the indicated treatment times, cells were fixed and stained with antibodies against BrdU without DNA denaturation to selectively detect nascent-strand ssDNA. Representative images are shown in C, and a dot plot of mean BrdU intensity per nucleus is shown in D. (E) Parental DNA in replicating U2OS cells was labeled by the addition of 10 μM BrdU for 20 h followed by a chase into normal growth medium for 2 h before addition of 3 mM HU and 5 μM ATRi for the indicated times. DMSO samples were labeled with BrdU and treated with 3 mM HU for 4 h. Cells were fixed and stained with antibodies against BrdU without DNA denaturation to selectively detect parental-strand ssDNA. Dot plot of mean BrdU intensity per nucleus is shown.
Figure 5.
Figure 5.
SLX4 is required to generate DSBs and nascent-strand ssDNA at stalled replication forks when ATR is inhibited. (A,B) U2OS cells were transfected with MUS81, SLX4, or control siRNA prior to treatment for 1 h with 1 μM CPT or for 4 h with 3 mM HU in the presence or absence of 5 μM ATRi. A neutral COMET assay was performed. Samples were compared with one-way ANOVA (P < 0.0001). (A) Bonferroni's multiple comparison test was used as a follow-up to compare siCTRL HU+DMSO versus siCTRL HU+ATRi (P < 0.0001), siCTRL HU+DMSO versus siMUS81 HU+ATRi (P < 0.0001), and siCTRL HU+ATRi versus siMUS81 HU+ATRi (P > 0.05). (B) Bonferroni's multiple comparison test was used as a follow-up to compare siCTRL HU+DMSO versus siCTRL HU+ATRi (P < 0.0001), siCTRL HU+DMSO versus siSLX4 HU+ATRi (P > 0.05), and siCTRL HU+ATRi versus siSLX4 HU+ATRi (P < 0.0001). (C,D) U2OS cells were transfected with nontargeting or SLX4 siRNA and then labeled with 10 μM BrdU for 10 min before addition of 3 mM HU and 5 μM ATRi for 4 h. Samples were then processed to quantitate nascent-strand ssDNA. (C) Representative images of nascent-strand ssDNA assay in transfected cells. (D) Representative dot plot of the mean BrdU intensity per nucleus. (E) U2OS cells transfected with nontargeting or SLX4 siRNA were labeled for 40 min with 10 μM BrdU before harvesting for ethanol fixation, acid denaturation, and staining with BrdU antibodies and propidium iodide to measure the percentage of cells in S phase by flow cytometry. Values represent mean ± SEM of three replicates. (F) U2OS cells transfected with nontargeting or SLX4 siRNA were harvested and lysed. Lysates were separated by SDS-PAGE and immunoblotted with antibodies to detect SLX4 or GAPDH. (G,H) U2OS cells were transfected with nontargeting or CtIP siRNA. Transfected cells were labeled with 10 μM BrdU for 10 min before addition of 3 mM HU and 5 μM ATRi for 4 h. Samples were then processed to detect nascent-strand ssDNA. (G) Quantitation of the percentage of nuclei containing nascent-strand ssDNA; mean ± SEM of three experiments; (*) P < 0.05. (H) Dot plot of mean BrdU intensity per nucleus for a representative experiment is shown.
Figure 6.
Figure 6.
SMARCAL1 is required for the generation of nascent-strand ssDNA when ATR is inactivated. (A,B) U2OS cells were transfected with control or SMARCAL1 siRNA and then labeled with 10 μM BrdU for 10 min before addition of 3 mM HU and 5 μM ATRi for 4 h. Samples were then processed to quantitate nascent-strand ssDNA. (A) Bars represent mean ± SEM of the percentage of BrdU-positive cells across at least five experiments. (B) Representative dot plots of mean BrdU intensity per nucleus. (C) U2OS cells transfected with control or SMARCAL1 siRNA were harvested and lysed. Lysates were separated by SDS-PAGE and immunoblotted with antibodies to detect SMARCAL1 or GAPDH. (D–G) Sperm chromatin (4000 nuclei per microliter) was replicated in low-speed Xenopus extract containing DMSO or ATRi. After 10 min, extracts were labeled with 50 μM BrdU for 20 min prior to addition of DMSO, 50 μM CPT, or 100 μM aphidicolin (APH) as indicated. Sixty minutes after addition of chromatin, nuclei were fixed and spun down onto coverslips through a glycerol cushion. Where indicated, extracts were either mock- or xSMARCAL1-depleted. (D–F) Nuclei from extracts were processed to quantitate nascent-strand ssDNA. (D) Representative images of BrdU staining from each sample. (E) Representative dot plots of BrdU intensity per nucleus, measured using ImageJ. (F) Quantitation (mean ± SEM) of the percentage of BrdU-positive nuclei across three independent experiments. (G) Extracts were harvested, separated by SDS-PAGE, and immunoblotted with antibodies to detect xSMARCAL1, CHK1 pS345, or xCHK1.
Figure 7.
Figure 7.
ATR phosphorylates SMARCAL1 on S652 after SMARCAL1 binds to DNA at stalled forks. (A,B) HEK293T cells were transfected with small amounts of GFP-SMARCAL1 wild-type (WT) and mutant expression vectors to minimize overexpression. ΔH1 and ΔH2 are deletions of the HARP1 and HARP2 domains, respectively, while H1-WF and H2-WF are point mutants in each HARP domain (Betous et al. 2012). Cells were treated with 2 mM HU for 16 h where indicated prior to lysis, separation by SDS-PAGE, and immunoblotting with SMARCAL1 antibody. (C) SMARCAL1 was purified from untreated (unt.) or HU-treated (2 mM, 16 h) HEK293T cells and was used to measure ATPase activity in the presence of 5 nM forked DNA substrate. Error bars are standard deviation from three experiments (P = 0.0007, two-tailed unpaired t-test). The inset is an immunoblot showing equal amounts of protein used in each condition. The purified protein was treated with λ phosphatase before immunoblotting to eliminate the gel mobility shift and allow more accurate quantitation of protein concentration. (D) ClustalW was used to align SMARCAL1 from the indicated organisms. The position of the phosphorylated SQ residues S173, S652, and S919 relative to protein domains is depicted. (E,F) HEK293T cells were transfected with Flag-SMARCAL1 and treated with HU for the indicated times. Kinase inhibitors were added as indicated. Flag-SMARCAL1 was immunoprecipitated from cell lysates, separated by SDS-PAGE, and immunoblotted with either total SMARCAL1 antibody or pS652-specific antibody. (*) Nonspecific bands. Images were captured and quantitated relative to total SMARCAL1 using an Odyssey imaging system. (G) Purified ATR–ATRIP (ATR-interacting protein) complex phosphorylates a GST-S652 peptide in vitro. ATRi was added where indicated to ensure specificity of the kinase in the reaction. Shown are images of a Coomassie-stained gel to visualize the amount of ATR and GST protein in the reactions or an autoradiogram (32P) of the gel to visualize phosphorylation.
Figure 8.
Figure 8.
SMARCAL1 phosphorylation on S652 inhibits its ATP-dependent fork remodeling activity. (A–D) The indicated Flag-SMARCAL1 proteins were purified from HEK293T cells (A–C) or baculovirus-infected insect cells (D), and their ATPase activity was measured in the presence of increasing concentrations of splayed arm DNA substrate. The insets in A–C are representative immunoblots, and the inset in D is a Coomassie-stained gel showing equal amounts of wild-type and mutant SMARCAL1 proteins used. Error bars in all panels represent SEM (n = 3) and in many cases were smaller than the symbol. (*) P < 0.0002; (**) P < 0.002; (***) P < 0.05. (E,F) The fork regression activity of purified SMARCAL1 proteins was assayed on a model replication fork substrate schematized on the far left. (See Supplemental Table S1 for details.) A representative DNA gel (E) and quantitation of three independent experiments (F) (mean and SEM) are shown. The inset is a representative immunoblot showing equal amounts of wild-type and mutant SMARCAL1 proteins.
Figure 9.
Figure 9.
Phosphorylation of SMARCAL1 at S652 decreases its activity at DNA replication forks in cells. (A–C) GFP-SMARCAL1 wild-type and mutant proteins were overexpressed in U2OS cells. Cells were stained with DAPI to mark the nucleus and antibodies to γH2AX. Images were acquired using an Opera automated confocal microscope, and the levels of GFP-SMARCAL1 and γH2AX levels were quantitated in each nucleus using Columbus software. (A) Representative images. (B) Data represent the percentage of cells expressing between 500 and 2500 arbitrary units of GFP-SMARCAL1 that contain a mean γH2AX intensity of >1000 arbitrary units. Error bars represent SEM from three independent experiments. (*) P = 0.0007; (**) P = 0.023. (C) The expression level of GFP-SMARCAL1 (as measured by GFP intensity) in each cell that had a γH2AX intensity of >1000 arbitrary units is plotted in box and whisker format; significantly higher GFP-SMARCAL1 S652D protein levels were needed to induce γH2AX than either wild-type or S652A protein (P < 0.0001). (D) GFP-SMARCAL1 proteins with the indicated mutations were expressed in U2OS cells. BrdU was added to the culture medium 16 h prior to fixation and staining in nondenaturing conditions to measure the total level of ssDNA. The mean intensity (arbitrary units) of BrdU staining per GFP-SMARCAL1-expressing cell is graphed. The line indicates the mean value in each population (Mann-Whitney test, S652A vs. S652D; P = 0.013). (E) GFP-SMARCAL1 proteins were expressed in U2OS. These cells were then transfected with control, MUS81, or SLX4 siRNA. BrdU was added to the culture medium 16 h prior to fixation and staining in nondenaturing conditions to measure the total level of ssDNA. The mean intensity (arbitrary units) of BrdU staining per cell is graphed. The line indicates the mean value in each population (Mann-Whitney test, siCTRL vs. siSLX4; P = 0.0012; siSLX4 vs. siMUS81; P < 0.0001). (F) Model for nascent-strand ssDNA generation at stalled forks. Black and red lines represent template and nascent strands, respectively. HU causes uncoupling of the replicative helicase and polymerases, resulting in template-strand ssDNA at the replication fork. ATR prevents aberrant fork remodeling by the SMARCAL1 enzyme. In the absence of ATR-dependent SMARCAL1 S652 phosphorylation, a Holliday junction-like structure may persist at the fork and is cleaved by SLX4-dependent nucleases, generating a DSB. CtIP-dependent nucleases then resect the break, yielding nascent-strand ssDNA. CtIP may also process a reversed fork structure prior to SLX4 cleavage, which could contribute to the nascent-strand ssDNA formation.

Comment in

  • Fork reversal, too much of a good thing.
    Couch FB, Cortez D. Couch FB, et al. Cell Cycle. 2014;13(7):1049-50. doi: 10.4161/cc.28212. Epub 2014 Feb 18. Cell Cycle. 2014. PMID: 24553113 Free PMC article. No abstract available.

References

    1. Bansbach CE, Betous R, Lovejoy CA, Glick GG, Cortez D 2009. The annealing helicase SMARCAL1 maintains genome integrity at stalled replication forks. Genes Dev 23: 2405–2414 - PMC - PubMed
    1. Baradaran-Heravi A, Raams A, Lubieniecka J, Cho KS, DeHaai KA, Basiratnia M, Mari PO, Xue Y, Rauth M, Olney AH, et al. 2012. SMARCAL1 deficiency predisposes to non-Hodgkin lymphoma and hypersensitivity to genotoxic agents in vivo. Am J Med Genet A 158A: 2204–2213 - PMC - PubMed
    1. Betous R, Mason AC, Rambo RP, Bansbach CE, Badu-Nkansah A, Sirbu BM, Eichman BF, Cortez D 2012. SMARCAL1 catalyzes fork regression and Holliday junction migration to maintain genome stability during DNA replication. Genes Dev 26: 151–162 - PMC - PubMed
    1. Betous R, Couch FB, Mason A, Eichman BF, Manosas M, Cortez D 2013. Substrate-selective repair and restart of replication forks by DNA translocases. Cell Rep doi: 10.1016/j.celrep.2013.05.002 - PMC - PubMed
    1. Boerkoel CF, Takashima H, John J, Yan J, Stankiewicz P, Rosenbarker L, Andre JL, Bogdanovic R, Burguet A, Cockfield S, et al. 2002. Mutant chromatin remodeling protein SMARCAL1 causes Schimke immuno-osseous dysplasia. Nat Genet 30: 215–220 - PubMed

Publication types