

Quantitative assessment of the importance of phenotypic plasticity in adaptation to climate change in wild bird populations
- PMID: 23874152
- PMCID: PMC3706305
- DOI: 10.1371/journal.pbio.1001605
Quantitative assessment of the importance of phenotypic plasticity in adaptation to climate change in wild bird populations
Abstract
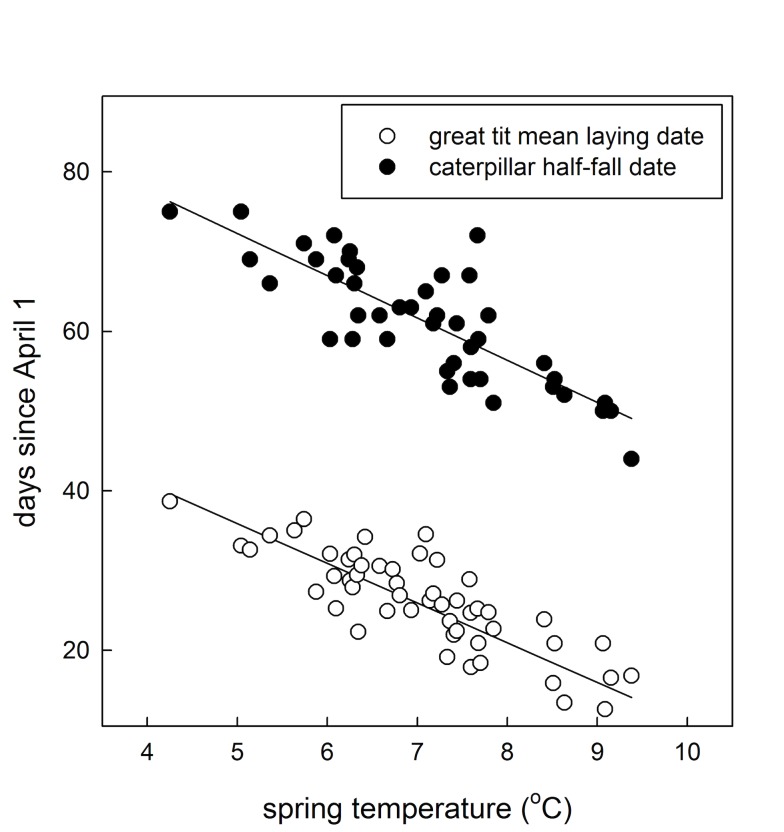
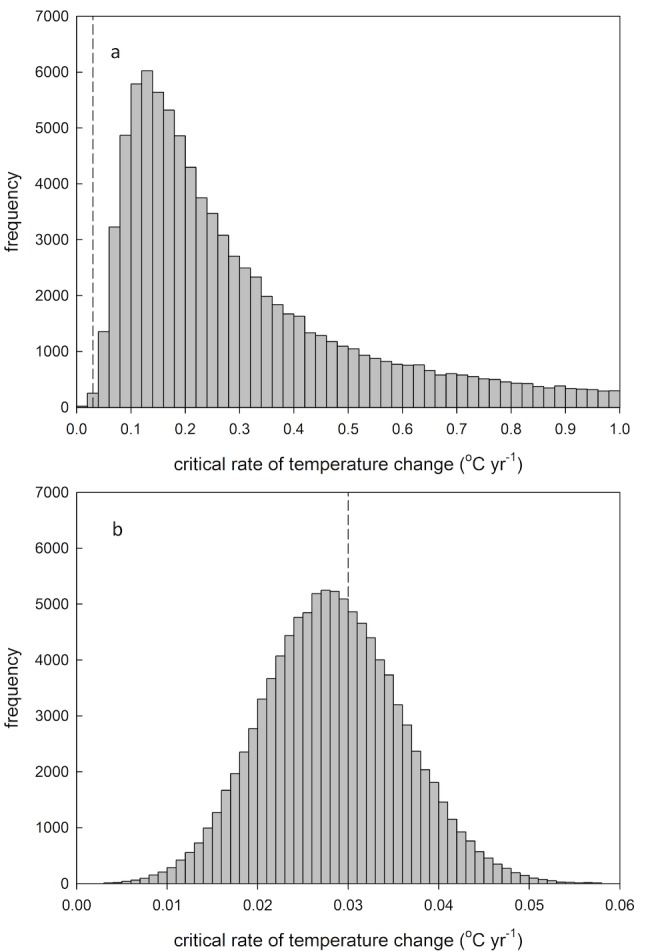
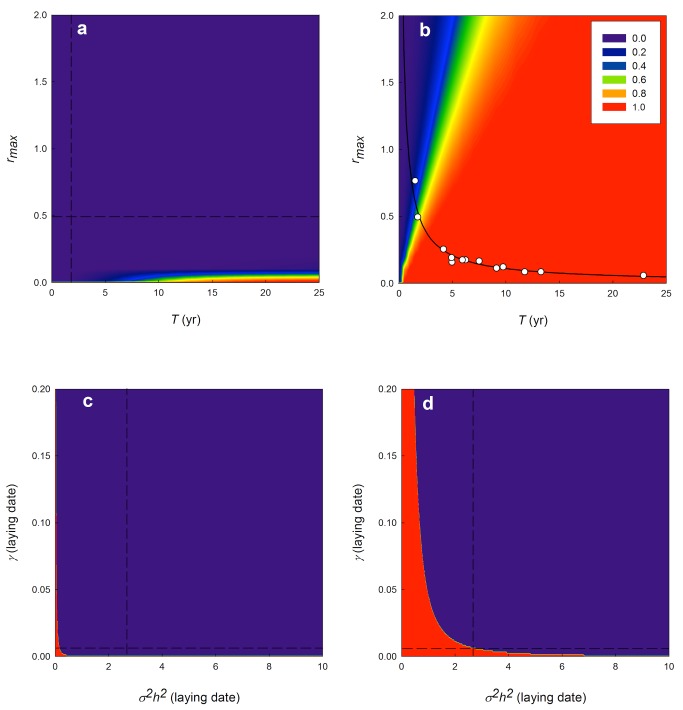
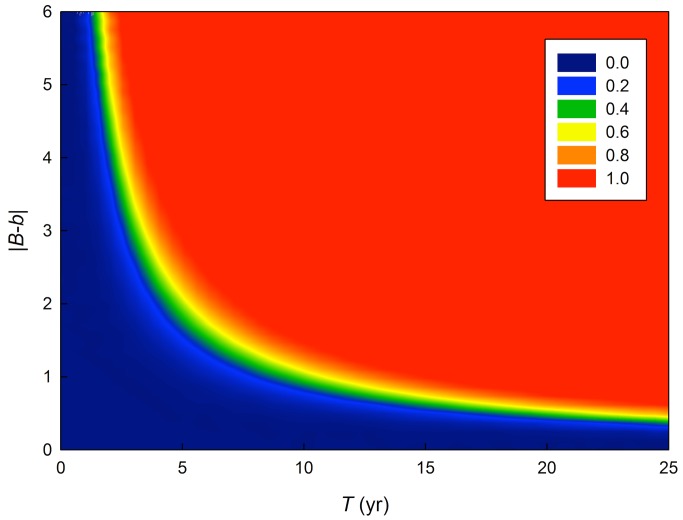
Predictions about the fate of species or populations under climate change scenarios typically neglect adaptive evolution and phenotypic plasticity, the two major mechanisms by which organisms can adapt to changing local conditions. As a consequence, we have little understanding of the scope for organisms to track changing environments by in situ adaptation. Here, we use a detailed individual-specific long-term population study of great tits (Parus major) breeding in Wytham Woods, Oxford, UK to parameterise a mechanistic model and thus directly estimate the rate of environmental change to which in situ adaptation is possible. Using the effect of changes in early spring temperature on temporal synchrony between birds and a critical food resource, we focus in particular on the contribution of phenotypic plasticity to population persistence. Despite using conservative estimates for evolutionary and reproductive potential, our results suggest little risk of population extinction under projected local temperature change; however, this conclusion relies heavily on the extent to which phenotypic plasticity tracks the changing environment. Extrapolating the model to a broad range of life histories in birds suggests that the importance of phenotypic plasticity for adjustment to projected rates of temperature change increases with slower life histories, owing to lower evolutionary potential. Understanding the determinants and constraints on phenotypic plasticity in natural populations is thus crucial for characterising the risks that rapidly changing environments pose for the persistence of such populations.
Conflict of interest statement
The authors have declared that no competing interests exist.
Figures
Comment in
-
Adapting to change.PLoS Biol. 2013 Jul;11(7):e1001606. doi: 10.1371/journal.pbio.1001606. Epub 2013 Jul 9. PLoS Biol. 2013. PMID: 23874153 Free PMC article. No abstract available.
References
-
- Walther GR, Post E, Convey P, Menzel A, Parmesan C, et al. (2002) Ecological responses to recent climate change. Nature 416: 389–395. - PubMed
-
- Parmesan C (2006) Ecological and evolutionary responses to recent climate change. Annu Rev Ecol Evol System 37: 637–669.
-
- Thackeray SJ, Sparks TH, Frederiksen M, Burthe S, Bacon PJ, et al. (2010) Trophic level asynchrony in rates of phenological change for marine, freshwater and terrestrial environments. Glob Change Biol 16: 3304–3313.
-
- Dawson TP, Jackson ST, House JI, Prentice IC, Mace GM (2011) Beyond predictions: biodiversity conservation in a changing climate. Science 332: 53–58. - PubMed
-
- Thomas CD, Cameron A, Green RE, Bakkenes M, Beaumont LJ, et al. (2004) Extinction risk from climate change. Nature 427: 145–148. - PubMed
Publication types
MeSH terms
LinkOut - more resources
Full Text Sources
Other Literature Sources
Medical
Research Materials
