

Frequency dependence of signal power and spatial reach of the local field potential
- PMID: 23874180
- PMCID: PMC3715549
- DOI: 10.1371/journal.pcbi.1003137
Frequency dependence of signal power and spatial reach of the local field potential
Abstract
Despite its century-old use, the interpretation of local field potentials (LFPs), the low-frequency part of electrical signals recorded in the brain, is still debated. In cortex the LFP appears to mainly stem from transmembrane neuronal currents following synaptic input, and obvious questions regarding the 'locality' of the LFP are: What is the size of the signal-generating region, i.e., the spatial reach, around a recording contact? How far does the LFP signal extend outside a synaptically activated neuronal population? And how do the answers depend on the temporal frequency of the LFP signal? Experimental inquiries have given conflicting results, and we here pursue a modeling approach based on a well-established biophysical forward-modeling scheme incorporating detailed reconstructed neuronal morphologies in precise calculations of population LFPs including thousands of neurons. The two key factors determining the frequency dependence of LFP are the spatial decay of the single-neuron LFP contribution and the conversion of synaptic input correlations into correlations between single-neuron LFP contributions. Both factors are seen to give low-pass filtering of the LFP signal power. For uncorrelated input only the first factor is relevant, and here a modest reduction (<50%) in the spatial reach is observed for higher frequencies (>100 Hz) compared to the near-DC ([Formula: see text]) value of about [Formula: see text]. Much larger frequency-dependent effects are seen when populations of pyramidal neurons receive correlated and spatially asymmetric inputs: the low-frequency ([Formula: see text]) LFP power can here be an order of magnitude or more larger than at 60 Hz. Moreover, the low-frequency LFP components have larger spatial reach and extend further outside the active population than high-frequency components. Further, the spatial LFP profiles for such populations typically span the full vertical extent of the dendrites of neurons in the population. Our numerical findings are backed up by an intuitive simplified model for the generation of population LFP.
Conflict of interest statement
The authors have declared that no competing interests exist.
Figures
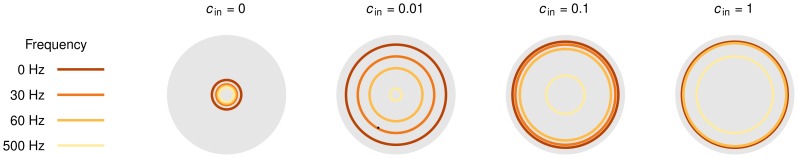
 . Color lines denote parts of the whole population (gray, radius = 1 mm) which contribute 95% of LFP amplitude at given frequency in the middle of the population, at the soma level. Results for layer-5 pyramidal cell with basal input.
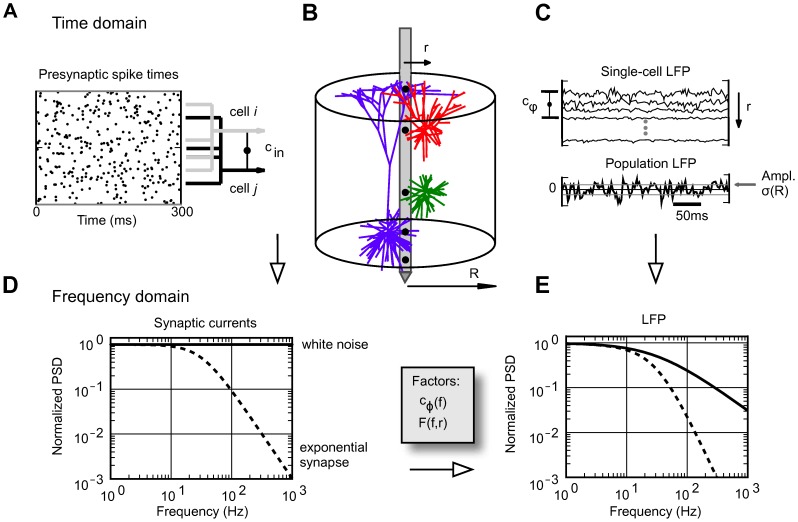
 of inputs). B. Model cells (red: L3 pyramidal cell, green: L4 stellate cell, blue: L5 pyramidal cell) are placed with constant planar density
  on a disc of radius
  , in this example with the recording electrode at the population center. Electrode positions shown as black dots. C. The population LFP is a sum of contributions from cells at different distances
  . The dependence of the amplitude
  of the population LFP on the population radius
  serves to define the spatial reach (see text). The correlations between inputs give raise to correlations
  between single-cell LFP contributions. D. The synapses used in simulations yield a flat power spectrum of input current, but because of the frequency-dependence of single-cell shape functions
 and population-averaged coherence
 (see text), the resulting power spectrum of the population LFP is not flat (E). This LFP filtering effect will be present for any synapse type, such as the exponential synapse which in addition yields non-flat power spectrum of the input current (dashed curves in D, E).
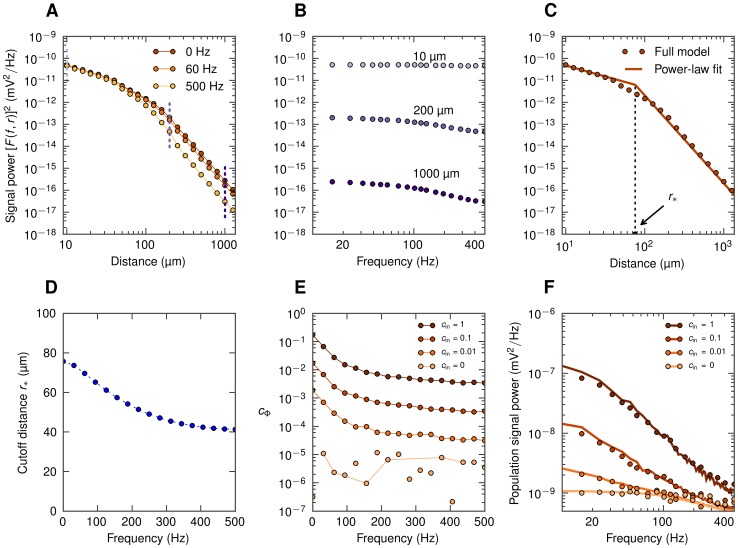
 for three different frequencies
  and
and  . B. Single-cell LFP spectra
  for three different lateral distances from the soma (dotted vertical lines in A). C. Log-log plot of the squared near-DC (
 ) shape function
  (dots) approximated by a piecewise-linear function with cutoff distance
  (line; see Eq. 7). D. Frequency dependence of the cutoff distance
  . E. Population-averaged LFP coherence
  for different input correlation levels
  . Dots not connected with lines indicate that
  is plotted in place of spurious negative values (see Methods). F. Power spectra
  of the compound LFP (
 ); dots correspond to simulation; lines correspond to predictions from simplified model, Eq. 6, based on
  and
and  given in D and E, respectively.
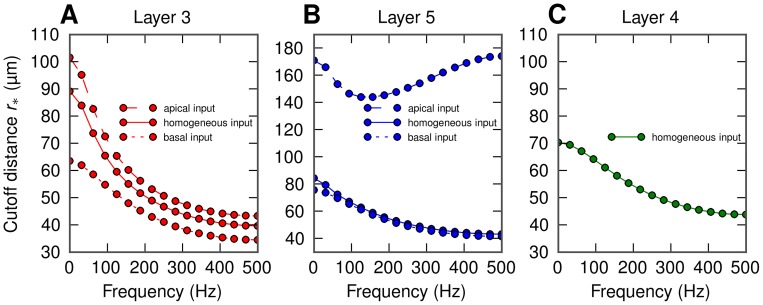
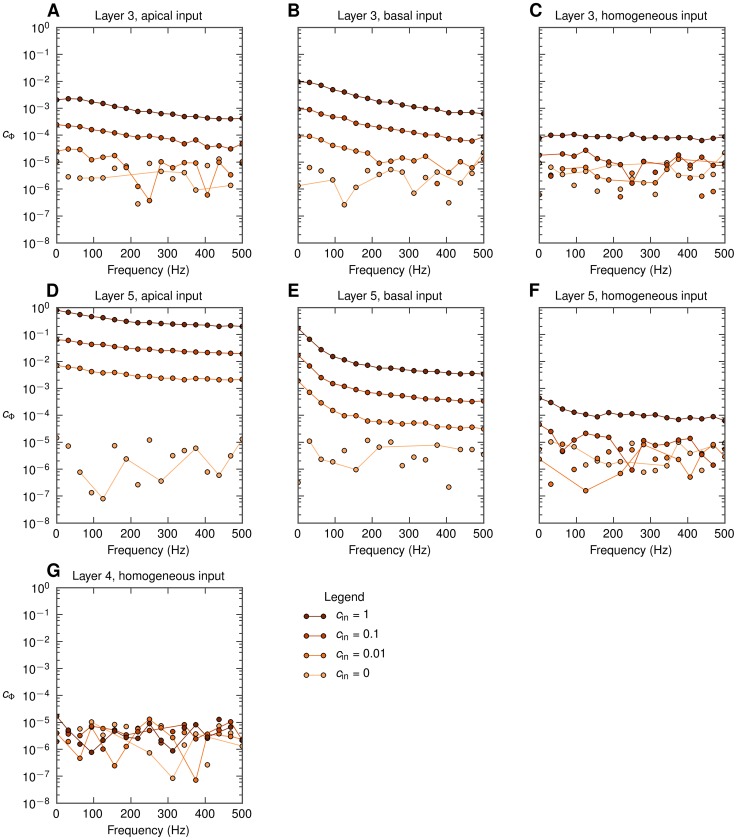
 is plotted, see Methods. A, B, C: population of layer-3 cells; D, E, F: population of layer-5 cells, G: population of layer-4 cells; A, D: apical synaptic input; B, E: basal synaptic input; C, F, G: homogeneous synaptic input.
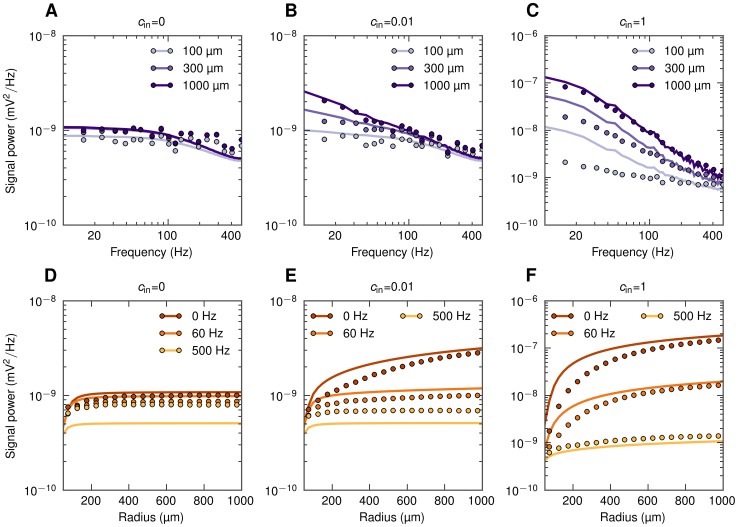
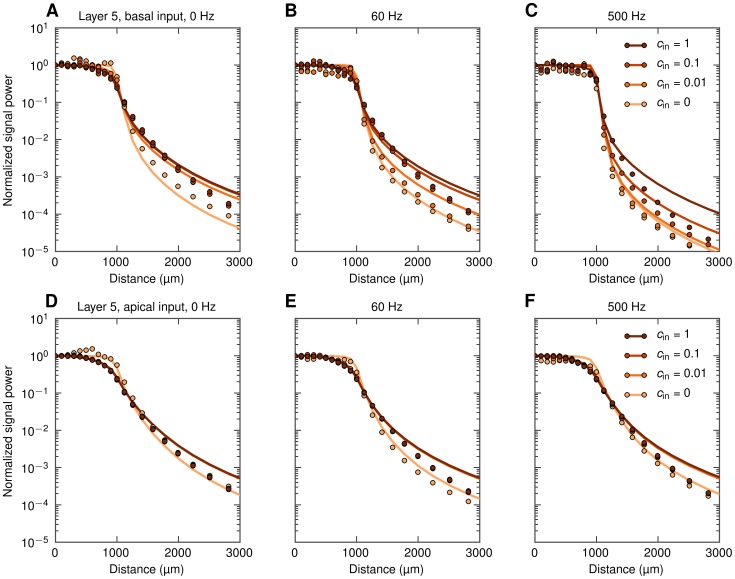
 are considered. A, B, C: PSD of population LFP for three population radii
  . D, E, F: dependence of power of three different frequency components on the population radius
  .
.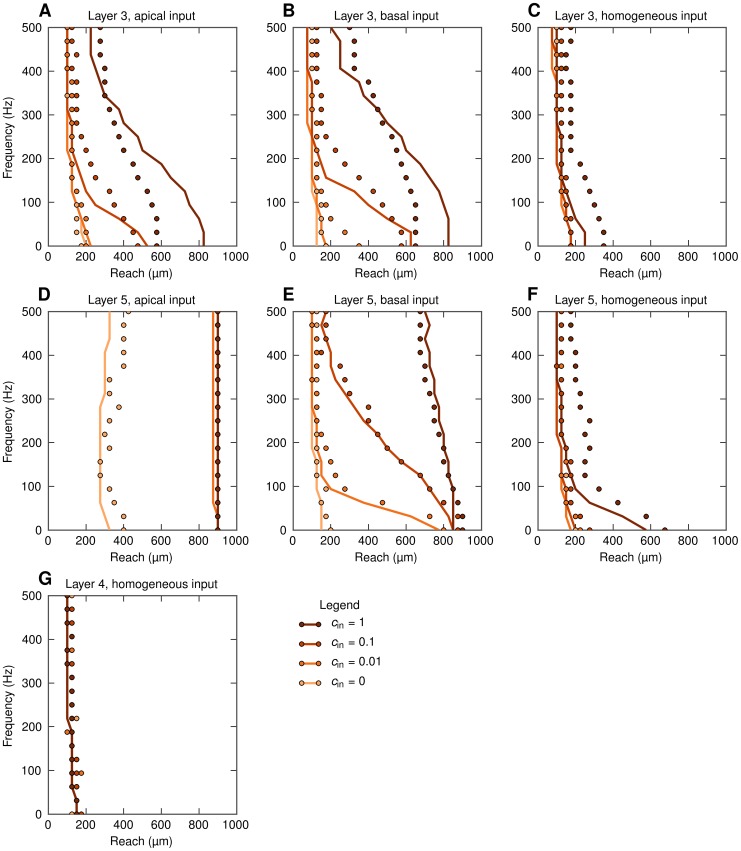
 . LFP is calculated at the soma level at the center of the population. Full simulation results plotted with dots; predictions from the simplified model (Equation 6) based on calculated values of
  and
and  given in Figures 4 and 5, respectively, are shown with lines. A, B, C: population of layer-3 cells; D, E, F: population of layer-5 cells, G: population of layer-4 cells; A, D: apical synaptic input; B, E: basal synaptic input; C, F, G: homogeneous synaptic input.
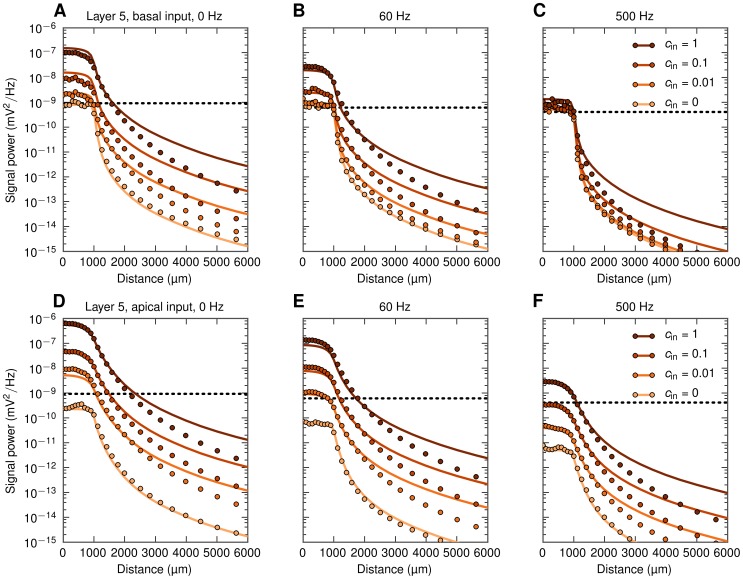
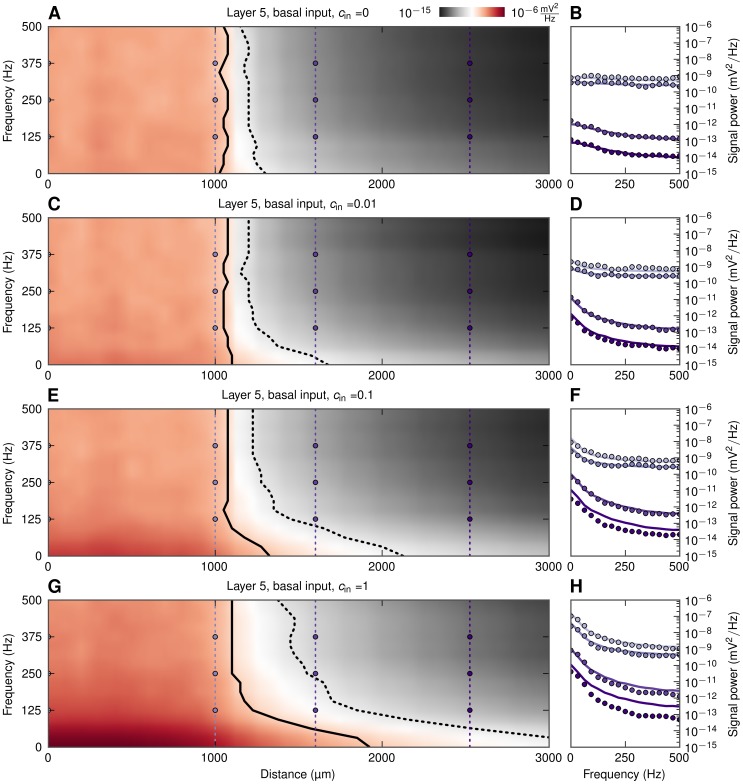
 as functions of frequency and distance from center of populations. Black solid and dotted lines denote signal to noise ratio of 0.5 and 0.1, respectively. B, D, F, H: power spectra of extracellular signal at different distances, lines: prediction from simplified model in Equation 6, dots: full simulation. Thin vertical dotted lines with dots in A, C, E, G denote the distances at which the power spectra are shown, that is, at the center (
 ), population edge (
 ), and two distances outside (
 and
and  ).
).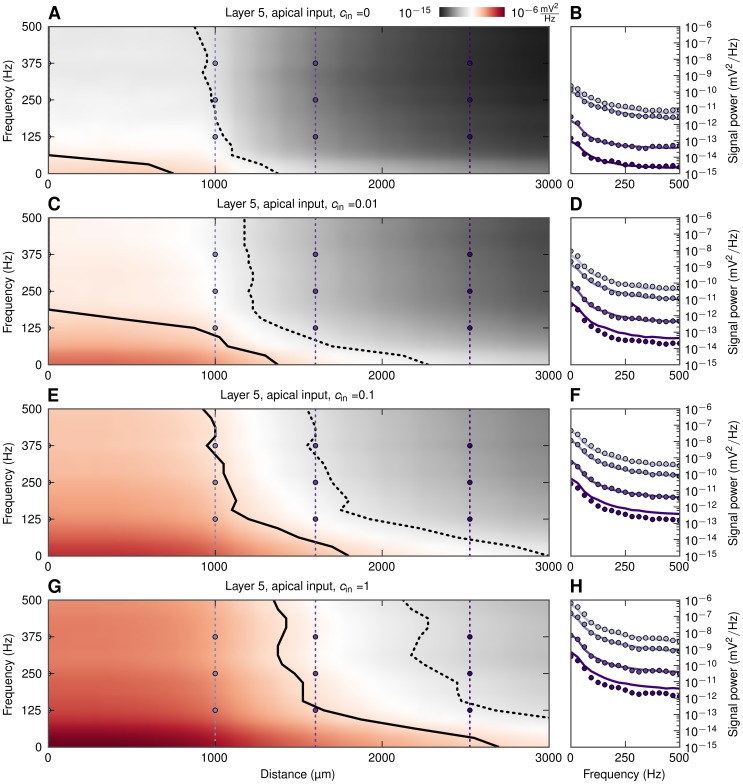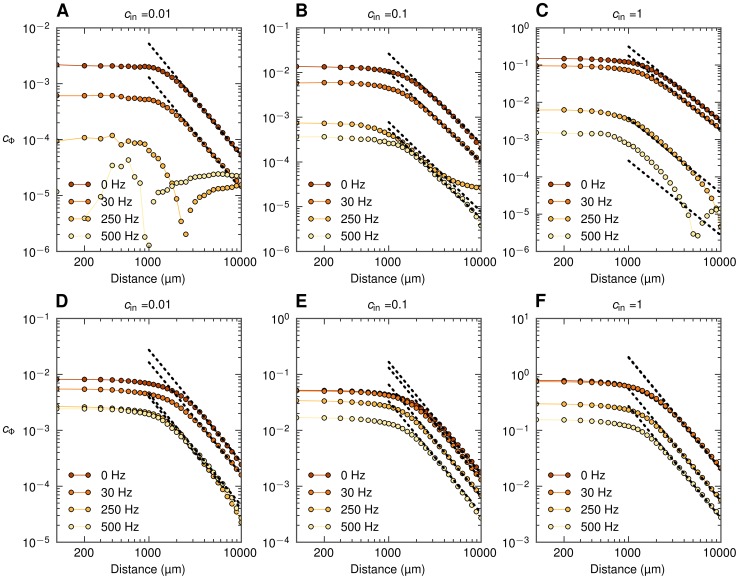
 is plotted in place of spurious negative values (see Methods). Dashed lines mark
  decay.
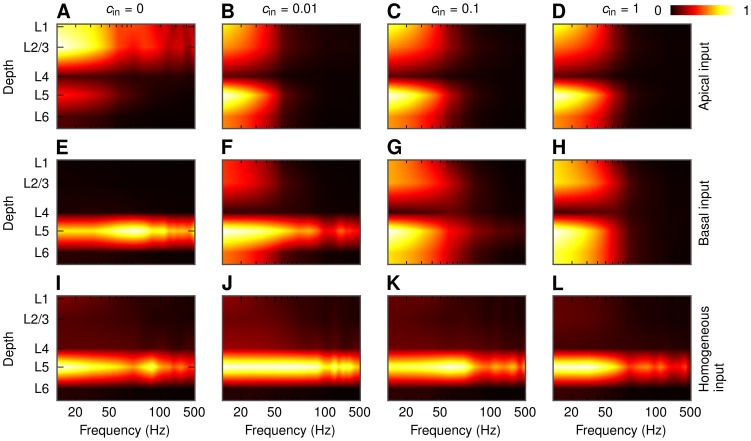
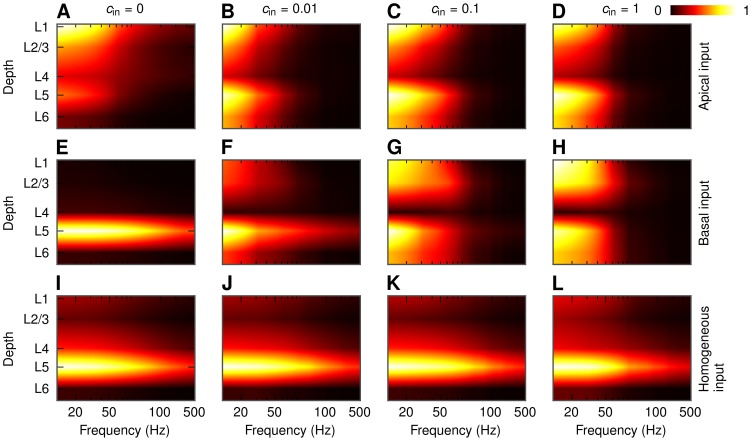
 . Values in each panel are normalized separately. A, B, C, D: apical synaptic input; E, F, G, H: basal synaptic input; I, J, K, L: homogeneous synaptic input. A, E, I:
  ; B, F, J:
  ; C, G, K:
  ; D, H, L:
  .
.
 . Values in each panel are normalized separately. A, B, C, D: apical synaptic input; E, F, G, H: basal synaptic input; I, J, K, L: homogeneous synaptic input. A, E, I:
  ; B, F, J:
  ; C, G, K:
  ; D, H, L:
  .
.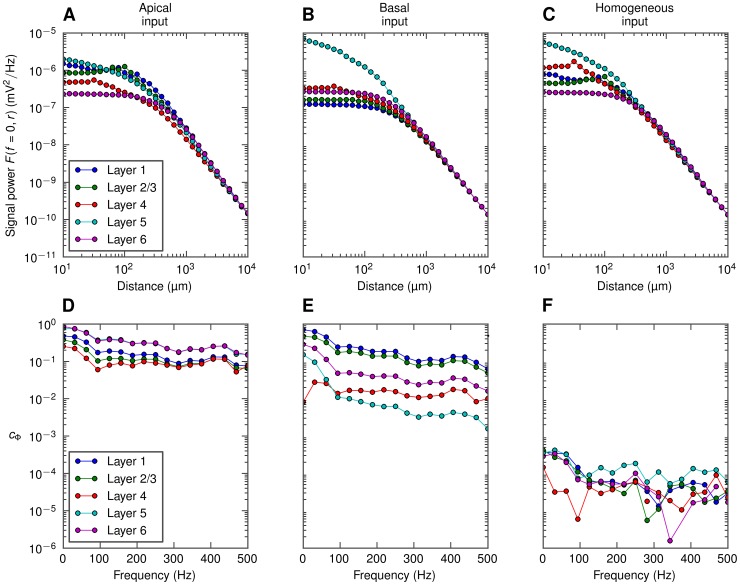
 for the lowest-frequency component (
 0 Hz) of the LFP generated by layer-5 cells with apical (A), basal (B) or homogeneous (C) synaptic input, at different recording depths. Bottom row: population-averaged LFP coherence
  , calculated at different depths in a maximally correlated (
 ) population of layer-5 cells with either apical (D), basal (E), or homogenous (F) distribution of synapses.
References
-
- Caton R (1875) The electric currents of the brain. British Medical Journal 2: 278.
-
- Pitts W (1952) Investigations on synaptic transmission. In: von Foerster H, editor, Cybernetics: Circular Causal and Feedback Mechanisms in Biological and Social Systems (Transactions of the Ninth Conference), New York: Josiah Macy, Jr. Foundation. pp.159–168.
-
- Nicholson C, Freeman JA (1975) Theory of current source-density analysis and determination of conductivity tensor for anuran cerebellum. Journal of Neurophysiology 38: 356–368. - PubMed
-
- Pettersen KH, Devor A, Ulbert I, Dale AM, Einevoll GT (2006) Current-source density estimation based on inversion of electrostatic forward solution: effects of finite extent of neuronal activity and conductivity discontinuities. Journal of Neuroscience Methods 154: 116–133. - PubMed
-
- Łęski S, Wójcik DK, Tereszczuk J, Swiejkowski DA, Kublik E, et al. (2007) Inverse current-source density method in 3D: reconstruction fidelity, boundary effects, and influence of distant sources. Neuroinformatics 5: 207–222. - PubMed
Publication types
MeSH terms
LinkOut - more resources
Full Text Sources
Other Literature Sources
