. 2013;9(7):e1003478.
doi: 10.1371/journal.ppat.1003478. Epub 2013 Jul 18.

Negative regulation of type I IFN expression by OASL1 permits chronic viral infection and CD8⁺ T-cell exhaustion

Affiliations

Negative regulation of type I IFN expression by OASL1 permits chronic viral infection and CD8⁺ T-cell exhaustion

Myeong Sup Lee et al. PLoS Pathog. 2013.

Abstract

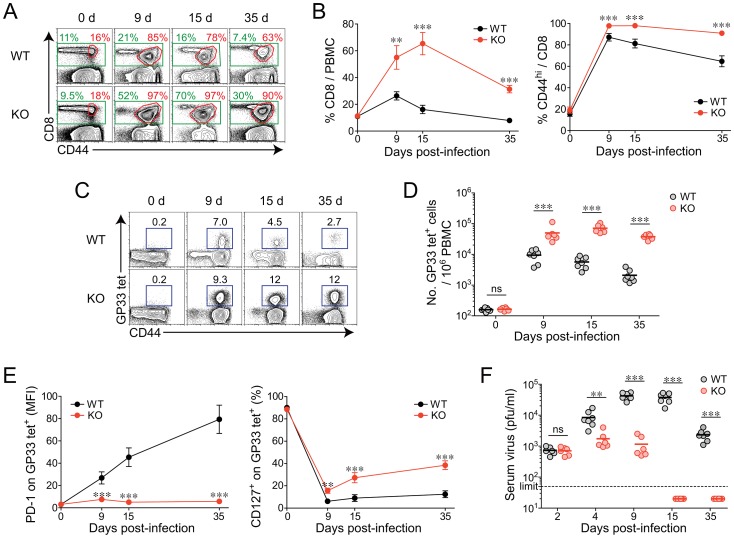
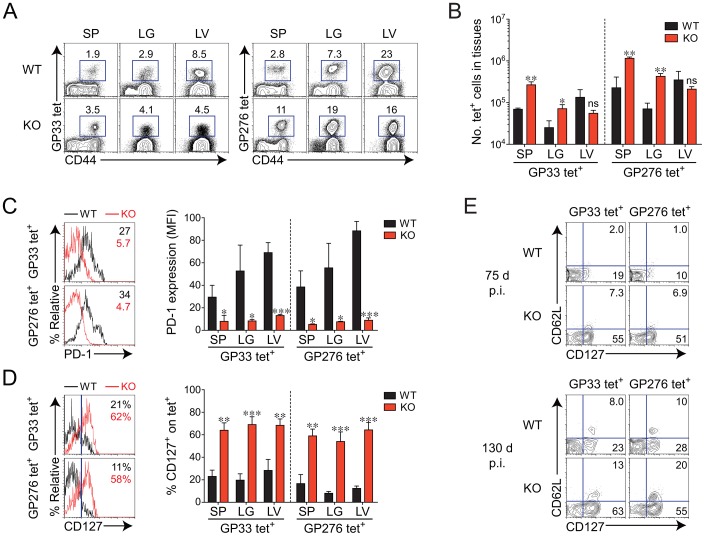
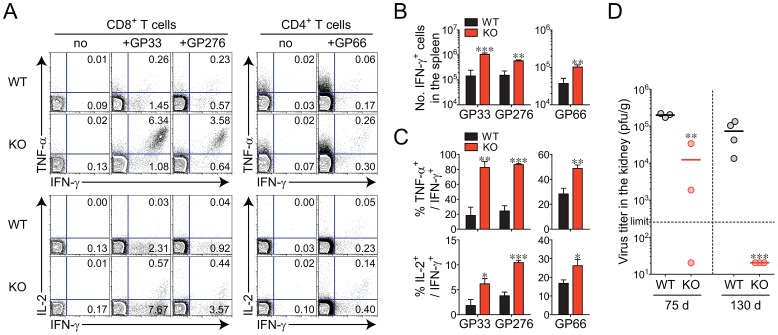
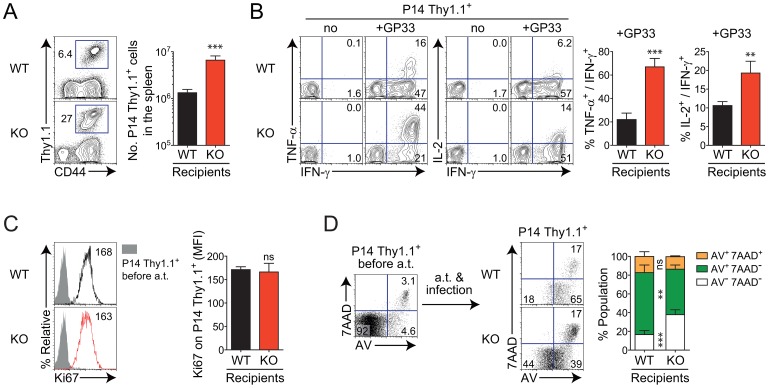
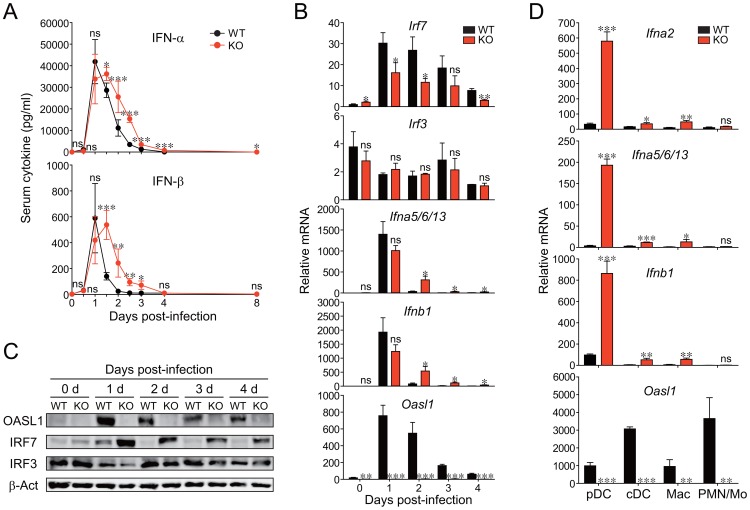
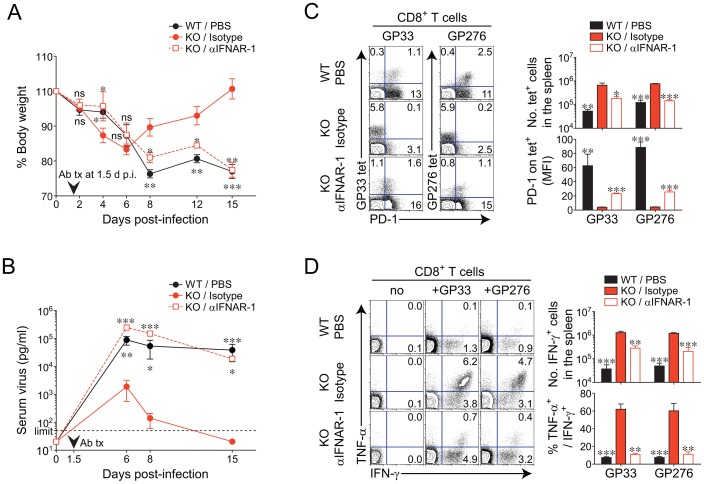
The type I interferons (IFN-Is) are critical not only in early viral control but also in prolonged T-cell immune responses. However, chronic viral infections such as those of human immunodeficiency virus (HIV) and hepatitis C virus (HCV) in humans and lymphocytic choriomeningitis virus (LCMV) in mice overcome this early IFN-I barrier and induce viral persistence and exhaustion of T-cell function. Although various T-cell-intrinsic and -extrinsic factors are known to contribute to induction of chronic conditions, the roles of IFN-I negative regulators in chronic viral infections have been largely unexplored. Herein, we explored whether 2'-5' oligoadenylate synthetase-like 1 (OASL1), a recently defined IFN-I negative regulator, plays a key role in the virus-specific T-cell response and viral defense against chronic LCMV. To this end, we infected Oasl1 knockout and wild-type mice with LCMV CL-13 (a chronic virus) and monitored T-cell responses, serum cytokine levels, and viral titers. LCMV CL-13-infected Oasl1 KO mice displayed a sustained level of serum IFN-I, which was primarily produced by splenic plasmacytoid dendritic cells, during the very early phase of infection (2-3 days post-infection). Oasl1 deficiency also led to the accelerated elimination of viremia and induction of a functional antiviral CD8 T-cell response, which critically depended on IFN-I receptor signaling. Together, these results demonstrate that OASL1-mediated negative regulation of IFN-I production at an early phase of infection permits viral persistence and suppresses T-cell function, suggesting that IFN-I negative regulators, including OASL1, could be exciting new targets for preventing chronic viral infection.


Conflict of interest statement

The authors have declared that no competing interests exist.

Figures

Figure 1
Figure 1. Rapid expansion and maintenance of virus-specific CD8+ T cells and accelerated viral control in Oasl1 KO mice during chronic LCMV infection.
WT and Oasl1 KO mice were infected with LCMV CL-13. (A–E) PBMCs were collected at indicated time points p.i. and analyzed by flow cytometry. (A) Representative data showing CD8+ T-cell percentage (green) among lymphocytes and CD44hi cell percentage (red) among CD8+ T cells. (B) Summary showing CD8+ T-cell percentage among lymphocytes and CD44hi cell percentage among CD8+ T cells. (C) Representative data showing the frequency of GP33–41 (GP33) tetramer-positive cells among CD8+ T cells. Numbers in plots indicate percentage of the tetramer-positive cells. (D) The numbers of GP33 tetramer-positive CD8+ T cells per 106 PBMCs during the course of LCMV CL-13 infection. (E) Summary showing the PD-1 expression level on GP33 tetramer-positive CD8+ T cells as represented by mean fluorescence intensity (MFI), and the percentage of CD127+ cells among GP33 tetramer-positive CD8+ T cells. (F) Serum viral titer in WT and Oasl1 KO mice at the indicated time p.i. Dashed black line represents the virus detection limit. All line graphs show mean ± standard deviation (SD). Data are representative of four independent experiments (n>6 per group in each experiment). ns, not significant; **, P<0.01; ***, P<0.001.
Figure 2
Figure 2. Phenotypic change of virus-specific CD8+ T cells in tissues of Oasl1 KO mice during late phase of chronic LCMV infection.
(AD) Lymphocytes were isolated from the spleen (SP), lung (LG), and liver (LV) of LCMV CL-13-infected WT and Oasl1 KO mice at 75 d p.i. and analyzed by flow cytometry. (A) Representative data showing the frequency of GP33 and GP276–286 (GP276) tetramer-positive cells among CD8+ T cells. (B) Absolute numbers of the tetramer-positive CD8+ T cells in the indicated tissues. (C, D) PD-1 and CD127 expression levels on virus-specific CD8+ T cells in the spleen of WT and KO mice. Numbers in the plots indicate PD-1 MFI value (C) on GP33 and GP276 tetramer-positive CD8+ T cells and CD127+ cell percentage (D) among the tetramer-positive cells. Blue vertical lines in the plots of (D) divide CD127+ and CD127 tetramer-positive CD8+ T cells. The PD-1 MFI values and CD127+ cell frequencies in the indicated tissues are also summarized in the graphs. (E) Co-expression pattern of CD127 and CD62L on virus-specific CD8+ T cells ex vivo. Splenocytes isolated from LCMV CL-13-infected WT and KO mice at 75 d p.i. (top) and 130 d p.i. (bottom) were analyzed by flow cytometry. GP33 and GP276 tetramer-positive CD8+ T cells were plotted: the numbers in the plots indicate percentages of CD127+CD62L+ (central memory) and CD127+CD62L (effector memory). All bar graphs show mean + SD. Data are representative of at least two independent experiments (n = 3–4 per group in each experiment). ns, not significant; *, P<0.05; **, P<0.01; ***, P<0.001.
Figure 3
Figure 3. Efficient induction of functional virus-specific T cells and complete viral control in Oasl1 KO mice during late phase of LCMV infection.
(AC) Lymphocytes were isolated from the spleens of LCMV CL-13-infected WT and Oasl1 KO mice at 75 d p.i. and restimulated in vitro with GP33 or GP276 peptides for CD8+ T cells and GP66–80 (GP66) peptide for CD4+ T cells. (A) Representative data showing the percentages of cytokine-producing cells among CD8+ or CD4+ T cells. (B) Absolute numbers of T cells producing IFN-γ per spleen. (C) Summary showing the frequency of TNF-α- or IL-2-producing cells among IFN-γ+ CD8+ or IFN-γ+ CD4+ T cells. Bar graphs show mean + SD. (D) Virus titers in the kidneys extracted from LCMV CL-13-infected mice at 75 d p.i. (left) and at 130 d p.i. (right). Dashed black line represents the virus detection limit. Undetectable samples were given 20 PFU per gram. The graph includes individual values with their arithmetic mean. All data are representative of at least two independent experiments (n = 3–4 per group in each experiment). *, P<0.05; **, P<0.01; ***, P<0.001.
Figure 4
Figure 4. Better responses of virus-specific CD8+ T cells and their prolonged survival in Oasl1 KO mice due to virus-specific T-cell-extrinsic factors.
GP33-specific TCR transgenic CD8+ T cells, P14 cells, were obtained from naïve P14 Thy1.1 congenic mice. 5×10³ of P14 Thy1.1+ CD8+ T cells were adoptively transferred into WT and Oasl1 KO mice. The next day, both recipient mice were infected with LCMV CL-13 and splenocytes were isolated from the mice at 5 d p.i. (A) Massive expansion of virus-specific donor CD8+ T cells in the KO mice. Numbers in the representative plot (left) indicate the frequency of donor P14 Thy1.1+ CD8+ T cells among splenocytes while the absolute numbers of donor P14 Thy1.1+ CD8+ T cells present per recipient spleen are summarized in the graph (right). (B) Cytokine production from donor P14 Thy1.1+ CD8+ T cells after in vitro restimulation with GP33 peptide. Representative plots (left) are shown for co-expression of IFN-γ and TNF-α or IFN-γ and IL-2 on donor P14 Thy1.1+ CD8+ T cells; summarized graph (right) for the frequency of TNF-α- or IL-2-producing cells among IFN-γ+ CD8+ T cells. (C) Proliferative capability measurement on donor P14 Thy1.1+ CD8+ T cells by direct ex vivo staining. Representative Ki67 expression levels (MFIs, left) and summarized levels (right) on donor P14 Thy1.1+ CD8+ T cells are shown. Shade histogram indicates Ki67 expression level on P14 Thy1.1+ CD8+ T cells before adoptive transfer (a.t.); black line and red line histograms indicate Ki67 expression levels on P14 Thy1.1+ CD8+ T cells at 5 d p.i. after a.t. into WT and KO mice, respectively. (D) Cell death susceptibility of donor P14 Thy1.1+ CD8+ T cells. Representative (left) and summary (right) data after direct ex vivo staining of splenocytes for Annexin V (AV) and 7AAD. Donor P14 Thy1.1+ CD8+ T cells were analyzed. Data are given as mean + SD. Data are representative of two independent experiments (n = 4 per group in each experiment). ns, not significant; **, P<0.01; ***, P<0.001.
Figure 5
Figure 5. Production of sustained IFN-I and higher IRF7 protein in Oasl1 KO mice early after LCMV CL-13 infection and the cellular sources of the IFN.
WT and Oasl1 KO mice were infected with LCMV CL-13 and their sera (A), spleens (B–C), and sorted splenic cells (D) were analyzed. (A) The levels of IFN-α and IFN-β in the sera were measured by ELISA. Line graphs are shown as mean ± SD. The data are representative of at least four independent experiments (n>5 per group in each experiment). (B) mRNAs prepared from the spleens were analyzed by quantitative RT-PCR at the indicated days: mRNA expression levels (n = 3 per group) normalized to Gapdh was recalculated by dividing each expression value with the least mRNA expression value among the samples and shown as a relative mRNA level. (C) The protein levels for OASL1, IRF7, IRF3, and β-actin (loading control) were measured by immunoblot. (D) mRNA expression levels of IFN-I and OASL1 for the sorted cell populations following the sorting strategy shown in Figure S9. The mRNA expression level (n = 3 per group) of Ifna2, Ifna5/6/13, Ifnb1, or Oasl1 normalized to Gapdh was shown as a relative mRNA level. All bar graphs show mean + SD. Data of (BD) are representative of two independent experiments. ns, not significant; *, P<0.05; **, P<0.01; ***, P<0.001.
Figure 6
Figure 6. Effect of early in vivo blockade of IFN-I receptor signaling on viral clearance and virus-specific CD8+ T-cell responses in Oasl1 KO mice.
Mice were infected with LCMV CL-13. At 1.5 d p.i., 0.5 mg IFNAR-1 mAb (αIFNAR-1) or its control isotype Ab (Isotype) was administrated i.v. once into Oasl1 KO mice. PBS was injected into WT mice as another control. (A) Changes in body weight at the indicated time points. (B) Serum virus titers of mice at indicated time points p.i. Vertical arrowhead indicates the time point of antibody injection and dashed black line represents the virus detection limit. (C) Frequencies of virus (GP33 and GP276)-specific CD8+ T cells and their PD-1 expression levels in the spleen at 35 d p.i. Numbers in the plots (left) indicate the percentages of the corresponding cell population among CD8+ T cells. Absolute numbers of GP33 tetramer-positive CD8+ T cells (top right) and PD-1 MFI values for GP33 tetramer-positive CD8+ T cells (bottom right) were also depicted. (D) Cytokine production on CD8+ T cells obtained from spleens at 35 d p.i. after in vitro restimulation with GP33 peptide. Percentages of cytokine-producing cells among CD8+ T cells (left) are shown. Absolute numbers of CD8+ T cells producing IFN-γ (top right) and the frequencies of TNF-α-producing cells among IFN-γ + CD8+ T cells (bottom right) are also depicted. All line graphs and bar graphs show mean ± SD and mean + SD, respectively. Data are representative of two independent experiments (n = 3 per group in each experiment). Statistical significance was determined by comparison between isotype-treated KO mice and each of the other two groups, PBS-treated WT mice or αIFNAR-1-treated KO mice. ns, not significant; *, P<0.05; **, P<0.01; ***, P<0.001.

References

    1. Lee MS, Kim YJ (2007) Signaling pathways downstream of pattern-recognition receptors and their cross talk. Annu Rev Biochem 76: 447–480. - PubMed
    1. Takeuchi O, Akira S (2009) Innate immunity to virus infection. Immunol Rev 227: 75–86. - PMC - PubMed
    1. Barbalat R, Ewald SE, Mouchess ML, Barton GM (2011) Nucleic acid recognition by the innate immune system. Annu Rev Immunol 29: 185–214. - PubMed
    1. Kawai T, Akira S (2006) Innate immune recognition of viral infection. Nat Immunol 7: 131–137. - PubMed
    1. Iwasaki A, Medzhitov R (2004) Toll-like receptor control of the adaptive immune responses. Nat Immunol 5: 987–995. - PubMed

Publication types

MeSH terms

LinkOut - more resources