Comparative Study
. 2013;9(7):e1003500.
doi: 10.1371/journal.ppat.1003500. Epub 2013 Jul 18.

The footprint of genome architecture in the largest genome expansion in RNA viruses

Affiliations
Comparative Study

The footprint of genome architecture in the largest genome expansion in RNA viruses

Chris Lauber et al. PLoS Pathog. 2013.

Abstract

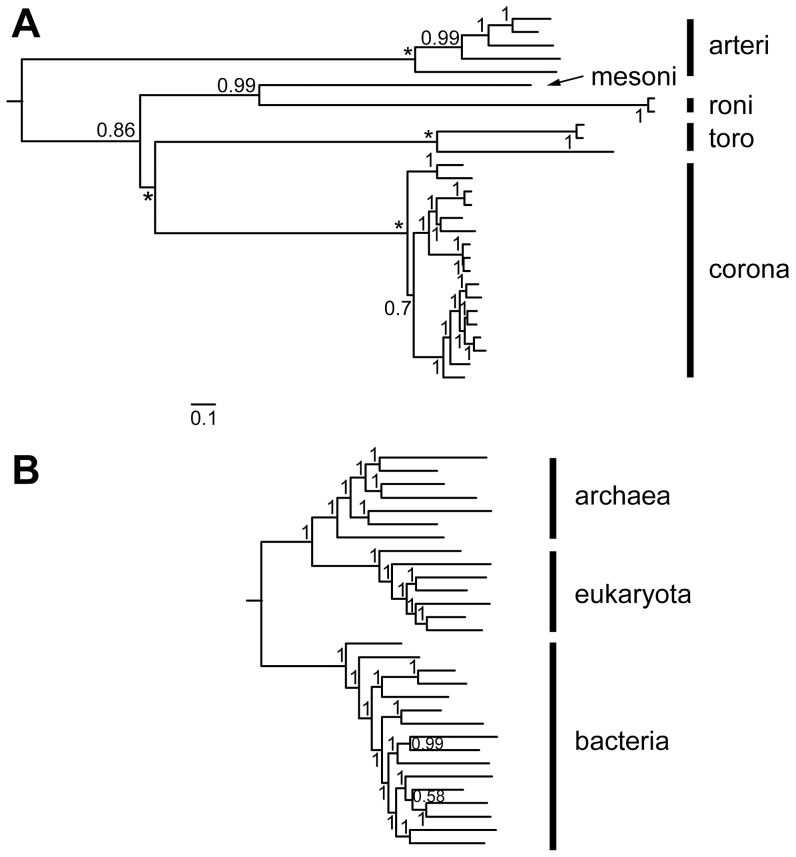
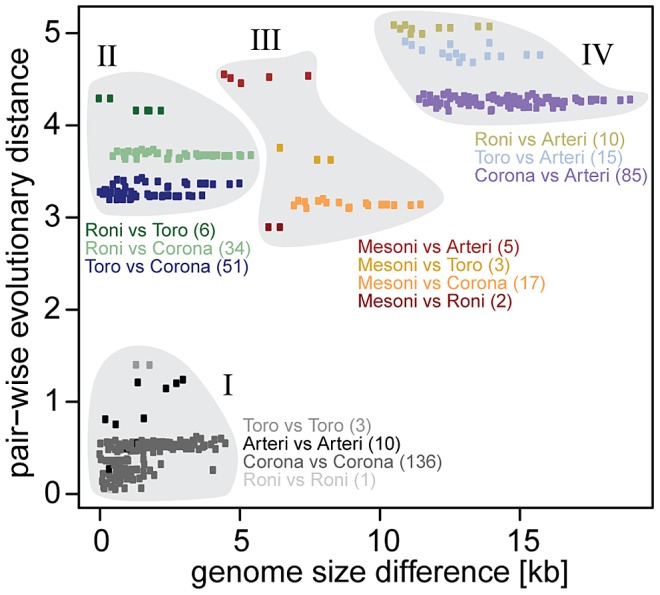
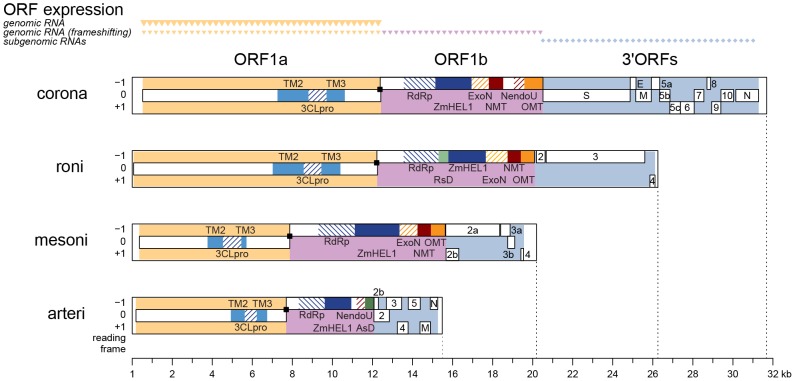
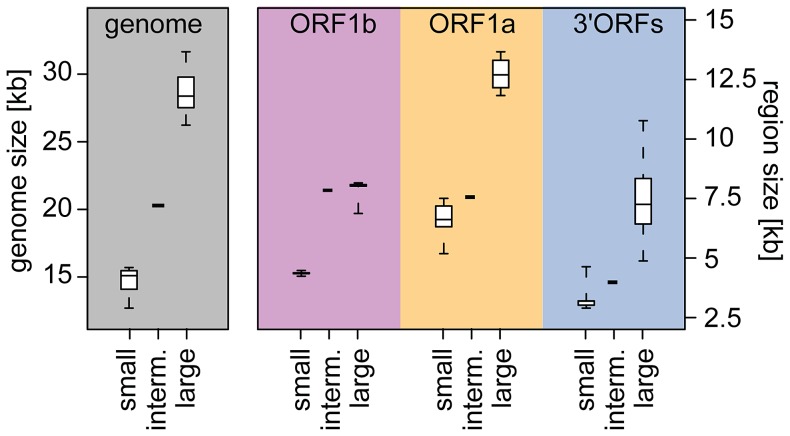
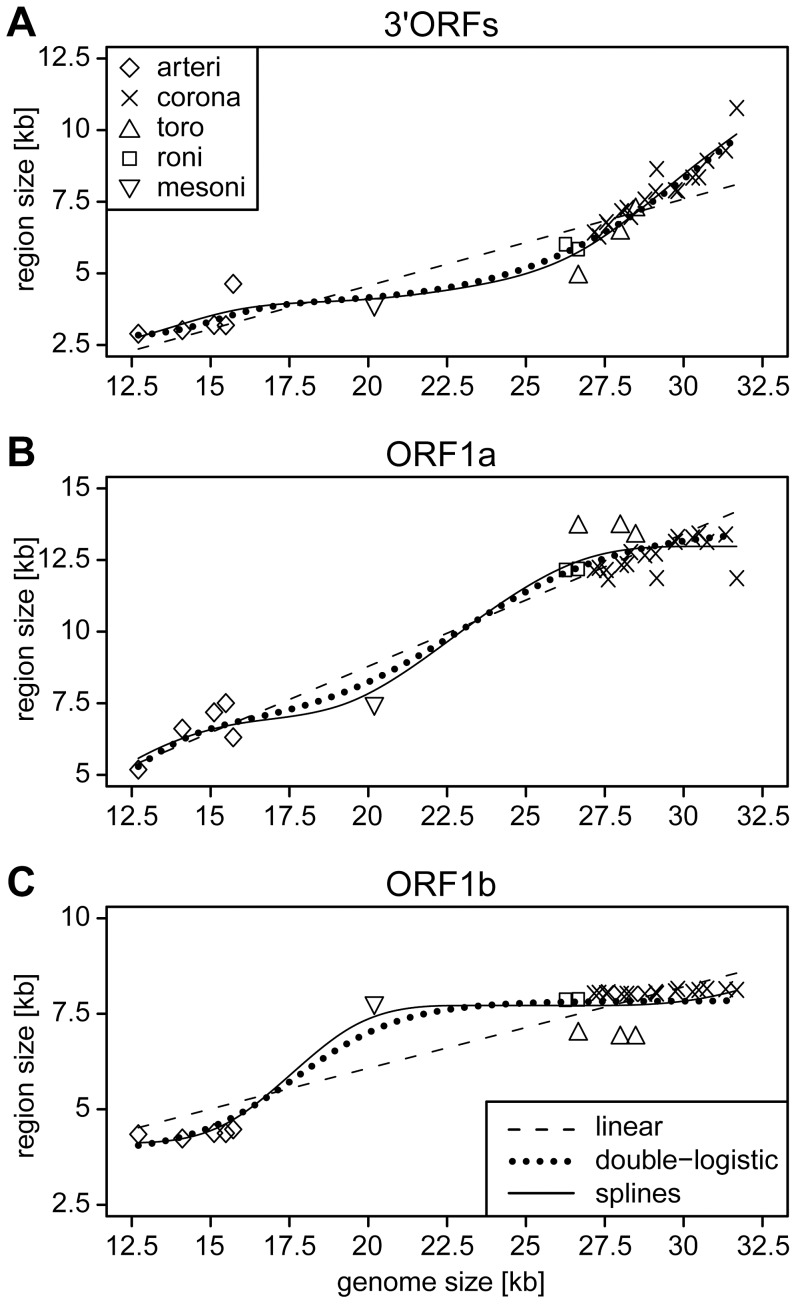
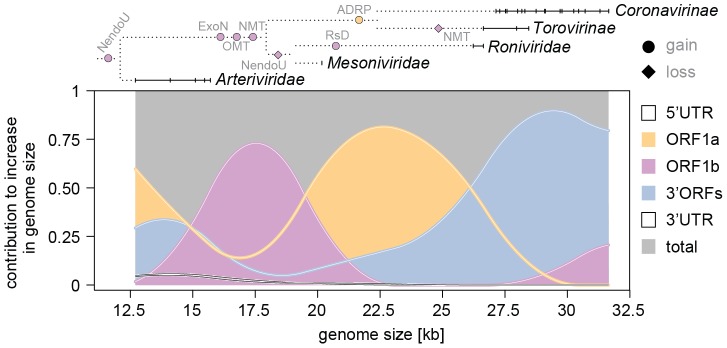
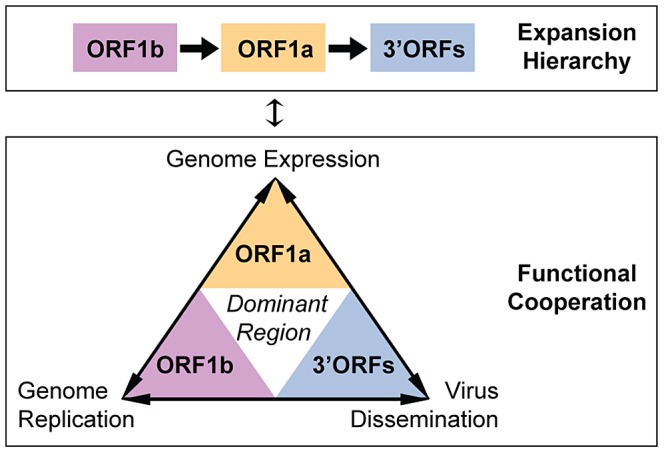
The small size of RNA virus genomes (2-to-32 kb) has been attributed to high mutation rates during replication, which is thought to lack proof-reading. This paradigm is being revisited owing to the discovery of a 3'-to-5' exoribonuclease (ExoN) in nidoviruses, a monophyletic group of positive-stranded RNA viruses with a conserved genome architecture. ExoN, a homolog of canonical DNA proof-reading enzymes, is exclusively encoded by nidoviruses with genomes larger than 20 kb. All other known non-segmented RNA viruses have smaller genomes. Here we use evolutionary analyses to show that the two- to three-fold expansion of the nidovirus genome was accompanied by a large number of replacements in conserved proteins at a scale comparable to that in the Tree of Life. To unravel common evolutionary patterns in such genetically diverse viruses, we established the relation between genomic regions in nidoviruses in a sequence alignment-free manner. We exploited the conservation of the genome architecture to partition each genome into five non-overlapping regions: 5' untranslated region (UTR), open reading frame (ORF) 1a, ORF1b, 3'ORFs (encompassing the 3'-proximal ORFs), and 3' UTR. Each region was analyzed for its contribution to genome size change under different models. The non-linear model statistically outperformed the linear one and captured >92% of data variation. Accordingly, nidovirus genomes were concluded to have reached different points on an expansion trajectory dominated by consecutive increases of ORF1b, ORF1a, and 3'ORFs. Our findings indicate a unidirectional hierarchical relation between these genome regions, which are distinguished by their expression mechanism. In contrast, these regions cooperate bi-directionally on a functional level in the virus life cycle, in which they predominantly control genome replication, genome expression, and virus dissemination, respectively. Collectively, our findings suggest that genome architecture and the associated region-specific division of labor leave a footprint on genome expansion and may limit RNA genome size.


Conflict of interest statement

The authors have declared that no competing interests exist.

Figures

Figure 1
Figure 1. Phylogeny of nidoviruses in comparison to the Tree of life (ToL).
Bayesian phylogenies of nidoviruses (A) and ToL (B) are drawn to a common scale of 0.1 amino acid substitutions per position. Major lineages are indicated by vertical bars and names; arteri: Arteriviridae, mesoni: Mesoniviridae, roni: Roniviridae, toro: Torovirinae, corona: Coronavirinae. Rooting was according to either (A) domain-specific outgroups or (B) as described . Posterior probability support values and fixed basal branch points (*) are indicated. The nidovirus and ToL alignments include, respectively, three enzymes and 56 single-gene protein families, 604 and 3336 columns, 2.95% and 2.8% gaps. For further details on the nidovirus tree see .
Figure 2
Figure 2. Relationship of evolutionary distance to genome size change in nidoviruses.
Evolutionary distance (average number of substitutions per amino acid position in the conserved proteins) in relation to difference in genome size is shown for each pair (n = 378) of the 28 nidovirus species. Points are colored according to pairs of major clades shown in Fig. 1A. The number of comparisons for each pair of clades is indicated by numbers in brackets. Points were grouped into clusters I (intra-lineage comparisons), II (large- vs. large-sized inter-lineage comparisons), III (intermediate-sized vs. others) and IV (small- vs. large-sized).
Figure 3
Figure 3. Genomic organization and expression, and key domains of four nidoviruses.
The coding regions are partitioned into ORF1a (yellow), ORF1b (violet) and the 3′ORFs (blue), which also differ in expression mechanism as indicated on top. Black squares, ribosomal frameshifting sites. Within ORFs (white rectangles), colored patterns highlight domains identified in: all nidoviruses [TM2, TM3, 3CLpro, RdRp, and Zn-cluster binding domain fused with HEL1 (ZmHEL1) - light and dark blue], large nidoviruses (ExoN, OMT - orange), certain clades (NMT, NendoU - red; ronivirus-specific domain (RsD) - light green; arterivirus-specific domain (AsD) - dark green). Genomic organizations are shown for Beluga whale coronavirus SW1 (corona), gill-associated virus (roni), Nam Dinh virus (mesoni), and porcine respiratory and reproductive syndrome virus North American type (arteri).
Figure 4
Figure 4. Nidovirus genome and region size differences.
Shown are size distributions of genomes (left part) and the three genome coding parts ORF1b, ORF1a and 3′ORFs (right part) for five small-sized arterivirus species (small), 22 large-sized nidovirus species (large) and one intermediate-sized mesonivirus species (interm.). The distributions are represented by box-and-whisker graphs, where the box spans from the first to the third quartile and includes the median (bold line). The whiskers extend (dashed lines) to the extreme values.
Figure 5
Figure 5. Relationship of sizes of three major coding regions and genome size in the nidovirus evolution.
For 28 nidoviruses representing species diversity, absolute sizes of 3′ORFs (A), ORF1a (B), and ORF1b (C) are plotted against the size of the genome. Different symbols were used to group the viruses into five major phylogenetic lineages (see inlet in A). Results of weighted linear, double-logistic and 3rd order monotone splines regression analyses are depicted. The three regression models (see inlet in C) fit the data with weighted r2 values of 0.908 (linear), 0.949 (double-logistic) and 0.960 (splines) for ORF1a, 0.758, 0.898 and 0.929 for ORF1b, and 0.835, 0.950 and 0.954 for 3′ORFs. For fit comparison of regression models see Table 1.
Figure 6
Figure 6. Region-specific, wavelike dynamics of the nidovirus genome expansions.
Relative contributions of the genome regions ORF1a, ORF1b, 3′ORFs, 5′UTR and 3′UTR to the increase in genome size are calculated according to the splines regression and plotted on top of each other and against their sum = 1. Solid horizontal lines and vertical bars on top: genome size ranges and samplings for nidovirus lineages indicated by names. Dotted lines: topology of major nidovirus branches. Selected domains gained (ExoN, OMT, NMT, RsD and ADRP, circles) and lost (NendoU and NMT, diamonds) are colored according to ORF in which they are encoded. See also Fig. 3, Fig. S2 and the main text.
Figure 7
Figure 7. Hierarchy and cooperation in the nidovirus genome expansions.
Functional and evolutionary relations between the three major coding regions of the nidovirus genome are depicted. For a brief description on the relationship between these three coding regions and the processes they dominate in the nidovirus life cycle, see text.

References

    1. Szathmary E, Smith JM (1995) The Major Evolutionary Transitions. Nature 374: 227–232. - PubMed
    1. Lynch M, Conery JS (2003) The origins of genome complexity. Science 302: 1401–1404. - PubMed
    1. Drake JW, Charlesworth B, Charlesworth D, Crow JF (1998) Rates of spontaneous mutation. Genetics 148: 1667–1686. - PMC - PubMed
    1. Sniegowski PD, Gerrish PJ, Johnson T, Shaver A (2000) The evolution of mutation rates: separating causes from consequences. Bioessays 22: 1057–1066. - PubMed
    1. Gago S, Elena SF, Flores R, Sanjuan R (2009) Extremely High Mutation Rate of a Hammerhead Viroid. Science 323: 1308. - PubMed

Publication types

MeSH terms

LinkOut - more resources