. 2013;9(7):e1003596.
doi: 10.1371/journal.pgen.1003596. Epub 2013 Jul 11.

Odoriferous Defensive stink gland transcriptome to identify novel genes necessary for quinone synthesis in the red flour beetle, Tribolium castaneum

Affiliations

Odoriferous Defensive stink gland transcriptome to identify novel genes necessary for quinone synthesis in the red flour beetle, Tribolium castaneum

Jianwei Li et al. PLoS Genet. 2013.

Abstract

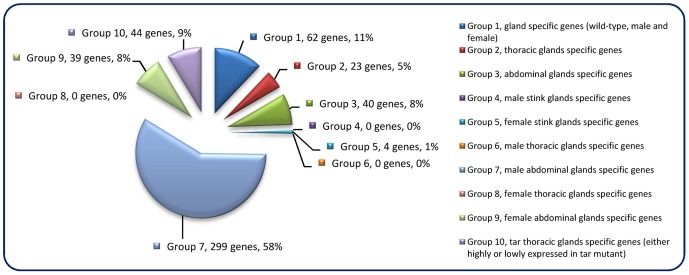
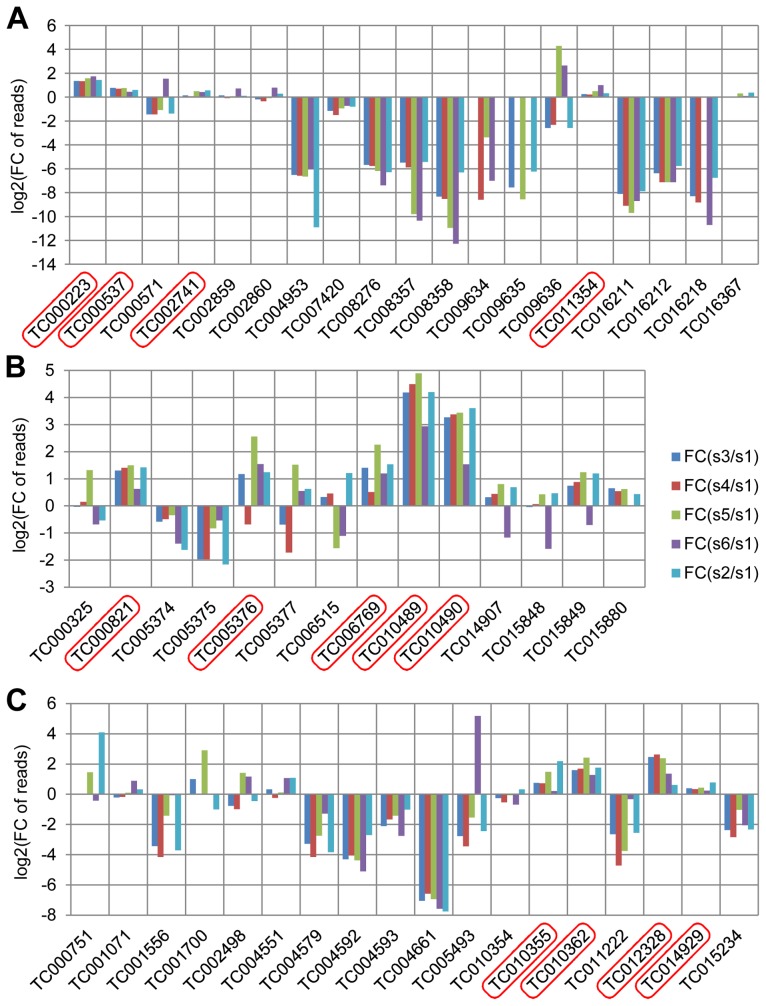
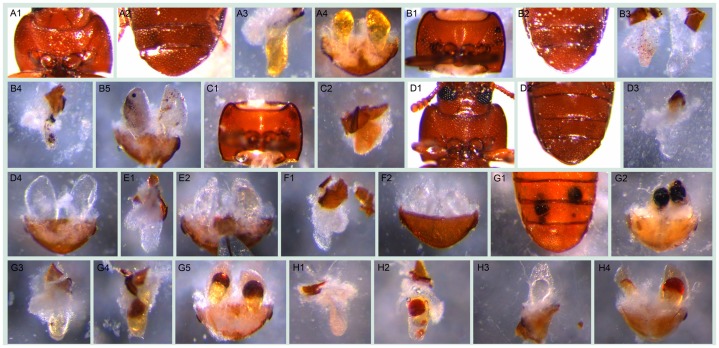
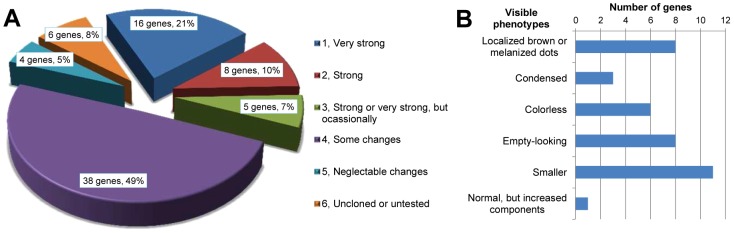
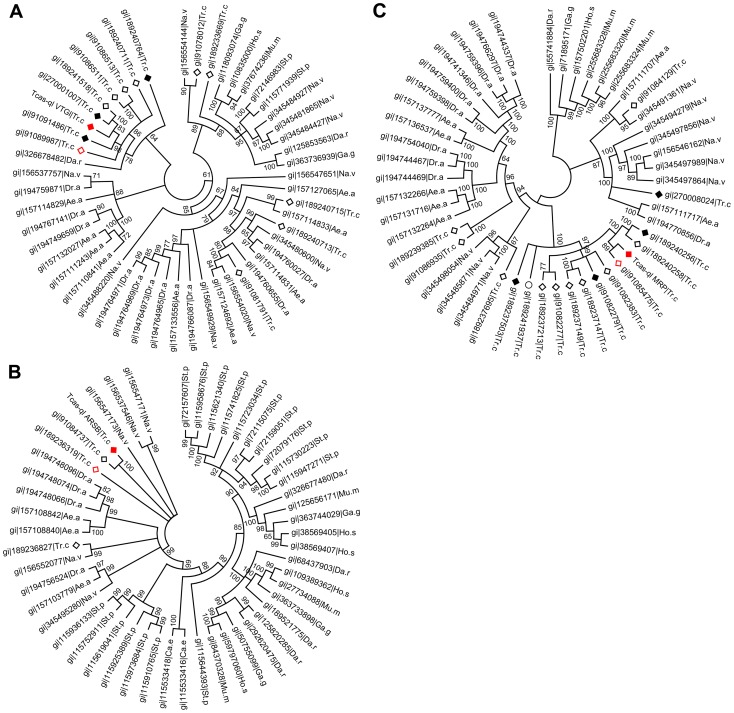
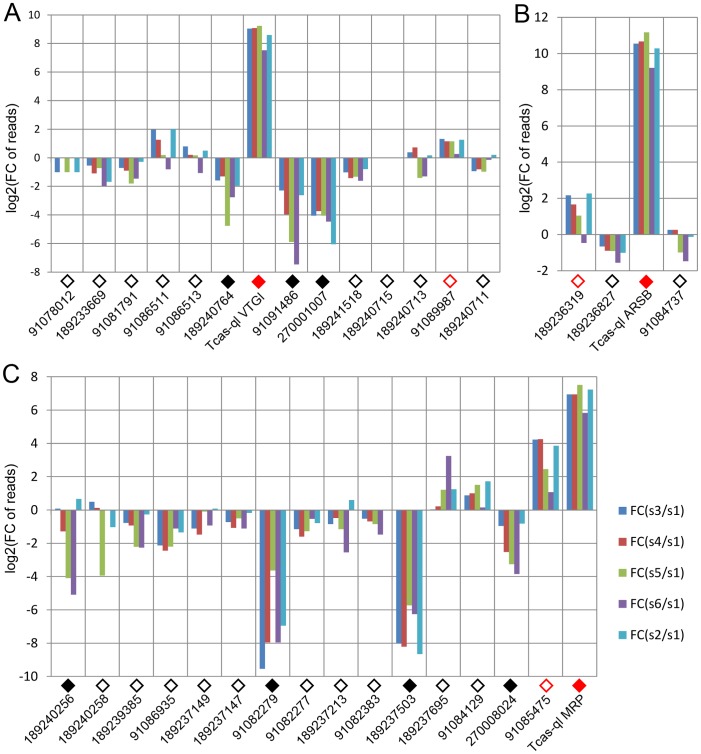
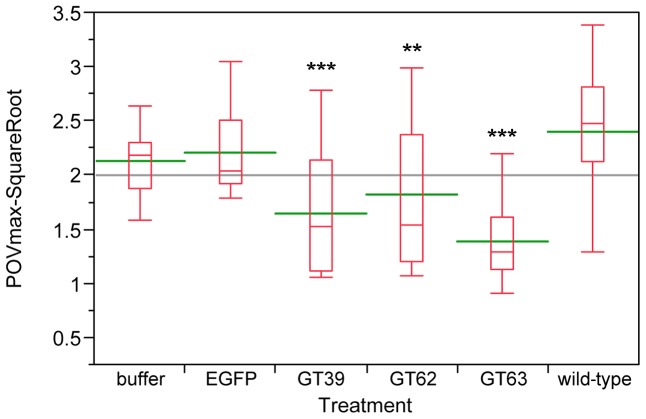
Chemical defense is one of the most important traits, which endow insects the ability to conquer a most diverse set of ecological environments. Chemical secretions are used for defense against anything from vertebrate or invertebrate predators to prokaryotic or eukaryotic parasites or food competitors. Tenebrionid beetles are especially prolific in this category, producing several varieties of substituted benzoquinone compounds. In order to get a better understanding of the genetic and molecular basis of defensive secretions, we performed RNA sequencing in a newly emerging insect model, the red flour beetle Tribolium castaneum (Coleoptera: Tenebrionidae). To detect genes that are highly and specifically expressed in the odoriferous gland tissues that secret defensive chemical compounds, we compared them to a control tissue, the anterior abdomen. 511 genes were identified in different subtraction groups. Of these, 77 genes were functionally analyzed by RNA interference (RNAi) to recognize induced gland alterations morphologically or changes in gland volatiles by gas chromatography-mass spectrometry. 29 genes (38%) presented strong visible phenotypes, while 67 genes (87%) showed alterations of at least one gland content. Three of these genes showing quinone-less (ql) phenotypes - Tcas-ql VTGl; Tcas-ql ARSB; Tcas-ql MRP - were isolated, molecularly characterized, their expression identified in both types of the secretory glandular cells, and their function determined by quantification of all main components after RNAi. In addition, microbe inhibition assays revealed that a quinone-free status is unable to impede bacterial or fungal growth. Phylogenetic analyses of these three genes indicate that they have evolved independently and specifically for chemical defense in beetles.


Conflict of interest statement

The authors have declared that no competing interests exist.

Figures

Figure 1
Figure 1. Odoriferous gland transcriptome screening result.
Each pie slice is indicated with the group name, the number of genes classified, and their percentage. Each group is signified as a specific non-overlapping subtraction group with each gene belonging to only one group. E.g. Group 1 consists of genes that are highly expressed in all glands but not specifically in one gland type or only in one sex.
Figure 2
Figure 2. GO annotation of odoriferous glands transcriptome data.
A, analyses of the genes abundant in control (Ctl; 1451 genes abundant in anterior abdomen transcriptome), wild-type glands (Glands; 1206 genes), and the genes identified in all ten subtraction groups (Figure 1) together (G1–G10; 511 genes). B, analyses of individual Group 1 to Group 10, respectively and the control (Ctl; 290 genes possessing at least 64 times higher reads in anterior abdomen than the wild-type gland samples). X-axis: different GO terms (level 2); Y-axis: percentage of the genes classified in each group.
Figure 3
Figure 3. Annotated quinone synthesis-related genes and their relative gland transcriptome expression levels.
A, glucosidases, 19 genes; B, phenol oxidases, 14 genes; C, peroxidases, 18 genes were annotated. In all charts, along the X-axes the different genes are presented, while the Y-axes present log2[fold change of reads in glands against control]. Abbreviations: FC: fold change; s1: sample 1, anterior abdomen as a control; s3: sample 3, male prothoracic glands; s4: sample 4, female prothoracic glands; s5: sample 5, male abdominal glands; s6: sample 6, female abdominal glands; s2: sample 2, tar prothoracic glands. The genes with higher reads in gland samples are marked with red squares.
Figure 4
Figure 4. Visible morphological gland phenotypes after RNAi.
A1–A4, wild-type: A1, thr (darker regions on two sides); A2, abd (darker regions on the tip); A3, thrg reservoir filled with yellowish oily fluid ; A4, abdg; B1–B5, GT20 knock-down: B1, thr, visible melanized dots on both sides; B2, abd, darker gland regions; B3, thrg, left one, small localized brown dots, right one, tiny localized brown dots accompanied by colorless oily secretions; B4, thrg, localized melanized dots; B5, abdg, localized melanized (left) or brown (right) dots; C1–C2, GT47 knock-down: C1, thr; C2, thrg, condensed secretions, i.e. not as semitransparent as in wild-type and close to solid; D1–D4, GT62 knock-down: D1–D2, thr and abd with the gland regions almost invisible through cuticle; D3, thrg, very few colorless secretions, in some cases, empty-looking (not shown); D4, abdg, colorless secretions; E1–E2, GT39 knock-down, thrg (E1) and abdg (E2), colorless secretions; F1–F2, GT63 knock-down, thrg (F1) and abdg (F2, ventral view), colorless secretions; G1–G5, GT02 knock-down, at stage A10 localized melanized dots (G1, abd; G2, abdg), at stage 24 localized brown dots to different extent (G3 and G4, thrg, G5, abdg); H1–H4, GT25 knock-down, various phenotypes: H1 and H2, thrg, tiny (H1) or big (H2) localized brown dots; H3, left half abdg, oily colorless secretions; H4, abdg, localized brown dots. The beetles used for G3–G5 were from stage A24, all the others were at stage A10. The statistics of the visible phenotypes are in Figure 5B. Abbreviations used in this legend: stage A10, adults ten days; A24, twenty four days after eclosure; abd, abdominal tip, ventral view; abdg, dissected abdominal tip with abdominal glands, dorsal view; thr, prothorax, ventral view; thrg, dissected prothoracic gland(s), with the opening on top, the secretory cells are attached to the reservoir.
Figure 5
Figure 5. Phenotype classifications of 77 highly gland-specifically expressed genes by RNAi.
A, Description of phenotype strengths: 1, Very strong: at least one type of chemical was undetectable or less than 5% left in thoracic or/and abdominal glands; 2, Strong: at least one type of chemical was 75%–95% reduced or increased by more than 75% in thoracic or/and abdominal glands; 3, Strong or very strong but occasionally: phenotype was similar to 1 or 2 but not observed in all the injected beetles; 4, Some changes: at least one type of chemical was 25%–75% reduced or increased in thoracic or/and abdominal glands; 5, Neglectable changes: less than 25% reduction or increase in any type of chemical; 6, uncloned or untested. B, Strong and very strong gland phenotypes (strengths 1–3 in panel A) in details, some genes had more than one phenotype. Except for the last two classifications, examples are provided in Figure 4: localized brown or melanized dots (4B1-B5 and G2-G5); condensed (4C1-C2); colorless (4E1-F2); empty-looking (4D3).
Figure 6
Figure 6. Quantification of main volatile glandular chemicals by GC-MS in wild-type and novel quinone-less gene RNAi-knock-downs.
Comparisons in female thoracic glands (ft) (A), female abdominal glands (fa) (B), male thoracic glands (mt) (C), and male abdominal glands (ma) (D). Y-axis: amount in nanogram; X-axis: wild-type and different RNAi-knock-downs. Abbreviations: wt: wild-type; E: dsEGFP-injected control; GT39: Tcas-ql VTGl; GT62: Tcas-ql ARSB; GT63: Tcas-ql MRP; MBQ-sum: methyl-1,4-benzoquinone; EBQ-sum: ethyl-1,4-benzoquinone; 15ene: 1-pentadecene; 17diene: 1,8-heptadecadiene; 17ene: 1-heptadecene. The error bars indicate standard deviations at N = 15–30.
Figure 7
Figure 7. Phylogenetic trees of homologs of the three novel quinone-less proteins.
A, Tcas-ql VTGl (GT39); B, Tcas-ql ARSB (GT62); C, Tcas-ql MRP (GT63). All the Tribolium homologs were marked based on their relative gland expression levels (Figure 8). The solid red squares indicate each of the three quinone-less gene encoded proteins, the open red squares relatively high expression in gland samples, the solid black squares relatively high expression in the control sample, the open black squares the other Tribolium homologs, and an open black circle indicates a Tribolium homolog without OGS annotation. The numbers on the branching points are the statistical frequencies. Abbreviations of species names are: Ae.a, Aedes aegypti; Ca.e, Caenorhabditis elegans; Da.r, Danio rerio; Dr.a, Drosophila ananassae; Ga.g, Gallus gallus; Ho.s, Homo sapiens; Mu.m, Mus musculus; Na.v, Nasonia vitripennis; St.p, Strongylocentrotus purpuratus; Tr.c, Tribolium castaneum.
Figure 8
Figure 8. Relative transcriptomic gland expression levels of the Tribolium homologs of the three novel quinone-less genes.
A, Tcas-ql VTGl (GT39) homologs. B, Tcas-ql ARSB (GT62) homologs. C, Tcas-ql MRP (GT63) homologs. In all charts, along the X-axes the different genes are presented (using the same GI numbers and expression level square codes as in Figure 7), while Y-axes present log2[fold change of reads in glands against control]. For abbreviations see Figure 3.
Figure 9
Figure 9. Expression patterns of the three quinone-less genes.
The first column (A1, B1, C1, and D1) shows prothoracic glands, the second (A2, B2, C2, D2) abdominal glands, and the third (A3, B3, C3, D3) gland schemes drawn based on own observations and previous depictions of Happ and Eisner . A1–A3, Tcas-ql VTGl (GT39) sense probes. B1–B3, Tcas-ql VTGl (GT39) antisense probes. C1–C3, Tcas-ql ARSB (GT62) antisense probes. D1–D3, Tcas-ql MRP (GT63) antisense probes. In the right lower corner of the panels in the first and second column, the expression was digitally magnified 4 times, with its original positions indicated by a square box or triangles within the same panel. Cell type 1 and cell type 2 were separately indicated in the abdominal glands, cell type 1 was zoomed in the right lower corner of the square, and cell type 2 in the left upper part of the square. Scale bars: 50 µm.
Figure 10
Figure 10. Microbe growth inhibition assays of wild-type and RNAi-knock-down glands.
The fungus A. niger (A) and the bacterium A. globiformis (B) were analyzed for gland-mediated growth inhibition. Y-axes indicate the areas of respective inhibition zones (cm2). X-axes: sex-specific wild-type (wt) and different RNAi-knock-downs (m: male; fm: female; GT12: gene causing alkene-less phenotype; GT63: Tcas-ql MRP). Non-parametric comparisons were made between wild-type and knock-downs using Wilcoxon method, ***, P<0.001; **, 0.001<p<0.01. The error bars indicate standard deviations at N = 11–27.
Figure 11
Figure 11. Phenol oxidase (PO) activity assays of wild-type and novel quinone-less gene RNAi knock-downs in females.
The Y-axis indicates the square root of PO Vmax, red boxes are boxplots, green lines represent the mean value, the gray line represents the grand mean, while the X-axis presents wild-type, control injections, and different RNAi-knock-downs (N = 12–25). Buffer: buffer-injection control; EGFP: dsEGFP-injection control; GT39: Tcas-ql VTGl; GT62: Tcas-ql ARSB; GT63: Tcas-ql MRP. The asterisks (*) mark the t-test results comparing to wild-type: ***: p<0.001; **: 0.001<p<0.01. Buffer- and EGFP-injected controls were not significantly different from wild-type.

Similar articles

Cited by

References

    1. Chapman AD (2009) Numbers of living species in Australia and the world. Second. Canberra, Australia: Australian Biological Resources Study (ABRS). 80 pp. Available:http://www.environment.gov.au/biodiversity/abrs/publications/other/speci.... Accessed 9 August 2012.
    1. Wilson EO (2006) Threats to Global Diversity. Available:http://www.globalchange.umich.edu/globalchange2/current/lectures/biodive.... Accessed 9 August 2012.
    1. Eisner T (1970) Chemical defense against predation in arthropods. In: Sondheimer E, Simeone JB, editors. Chemical Ecology. New York: Academic Press, Vol. Academic P. pp. 157–217.
    1. Eisner T (1966) Beetle's spray discourages predators. Natural History 75: 42–47.
    1. Blum MS (1981) Chemical defenses of arthropods. United Kin. London: Academic Press. 562 pp. Available:http://www.cabdirect.org/abstracts/19820594729.htmljsessionid=6D34AB6A23.... Accessed 9 August 2012.

Publication types

LinkOut - more resources