. 2013;9(7):e1003598.
doi: 10.1371/journal.pgen.1003598. Epub 2013 Jul 11.

The RNA-binding proteins FMR1, rasputin and caprin act together with the UBA protein lingerer to restrict tissue growth in Drosophila melanogaster

Affiliations

The RNA-binding proteins FMR1, rasputin and caprin act together with the UBA protein lingerer to restrict tissue growth in Drosophila melanogaster

Roland Baumgartner et al. PLoS Genet. 2013.

Abstract

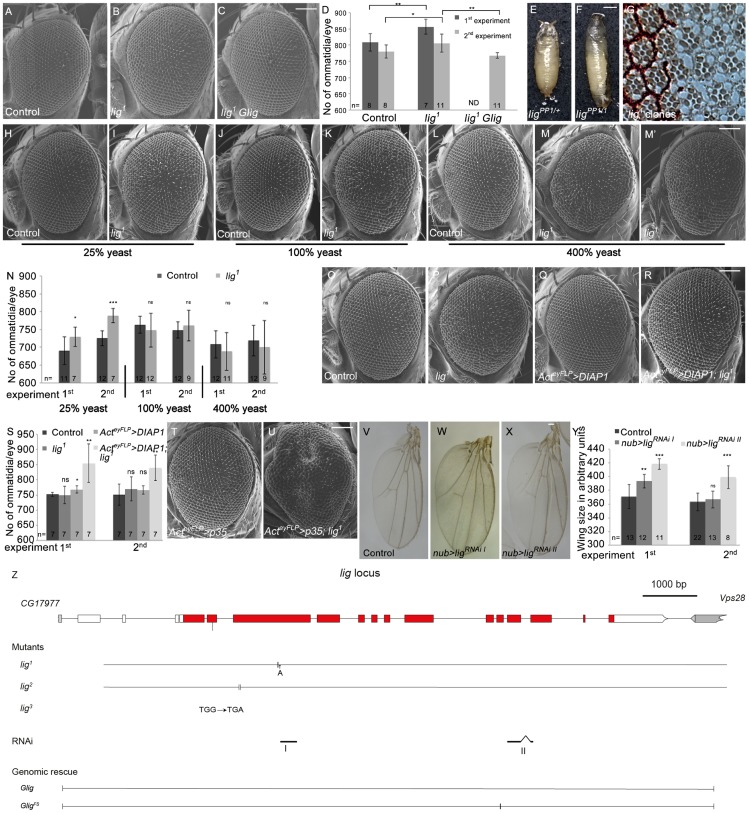
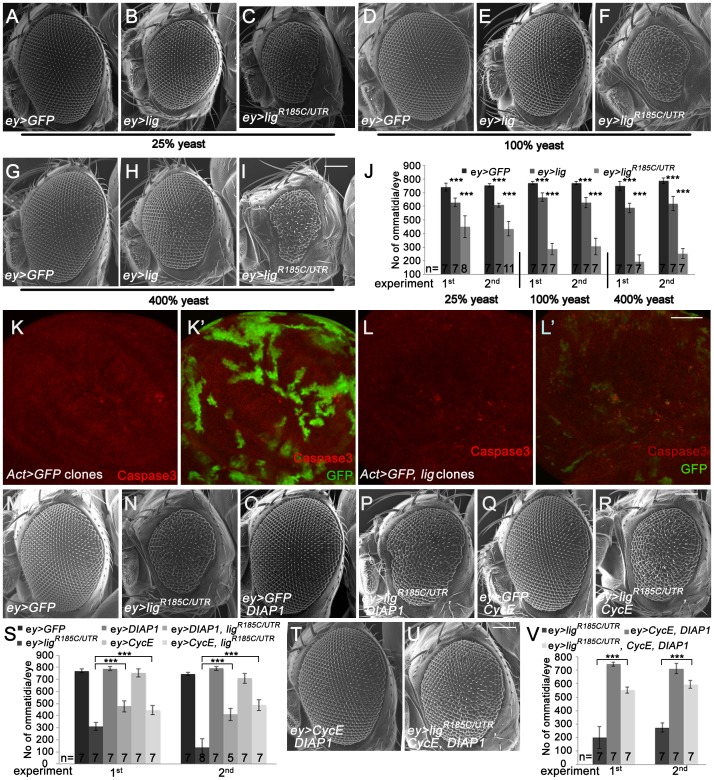
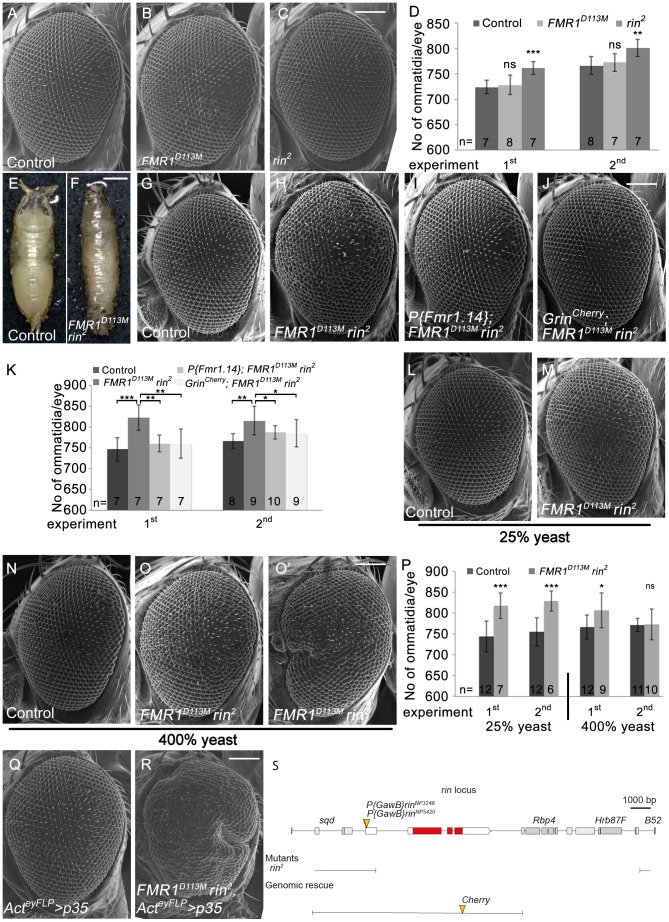
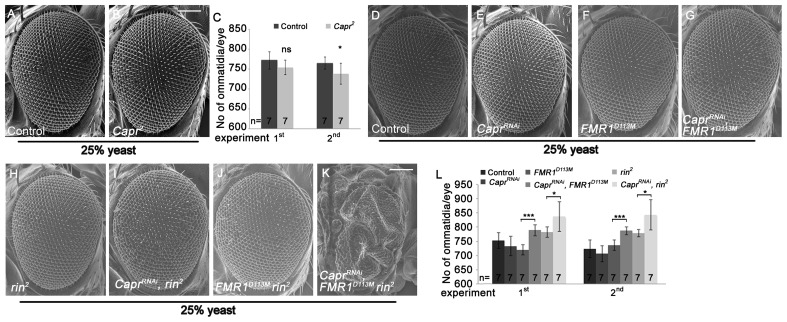
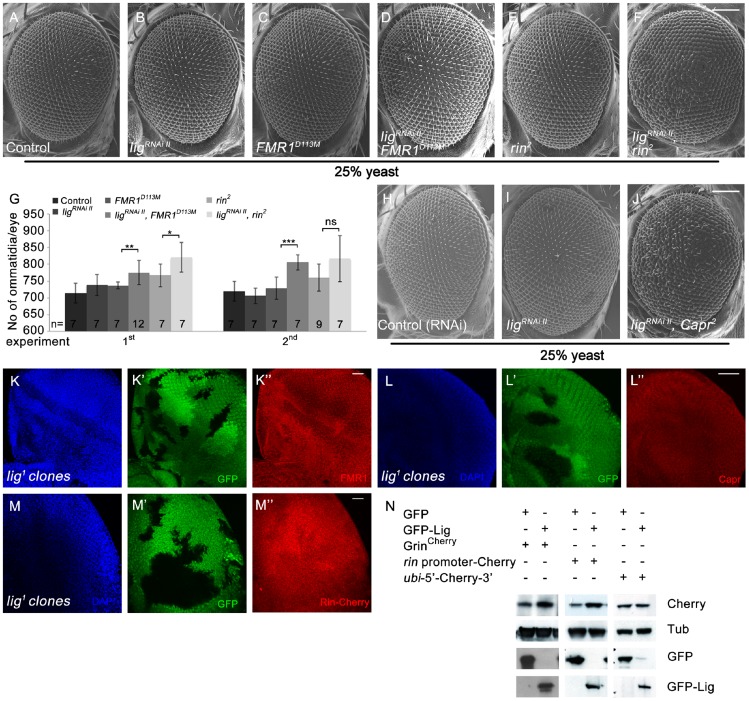
Appropriate expression of growth-regulatory genes is essential to ensure normal animal development and to prevent diseases like cancer. Gene regulation at the levels of transcription and translational initiation mediated by the Hippo and Insulin signaling pathways and by the TORC1 complex, respectively, has been well documented. Whether translational control mediated by RNA-binding proteins contributes to the regulation of cellular growth is less clear. Here, we identify Lingerer (Lig), an UBA domain-containing protein, as growth suppressor that associates with the RNA-binding proteins Fragile X mental retardation protein 1 (FMR1) and Caprin (Capr) and directly interacts with and regulates the RNA-binding protein Rasputin (Rin) in Drosophila melanogaster. lig mutant organs overgrow due to increased proliferation, and a reporter for the JAK/STAT signaling pathway is upregulated in a lig mutant situation. rin, Capr or FMR1 in combination as double mutants, but not the respective single mutants, display lig like phenotypes, implicating a redundant function of Rin, Capr and FMR1 in growth control in epithelial tissues. Thus, Lig regulates cell proliferation during development in concert with Rin, Capr and FMR1.


Conflict of interest statement

The authors have declared that no competing interests exist.

Figures

Figure 1
Figure 1. Lig regulates organ size during development.
(A–C) Scanning electron micrographs of the control (A), lig mutant overgrown eyes (B), and lig mutant eyes rescued by one copy of Glig (C). The mutant eyes were generated by eyFLP/FRT-mediated mitotic recombination. Scale bar represents 100 µm. (D) Quantification of ommatidia number from two independent experiments. Statistical analyses were done with a Student's t test (two-tailed, unpaired). Error bars indicate the standard deviations, (n) number of organs analyzed. Mean ± s.d. and p-values: Control (808±27 and 780±20), lig mutant eyes (856±23; p = 0.0027 and 806±28; p = 0.031) and lig mutant eyes with one copy of a genomic rescue transgene for lig (ND (not determined) and 768±9; p = 0.0011). (E–F) lig1 in combination with ligPP1, a lig null mutant allele, causes long, slender pupae (F) in comparison to the control (E). Scale bar represents 500 µm. (G) Tangential eye sections of adult lig1 mosaic eyes reveal normal differentiation and cell size in lig1 mutant clones. The lig1 mutant cells are marked by the absence of pigmentation. (H–M) Scanning electron micrographs of adult control and lig1 mutant eyes generated by eyFLP/FRT-mediated mitotic recombination from flies grown on 25% (H–I), 100% (J–K) or 400% (L–M') yeast-containing food. Scale bar represents 100 µm. (N) Statistical analyses as described in Figure 1D: control (690±39 and 726±21) and lig1 mutant (729±27; p = 0.022 and 789±20; p = 2.35E-05) eyes at 25% yeast-containing food, control (763±23 and 749±23) and lig1 mutant (747±47; p = 0.33 and 761±43; p = 0.46) eyes at 100% yeast-containing food, and control (708±38 and 719±43) and lig1 mutant (688±53; p = 0.35 and 700±75; p = 0.48) eyes at 400% yeast-containing food. (O–R) Scanning electron micrographs of adult control (O), lig1 mutant (P), DIAP1 overexpressing (Q) and lig1 mutant DIAP1 overexpressing eye (R) generated by eyFLP, Actin-Flp out-Gal4/FRT-mediated mitotic recombination. Scale bar represents 100 µm. (S) Statistical analyses as described in Figure 1D: control (752±7 and 751±35), lig1 mutant (750±29; p = 0.85 and 770±40; p = 0.36), DIAP1 overexpressing (768±12; p = 0.016 and 766±14; p = 0.34) and lig1 mutant DIAP1 overexpressing (855±64; p = 0.0053 and 840±42; p = 0.0011) eyes. (T–U) Scanning electron micrographs of adult p35 overexpressing (T) and lig1 mutant p35 overexpressing eyes (U) generated by eyFLP, Actin-Flp out-Gal4/FRT-mediated mitotic recombination. Scale bar represents 100 µm. (V–X) Wings overexpressing the indicated UAS transgenes under the control of nub-Gal4. Scale bar represents 100 µm. (Y) Statistical analyses of wing area (as described in Figure 1D) of wings overexpressing a control UAS-RNAi transgene (371±17.7 and 363±12.9), UAS-ligRNAi I (393±9.9; p = 1.28E-03 and 366.8±12.4; p = 0.41) and UAS-ligRNAi II (418.5±7.6; p = 9.47E-06 and 399.3±16.6; p = 2.14E-04). (Z) The lig locus (drawn to scale) spans 11.5 kbp and consists of 14 protein-coding exons. lig1 and lig2 are small deletions in the third exon resulting in a frameshift and premature stop codon. lig3 contains a premature stop codon in the second exon. The RNAi lines I and II are specific for exon 3 and for exons 11 and 12, respectively. The genomic rescue construct Glig includes 12 kbp. GligFS lacks a nucleotide in exon 10 leading to a frameshift and a premature stop. Genotypes: (A) y w eyFLP/y w; FRT42 cl w+/FRT42 (B) y w eyFLP/y w; FRT42 cl w+/FRT42 lig1 (C) y w eyFLP/y w; FRT42 cl w+/FRT42 lig1; Glig [61B3]/+ (E) y w; ligPP1/FRT42 (F) y w; ligPP1/FRT42 lig1 (G) y w hsFlp/y w; FRT42 w+/FRT42 lig1 (H, J and L) y w eyFLP/y w; FRT42 P{SUPor-P}VhaAC45KG02272 (cl)/FRT42 (I, K, M and M') y w eyFLP/y w; FRT42 P{SUPor-P}VhaAC45KG02272 (cl)/FRT42 lig1 (O) y w eyFLP, Act>CD2>Gal4/y w; FRT42 P{SUPor-P}VhaAC45KG02272 (cl)/FRT42 (P) y w eyFLP, Act>CD2>Gal4/y w; FRT42 P{SUPor-P}VhaAC45KG02272 (cl)/FRT42 lig1 (Q) y w eyFLP, Act>CD2>Gal4/y w; FRT42 P{SUPor-P}VhaAC45KG02272 (cl)/+; EP-DIAP1/+ (R) y w eyFLP, Act>CD2>Gal4/y w; FRT42 P{SUPor-P}VhaAC45KG02272 (cl)/FRT42 lig1; EP-DIAP1/+ (T) y w eyFLP, Act>CD2>Gal4/y w; FRT42 P{SUPor-P}VhaAC45KG02272 (cl)/+; UAS-p35/+ (U) y w eyFLP, Act>CD2>Gal4/y w; FRT42 P{SUPor-P}VhaAC45KG02272 (cl)/FRT42 lig1; UAS-p35/+ (V) y w; nub-Gal4/+; UAS-CG1315RNAi (control)/+ (W) y w; nub-Gal4/+; UAS-ligRNAi I [86Fb]/+ (X) y w; nub-Gal4/+; UAS-ligRNAi II [86Fb]/+.
Figure 2
Figure 2. Eyes overexpressing lig are reduced in size and are partially rescued by CycE and DIAP1 co-overexpression.
(A–I) Scanning electron micrographs of eyes overexpressing the indicated UAS transgenes under the control of ey-Gal4 during development from flies reared on 25% (A–C), 100% (D–F) and 400% (G–I) yeast-containing food, respectively. Scale bar represents 100 µm. (J) Statistical analyses as described in Figure 1D: ey>GFP (741±30 and 753±12), ey>lig (628±31; p = 1.66E-05 and 608±14; p = 1.17E-10) and ey>ligR185C/UTR (448±80; p = 4.35E-06 and 435±54; p = 8.12E-09) eyes at 25% yeast-containing food, ey>GFP (768±14 and 768±12), ey>lig (666±30; p = 3.03E-05 and 626±39; p = 3.09E-05) and ey>ligR185C/UTR (287±42; p = 9.50E-09 and 306±62; p = 5.38E-07) eyes at 100% yeast-containing food and ey>GFP (748±34 and 785±21), ey>lig (588±35; p = 1.55E-06 and 619±53; p = 6.71E-05) and ey>ligR185C/UTR (193±50; p = 1.18E-10 and 253±36; p = 2.84E-11) eyes at 400% yeast-containing food. (K–L) lig overexpressing clones (induced with the Actin-Flp out-Gal4 system and marked by GFP) in wing imaginal discs of third instar larvae undergo apoptosis as judged by Cleaved Caspase-3 staining (red) (L–L') in comparison to the control (K–K'). Scale bar represents 50 µm. (M–R) The reduced size of eyes overexpressing ligR185C/UTR induced by ey-Gal4 (N) is partially rescued by co-overexpression of DIAP1, an inhibitor of apoptosis (P), or CycE (R). Overexpression of DIAP1 (O) or CycE (Q) has no effect on eye size in comparison to the control (M). Scale bar represents 100 µm. (S) Statistical analyses as described in Figure 1D: ey>GFP (770±15 and 746±14), ey>ligR185C/UTR (309±34 and 135±73), ey>GFP, DIAP1 (789±17 and 790±16), ey>ligR185C/UTR, DIAP1 (477±47; p = 9.60E-06 and 410±51; p = 7.97E-06), ey>GFP, CycE (753±33 and 708±42), and ey>ligR185C/UTR, CycE (446±38; p = 1.47E-05 and 488±46; p = 1.01E-07) eyes. (T–U) The rescue of the reduced size of eyes overexpressing ligR185C/UTR induced by ey-Gal4 is improved by co-overexpression of DIAP1 and CycE (U) in comparison to the rescue experiment of co-overexpression of DIAP1 or CycE. Co-overexpression of DIAP1 and CycE has no effect on eye size in a wild-type background (T). Scale bar represents 100 µm. (V) Statistical analyses as described in Figure 1D: ey>ligR185C/UTR (201±83 and 275±35), ey>CycE, DIAP1 (744±14 and 712±37), ey>ligR185C/UTR, CycE, DIAP1 (551±23; p = 1.45E-05 and 595±29; p = 5.38E-10) Genotypes: (A, D and G) w/y w; ey-Gal4/UAS-GFP (B, E and H) w/y w; ey-Gal4/+; UAS-lig/+ (C, F, and I) w/y w; ey-Gal4/+; UAS-ligR185C/UTR/+ (K) y w hsFLP/y w; UAS-GFP/+; Act>CD2>Gal4, UAS-GFP/+ (L) y w hsFLP/y w; Act>CD2>Gal4, UAS-GFP/UAS-lig [86Fb] (M–R) first experiment: (M) w/y w; ey-Gal4/UAS-GFP (N) w/y w; ey-Gal4/+; UAS-ligR185C/UTR/+ (O) w/y w; ey-Gal4/UAS-GFP; EP-DIAP1/+ (P) w/y w; ey-Gal4/+; UAS-ligR185C/UTR/EP-DIAP1 (Q) w/y w; ey-Gal4/UAS-GFP; UAS-CycE/+ (R) w/y w; ey-Gal4/+; UAS-ligR185C/UTR/UAS-CycE; second experiment: (M) w/y w; ey-Gal4/UAS-GFP; UAS-lacZ (N) w/y w; ey-Gal4/UAS-GFP; UAS-ligR185C/UTR/+ (O) w/y w; ey-Gal4/UAS-GFP; EP-DIAP1/+ (P) w/y w; ey-Gal4/+; UAS-ligR185C/UTR/EP-DIAP1 (Q) w/y w; ey-Gal4/UAS-GFP; UAS-CycE/+ (R) w/y w; ey-Gal4/+; UAS-ligR185C/UTR/UAS-CycE (T) w/y w; ey-Gal4/UAS-CycE; EP-DIAP1/+ (U) w/y w; ey-Gal4/UAS-CycE; UAS-ligR185C/UTR/EP-DIAP1.
Figure 3
Figure 3. Lig co-localizes with Rin, FMR1, Capr and P-body components in cultured Drosophila S2 cells.
(A–D''') S2 cells co-transfected with GFP-lig (A', A''') and RFP-FMR1 (A'', A'''), GFP-lig (B', B''') and RFP-rin (B'', B'''), GFP-lig (C', C''') and RFP-Capr (C'', C''') and GFP-lig (D, D'''), RFP-FMR1 (D', D''') and FLAG-rin (D'', D'''). Cells were stained with DAPI to visualize DNA (blue) and for the FLAG-tag to visualize FLAG-Rin (D'', D'''). Scale bars represent 25 µm. (E–F''') Lig co-localizes with P-body markers in S2 cells transfected with GFP-DCP1 (E', E''') and RFP-lig (E'', E'''), and GFP-lig (F', F'''). Cells were stained with DAPI (blue) to visualize DNA and with anti-Ago1 antibody (F'', F'''). Note that endogenous Ago1 is accumulating in GFP-Lig foci. Scale bars represent 25 µm.
Figure 4
Figure 4. Lig interacts with Rin in Y2H experiments.
(A) Y2H interactions between Lig, LigFG-LA, Rin, Rin1–175 and Rin129–492. Lig fused to the DBD interacts with Rin fused to the AD. Lig fused to the AD does not interact with Rin fused to the DBD. Lig binds to the fragment Rin1–175 containing the NTF2-like domain but not to the fragment Rin129–492 containing the PxxP motifs. Lig with mutated putative binding sites for Rin (FG repeat mutated to LA repeat; LigFG-LA) does not interact with Rin1–175. (B) A linear protein model of Lig with the predicted UBA domain, the conserved regions (CR2-4) and the FG repeat is presented at the top. Linear protein models of Rin with the NTF2-like domain, the acid-rich region, the PxxP motifs and the RNA-binding motifs (RNA recognition motif (RRM) and arginine-glycine rich region (RRG)) as well as the Rin fragments Rin1–175 and Rin129–492 are presented in the middle. A linear protein model of Lig with mutated FG (LigFG-LA) repeat is presented at the bottom.
Figure 5
Figure 5. Rin cooperates with FMR1 to suppress growth.
(A–C) Scanning electron micrographs of adult control (A), FMR1D113M (B) and rin2 (C) mutant eyes generated by eyFLP/FRT-mediated mitotic recombination. Scale bar represents 100 µm. (D) Statistical analyses as described in Figure 1D: control (724±13 and 766±18*), FMR1D113M (728±19; p = 0.68 and 772±17; p = 0.56) and rin2 (761±13; p = 1.85E-04 and 801±17; p = 2.16E-03). (E–F) FMR1D113M rin2 homozygous animals die in the early pupal stage forming long, slender pupae (F) in comparison to the control (E). Scale bar represents 500 µm. (G–J) Scanning electron micrographs of adult eyes from control (G), FMR1D113M rin2 (H), P{Fmr1.14}; FMR1D113M rin2 (I) and GrinCherry; FMR1D113M rin2 (J) mutant eyes generated by eyFLP/FRT-mediated mitotic recombination. Scale bar represents 100 µm. (K) Statistical analyses as described in Figure 1D: control (746±28 and 766±18*), FMR1D113M rin2 (822±31; p = 4.58E-04 and 815±34; p = 2.79E-03), P{Fmr1.14}; FMR1D113M rin2 (760±20; p = 1.17E-03 and 787±16; p = 4.45E-02) and GrinCherry; FMR1D113M rin2 (760±35; p = 4.94E-03 and 785±33; p = 7.87E-02). * identical control in the second experiment of (D) and (K). (L–O) Scanning electron micrographs of adult control and FMR1D113M rin2 eyes generated by eyFLP/FRT-mediated mitotic recombination from flies grown on 25% (L–M) or 400% (N–O') yeast-containing food. Scale bar represents 100 µm. (P) Statistical analyses as described in Figure 1D: control (744±37 and 755±34) and FMR1D113M rin2 (817±31; p = 3.35E-04 and 828±24; p = 1.07E-04) mutant eyes at 25% yeast-containing food and the control (766±29 and 771±15) and FMR1D113M rin2 (806±41; p = 0.028 and 773±37; p = 0.88) mutant eyes at 400% yeast-containing food. (Q–R) Scanning electron micrographs of adult p35 overexpressing (Q) and FMR1D113M rin2 mutant p35 overexpressing eyes (R) generated by eyFLP, Actin-Flp out-Gal4/FRT-mediated mitotic recombination (Q–R). Scale bar represents 100 µm. (S) The rin locus (drawn to scale) spans 8.2 kbp and consists of three protein-coding exons (red filled boxes). The allele rin2 represents a 13 kbp deficiency uncovering rin, Rbp4 and Hrb87F. The two P-elements P{GawB}rinNP3248 and P{GawB}rinNP5420 are inserted in the 5′ UTR of rin. The genomic rescue construct GrinCherry includes 10.3 kbp. Genotypes: (A, G, L and N) y w eyFLP/y w; FRT82 cl w+/FRT82 (B) y w eyFLP/y w; FRT82 cl w+/FRT82 FMR1D113M (C) y w eyFLP/y w; FRT82 cl w+/FRT82 rin2 (H, M, O and O') y w eyFLP/y w; FRT82 cl w+/FRT82 FMR1D113M rin2 (I) y w eyFLP/y w; P{Fmr1.14} [44E3]/+; FRT82 cl w+/FRT82 FMR1D113M rin2 (J) y w eyFLP/y w; GrinCherry [44F]/+; FRT82 cl w+/FRT82 FMR1D113M rin2 (Q) y w eyFLP, Act>CD2>Gal4/y w; UAS-p35/+; FRT82 cl w+/+ (R) y w eyFLP, Act>CD2>Gal4/y w; UAS-p35/+; FRT82 cl w+/FRT82 FMR1D113M rin2.
Figure 6
Figure 6. Capr cooperates with FMR1 and Rin to suppress growth.
(A–B) Scanning electron micrographs of adult control (A) and Capr2 (B) eyes generated by eyFLP/FRT Minute mediated mitotic recombination from flies reared on 25% yeast food (A–B). Scale bar represents 100 µm. (C) Statistical analyses as described in Figure 1D: control (772±22 and 765±15) and Capr2 (754±18; p = 0.11 and 738±26; p = 0.04) mutant eyes from flies raised on 25% yeast-containing food. (D–K) Scanning electron micrographs of adult control (D), CaprRNAi (E), FMR1D113M (F), CaprRNAi FMR1D113M (G), rin2 (H), CaprRNAi rin2 (I), FMR1D113M rin2 (J) and CaprRNAi FMR1D113M rin2 eyes (K) generated by eyFLP, Actin-Flp out-Gal4/FRT-mediated mitotic recombination from flies grown on 25% yeast-containing food. Scale bar represents 100 µm. (L) Statistical analyses as described in Figure 1D: control (753±28 and 724±31), CaprRNAi expressing (733±34 and 706±28), FMR1D113M mutant (720±18 and 736±19), CaprRNAi expressing FMR1D113M mutant (789±20; p = 1.82E-05 and 787±14; p = 0.00015), rin2 mutant (782±18 and 779±13) and CaprRNAi expressing rin2 mutant (837±52; p = 0.033 and 843±53; p = 0.018) eyes from flies raised on 25% yeast-containing food. Genotypes: (A) y w eyFLP/y w; M(3)RpS174 FRT80/FRT80 (B) y w eyFLP/w; M(3)RpS174 FRT80/Capr2 FRT80 (D) y w eyFLP, Act>CD2>Gal4/y w; FRT82 cl w+/FRT82 (E) y w eyFLP, Act>CD2>Gal4/y w; UAS-CaprRNAi/+; FRT82 cl w+/+ (F) y w eyFLP, Act>CD2>Gal4/y w; FRT82 cl w+/FRT82 FMR1D113M (G) y w eyFLP, Act>CD2>Gal4/y w; UAS-CaprRNAi/+; FRT82 cl w+/FRT82 FMR1D113M (H) y w eyFLP, Act>CD2>Gal4/y w; FRT82 cl w+/FRT82 rin2 (I) y w eyFLP, Act>CD2>Gal4/y w; UAS-CaprRNAi/+; FRT82 cl w+/FRT82 rin2 (J) y w eyFLP, Act>CD2>Gal4/y w; FRT82 cl w+/FRT82 FMR1D113M rin2 (K) y w eyFLP, Act>CD2>Gal4/y w; UAS-CaprRNAi/+; FRT82 cl w+/FRT82 FMR1D113M rin2.
Figure 7
Figure 7. Lig cooperates with FMR1, Rin and Capr in growth control and regulates rin at the transcriptional level.
(A–G) Scanning electron micrographs of adult control (A), ligRNAi II (B), FMR1D113M (C), ligRNAi II FMR1D113M (D), rin2 (E), ligRNAi II rin2 (F) eyes generated by eyFLP Actin-Flp out-Gal4/FRT-mediated mitotic recombination from flies grown at 25% yeast content (A–F). Scale bar represents 100 µm. (G) Statistical analyses as described in Figure 1D: control (714±30 and 720±30), ligRNAi II expressing (738±32 and 706±23), FMR1D113M mutant (737±10 and 729±34), ligRNAi II expressing FMR1D113M mutant (775±36; p = 0.0051 and 806±23; p = 0.00046), rin2 mutant (767±34 and 760±40), ligRNAi II expressing rin2 mutant (821±45; p = 0.03 and 817±69; p = 0.082) eyes from flies raised on 25% yeast-containing food. (H–J) Scanning electron micrographs of adult control (H), ligRNAi II (I) and ligRNAi II Capr2 (J) eyes generated by eyFLP Actin-Flp out-Gal4/FRT Minute-mediated mitotic recombination from flies grown on 25% yeast-containing food. (K–M'') Negatively marked 72 h old lig1 mutant clones (induced with the hsFLP/FRT system) in eye imaginal discs of third instar larvae (K', L' and M'). FMR1 levels (visualized by immunostaining) remain unchanged (K''). Capr levels (visualized by immunostaining) are slightly increased in lig mutant clones (L''). Rin-Cherry levels expressed from the GrinCherry transgene are autonomously decreased in the lig1 mutant clones (M''). Imaginal discs are stained with DAPI (blue) to visualize the DNA. Scale bar represents 25 µm. (N) S2 cells transfected with GFP-Lig and GrinCherry have increased levels of Rin-Cherry in comparison to S2 cells overexpressing GFP and GrinCherry. S2 cells overexpressing GFP-Lig upregulate a transcriptional reporter consisting of the rin promoter followed by a Cherry coding sequence and the 3′ UTR of rin. Conversely, a translational reporter consisting of an ubi promoter followed by the 5′ UTR of rin, a Cherry protein coding sequence and the 3′ UTR of rin is not affected. Genotypes: (A) y w eyFLP, Act>CD2>Gal4/y w; FRT82 cl w+/FRT82 (B) y w eyFLP, Act>CD2>Gal4/y w; UAS-ligRNAi II [51D]/+; FRT82 cl w+/+ (C) y w eyFLP, Act>CD2>Gal4/y w; FRT82 cl w+/FRT82 FMR1D113M (D) y w eyFLP, Act>CD2>Gal4/y w; UAS-ligRNAi II [51D]/+; FRT82 cl w+/FRT82 FMR1D113M (E) y w eyFLP, Act>CD2>Gal4/y w; FRT82 cl w+/FRT82 rin2 (F) y w eyFLP, Act>CD2>Gal4/y w; UAS-ligRNAi II [51D]/+; FRT82 cl w+/FRT82 rin2 (H) y w eyFLP, Act>CD2>Gal4/y w; UAS-CG1315RNAi (control)/+; M(3)RpS174 FRT80/+ (I) y w eyFLP, Act>CD2>Gal4/y w; UAS-ligRNAi II [51D]/+; M(3)RpS174 FRT80/+ (J) y w eyFLP, Act>CD2>Gal4/y w; UAS-ligRNAi II [51D]/+; M(3)RpS174 FRT80/Capr2 FRT80 (K, L) y w hsFLP/y w; FRT42 ubiGFP/FRT42 lig1 (M) y w hsFLP/y w; FRT42 ubiGFP/FRT42 lig1; GrinCherry [86Fb]/+.
Figure 8
Figure 8. JAK/STAT signaling is activated in lig mutant cells.
(A–C) lig1 mutant clones (induced with the FLP/FRT system, 72 h old, marked by the lack of lacZ staining) in eye (A and A''), antenna (B and B'') and wing (C and C'') imaginal discs of early third instar larvae. The JAK/STAT signaling reporter 10xSTAT92E-GFP is upregulated in lig1 mutant clones in the posterior side of the eye imaginal disc (A' and A''), antenna imaginal disc (B' and B'') and in the hinge region of the wing disc (C' and C''). Note that the reporter signal is autonomously increased in the mutant clones. Scale bars represent 50 µm. (D) Schematic representation of the interactions shown in this study (left) and a working model of a Lig/Rin/FMR1/Caprin complex (right). Genotypes: (A–C) y w hsFLP/y w; FRT42 arm-lacZ/FRT42 lig1; 10xSTAT92E-GFP/+.

References

    1. Tumaneng K, Russell RC, Guan K-L (2012) Organ size control by Hippo and TOR pathways. Curr Biol 22: R368–R379. - PMC - PubMed
    1. Luo Y, Shan G, Guo W, Smrt RD, Johnson EB, et al. (2010) Fragile X mental retardation protein regulates proliferation and differentiation of adult neural stem/progenitor cells. PLoS Genet 6: e1000898. - PMC - PubMed
    1. Lypowy J, Chen I-Y, Abdellatif M (2005) An alliance between Ras GTPase-activating protein, filamin C, and Ras GTPase-activating protein SH3 domain-binding protein regulates myocyte growth. J Biol Chem 280: 25717–25728. - PubMed
    1. Solomon S, Xu Y, Wang B, David MD, Schubert P, et al. (2007) Distinct structural features of caprin-1 mediate its interaction with G3BP-1 and its induction of phosphorylation of eukaryotic translation initiation factor 2alpha, entry to cytoplasmic stress granules, and selective interaction with a subset of mRNAs. Mol Cell Biol 27: 2324–2342. - PMC - PubMed
    1. Bikkavilli RK, Malbon CC (2011) Arginine methylation of G3BP1 in response to Wnt3a regulates β-catenin mRNA. J Cell Sci 124: 2310–2320. - PMC - PubMed

Publication types

MeSH terms