. 2013 Jul 11:7:117.
doi: 10.3389/fncir.2013.00117. eCollection 2013.

Tonotopic organization of the hyperpolarization-activated current (Ih) in the mammalian medial superior olive

Affiliations

Tonotopic organization of the hyperpolarization-activated current (Ih) in the mammalian medial superior olive

Veronika J Baumann et al. Front Neural Circuits. .

Abstract

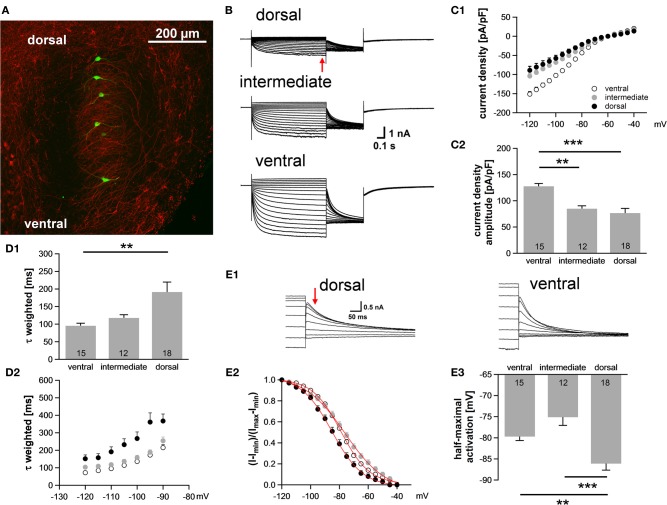
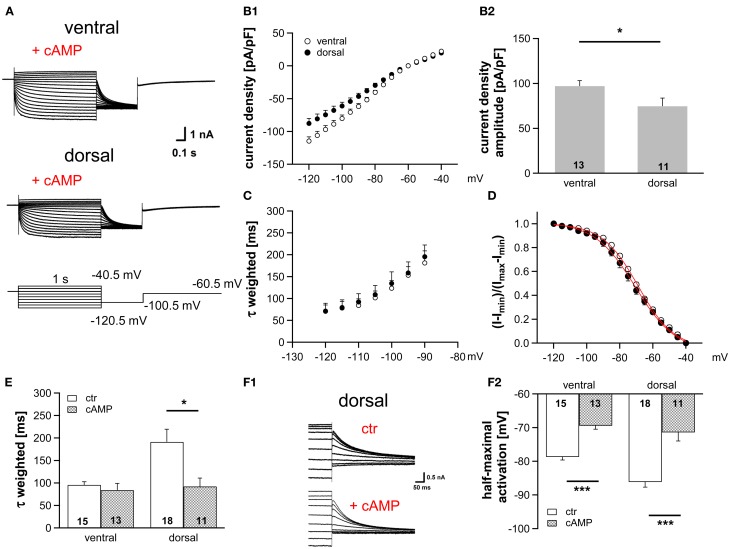
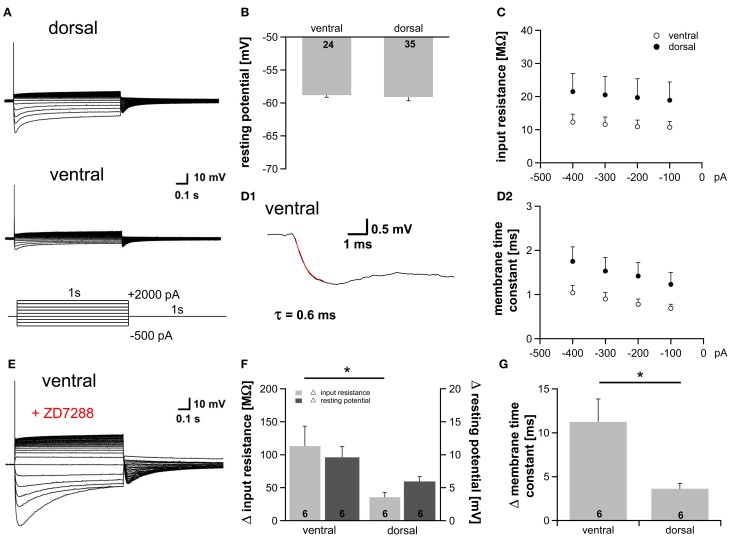
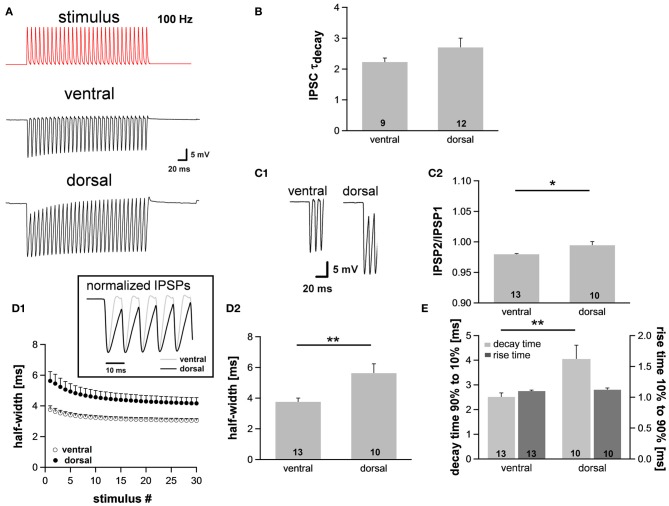
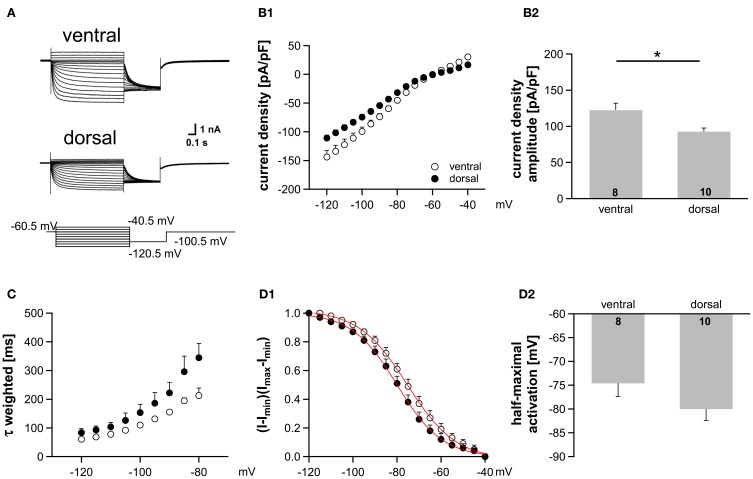
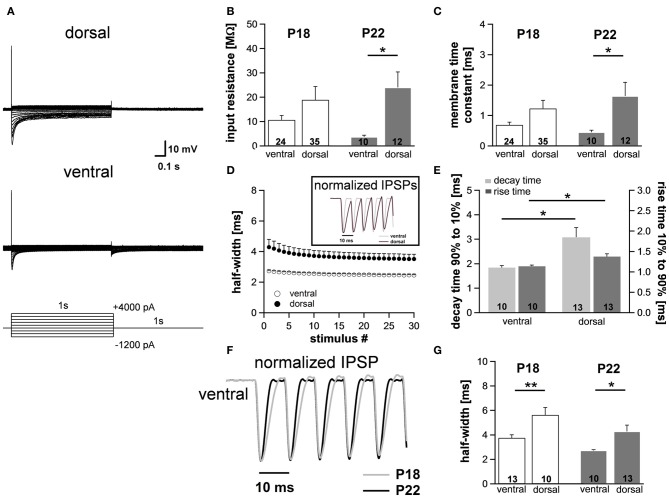
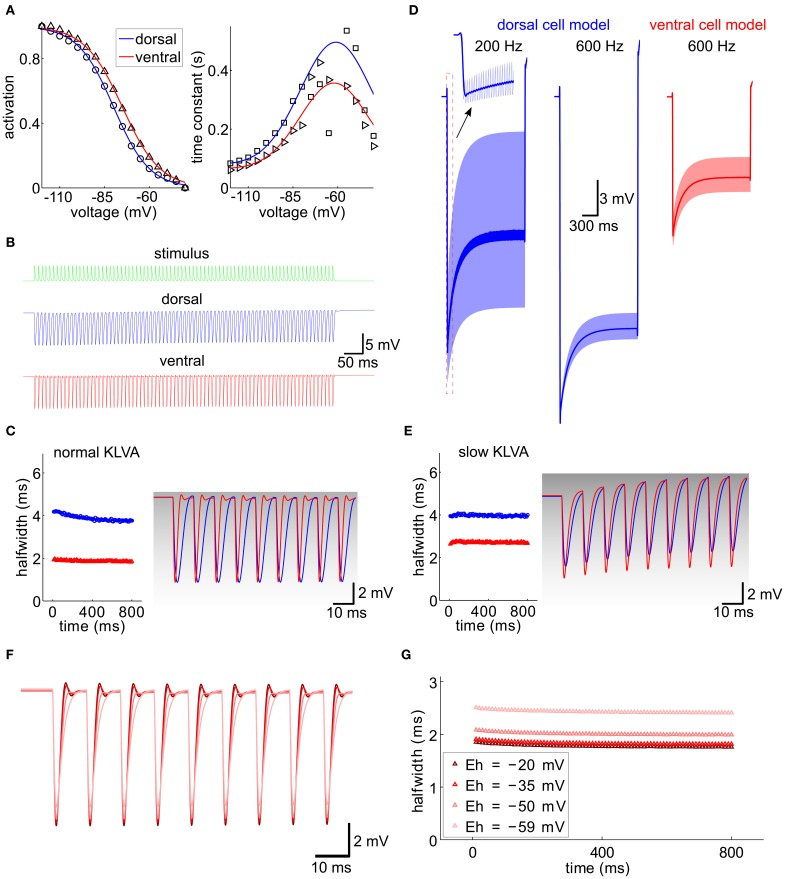
Neuronal membrane properties can largely vary even within distinct morphological cell classes. The mechanisms and functional consequences of this diversity, however, are little explored. In the medial superior olive (MSO), a brainstem nucleus that performs binaural coincidence detection, membrane properties at rest are largely governed by the hyperpolarization-activated inward current (Ih) which enables the temporally precise integration of excitatory and inhibitory inputs. Here, we report that Ih density varies along the putative tonotopic axis of the MSO with Ih being largest in ventral, high-frequency (HF) processing neurons. Also Ih half-maximal activation voltage and time constant are differentially distributed such that Ih of the putative HF processing neurons activate faster and at more depolarized levels. Intracellular application of saturating concentrations of cyclic AMP removed the regional difference in hyperpolarization-activated cyclic nucleotide gated (HCN) channel activation, but not Ih density. Experimental data in conjunction with a computational model suggest that increased Ih levels are helpful in counteracting temporal summation of phase-locked inhibitory inputs which is particularly prominent in HF neurons.

Keywords: HCN channel; coincidence detection; medial superior olive; sound localization; tonotopy.


Figures

Figure 1
Figure 1
Ih varies systematically along the dorsoventral axis. (A) A brain slice containing the MSO with Alexa-488-filled neurons (green) verifies the distribution of the patched neurons along the dorsoventral axis (red: MAP-2). (B) Pharmacologically isolated Ih current traces were elicited by depolarizing and hyperpolarizing voltage steps from −60.5 mV to potentials between −40.5 mV and −120.5 mV for 1 s in 5 mV step increment and then to −100.5 mV for 0.5 s to elicit the tail current to determine the voltage dependence of Ih activation. Current traces are representative for the dorsal, the intermediate and the ventral part of the MSO. (C) I-V relationships of steady-state (red arrow in B) Ih density for ventral (n = 15), intermediate (n = 12) and dorsal (n = 18) neurons emphasize that Ih density amplitudes are smallest in dorsal neurons and largest in ventral neurons (C1). Ih density amplitudes for a voltage step to −110.5 mV (C2). (D) Weighted activation time constants at −110.5 mV (D1). The weighted activation time constants are voltage dependent and largest in the dorsal part of the MSO (D2). (E) The voltage-dependence of Ih activation was measured from the tail current 20 ms after the end of the voltage steps (red arrow) (E1). Values were fitted with a Boltzmann function to obtain the half-maximal activation voltage. In dorsal neurons the Ih activation curve is shifted to more negative voltages (E2). Half-maximal activation voltage was measured in each experiment and averaged (E3). Black symbols: dorsal neurons; gray symbols: intermediate neurons; white symbols: ventral neurons. **P < 0.01, ***P < 0.001, single-factor ANOVA test followed by a Scheffe's post-hoc test.
Figure 2
Figure 2
Modulation of Ih by cAMP differs along the dorsoventral axis. (A) Current responses to depolarizing and hyperpolarizing voltage steps were recorded from MSO neurons in the ventral and dorsal part of the MSO with 25 μM cAMP in the pipette solution. (B) Ih density gradient persists in the presence of cAMP as illustrated by the current-voltage relationships for ventral (n = 13) and dorsal (n = 11) neurons (B1) and their Ih density amplitudes for a −110.5 mV voltage step (B2). (C) The weighted activation time constants and (D), the voltage dependence of Ih activation overlap in the presence of cAMP. Comparison of (E) the weighted activation time constants and (F) the half-maximal activation voltages in the absence and presence of 25 μM cAMP reveals that dorsal neurons are more sensitive to cAMP than ventral neurons (F2). (F1) In the upper panel, tail currents were elicited using standard pipette solution. In the lower panel, a different, dorsal neuron is illustrated using standard pipette solution supplemented with 25 μM cAMP. Black symbols: dorsal neurons; white symbols: ventral neurons. *P < 0.05, ***P < 0.001, two-tailed, unpaired t-test.
Figure 3
Figure 3
Gradient of Ih affects membrane properties. (A) MSO neurons in the dorsal and in the ventral part of the MSO fire a single spike at the onset of depolarizing current injections and exhibit a voltage sag during hyperpolarizing current steps. (B) Resting membrane potential, (C) peak input resistance, and (D) membrane time constant are not significantly different between ventral (n = 18) and dorsal (n = 25) neurons (D2). The membrane time constant was fitted by a single-exponential function as shown in (D1). (E) Blocking Ih with 20 μM ZD7288, a specific Ih blocker, hyperpolarizes the cell, increases the input resistance and the membrane time constant. Same ventral neuron as in (A) but after treatment with 20 μM ZD7288. The differences in (F) the input resistance (light-gray bars), the resting potential (dark-gray bars) and (G) the membrane time constant before and after application of 20 μM ZD7288 varies between ventral and dorsal neurons. The effects are more pronounced in ventral neurons. Black symbols: dorsal neurons; white symbols: ventral neurons. *P < 0.05, two-tailed unpaired t-test.
Figure 4
Figure 4
The integration of synaptic inputs varies along the dorsoventral axis. (A) Representative voltage traces to simulated IPSC trains (100 Hz). (B) The time course of IPSCs does not vary along the dorsoventral axis as indicated by the decay time. IPSCs were evoked by stimulating the slice medial or lateral the MSO with a stimulation electrode. (C) Dorsal neurons exhibit the largest IPSP amplitude (C1), and IPSP summation is increased in dorsal neurons (C2). (D) IPSP time course changes along the dorsoventral axis as depicted in the inset. The half-width of IPSPs is largest in dorsal neurons and the time course accelerates during stimulation with IPSC trains (D1). Half-width for the first IPSP (D2). (E) There is no difference between the rise times (10–90%) of the first IPSP (dark-gray bars) but the mean values for the decay time (90–10%) of the last IPSP (light-gray bars) are larger in dorsal neurons compared to ventral neurons. Black symbols: dorsal neurons; white symbols: ventral neurons. *P < 0.05, **P < 0.01, two-tailed paired or unpaired t-test, as appropriate.
Figure 5
Figure 5
Ih gradient persists in more mature animals (P22). (A) Pharmacologically isolated Ih current traces were elicited by depolarizing and hyperpolarizing voltage steps from −60.5 mV to potentials between −40.5 mV and −120.5 mV (5 mV step increment). Current traces are representative for the dorsal and the ventral part of the MSO. (B) I-V relationships of steady-state Ih density for ventral (n = 8) and dorsal (n = 10) neurons emphasize that Ih density amplitudes are smallest in dorsal neurons and largest in ventral neurons (B1). Ih density amplitudes for a voltage step to −110.5 mV (B2). (C) The weighted activation time constants are voltage dependent and largest in the dorsal part of the MSO. (D) The voltage-dependence of Ih activation was measured from the tail current. In dorsal neurons the Ih activation curve is shifted to more negative voltages (D1). Half-maximal activation voltage was measured in each experiment and averaged (D2). Black symbols: dorsal neurons; white symbols: ventral neurons. *P < 0.05, two-tailed unpaired t-test.
Figure 6
Figure 6
Differences in membrane properties are more evident in mature animals. (A) MSO neurons in the dorsal and in the ventral part of the MSO fire a single spike at the onset of depolarizing current injections and exhibit a voltage sag during hyperpolarizing current steps. In particular, in ventral neurons the voltage sag only is obvious for strong hyperpolarizing current injections due to the large resting conductance of Ih. (B) Peak input resistance and (C) membrane time constant vary significantly between ventral (n = 10) and dorsal (n = 12) neurons. Differences in the input resistance and in the membrane time constant between ventral and dorsal neurons are significantly larger in P22 animals compared with P18 animals. (D) IPSP time course changes along the dorsoventral axis as depicted in the inset. The half-width of IPSPs is largest in dorsal neurons and the time course accelerates during stimulation with IPSC trains. (E) The mean values for the rise time (10–90%) of the first IPSP (dark-gray bars) and the decay time (90–10%) of the last IPSP (light-gray bars) are larger in dorsal neurons compared to ventral neurons. (F) IPSP time course is accelerated in P22 compared to P18. Representative normalized IPSP trains for the ventral part of the MSO. (G) Half-widths for the first IPSPs are decreased for P22 in both the ventral and the dorsal part of the MSO. Black symbols: dorsal neurons; white symbols: ventral neurons. *P < 0.05, **P < 0.01, two-tailed unpaired t-test.
Figure 7
Figure 7
Integration of IPSG trains, computational model. (A) Activation curve and time constant of Ih from Figure 5 (symbols) were fitted for the ventral and dorsal population (solid lines). (B) A 100 Hz IPSG train (green) was applied to the cell models representative for the dorsal (blue) and ventral (red) population (see Materials and Methods). The individual inhibitory conductance was set to 20.5 nS and 90 nS for the dorsal and for the ventral cell models to obtain similar voltage amplitudes. (C) Half-width of the resulting IPSPs from (B). The first nine IPSPs were magnified on the right and overlaid with the respective KLVA steady-state activation (gray levels). (D) Voltage responses (light colors) for different stimulus frequencies (as indicated) and model cells (colors). The dark traces were generated by low-pass filtering the voltage trace with a second-order Butterworth low-pass filter with cut-off frequency of 100 Hz. (E) Same as (C) for a KLVA model with 100-fold slowed down activation and inactivation time constants. Conductances for Ih and IK-LVA were adjusted to match the input resistances and equilibrium potential of the cells in (C). (F) IPSP trains for different reversal potentials of Ih (color code see G). (G) Half-widths of the IPSP trains from (F).

References

    1. Adam T. J., Finlayson P. G., Schwarz D. W. F. (2001). Membrane properties of principal neurons of the lateral superior olive. J. Neurophysiol. 86, 922–934 - PubMed
    1. Barnes-Davies M., Barker M. C., Osmani F., Forsythe I. D. (2004). Kv1 currents mediate a gradient of principal neuron excitability across the tonotopic axis in the rat lateral superior olive. Eur. J. Neurosci. 19, 325–333 10.1111/j.0953816X.2003.03133.x - DOI - PubMed
    1. Brand A., Behrend O., Marquardt T., McAlpine D., Grothe B. (2002). Precise inhibition is essential for microsecond interaural time difference coding. Nature 417, 543–547 10.1038/417543a - DOI - PubMed
    1. Brandt M. C., Endres-Becker J., Zagidullin N., Motloch L. J., Er F., Rottlaender D., et al. (2009). Effects of KCNE2 on HCN isoforms: distinct modulation of membrane expression and single channel properties. Am. J. Physiol. Heart Circ. Physiol. 297, H355–H363 10.1152/ajpheart.00154.2009 - DOI - PubMed
    1. Couchman K., Grothe B., Felmy F. (2010). Medial superior olivary neurons receive surprisingly few excitatory and inhibitory inputs with balanced strength and short-term dynamics. J. Neurosci. 30, 17111–17121 10.1523/JNEUROSCI.1760-10.2010 - DOI - PMC - PubMed

Publication types

MeSH terms

Substances