. 2013 Jul 17;8(7):e66629.
doi: 10.1371/journal.pone.0066629. Print 2013.

LifeMap Discovery™: the embryonic development, stem cells, and regenerative medicine research portal

Affiliations

LifeMap Discovery™: the embryonic development, stem cells, and regenerative medicine research portal

Ron Edgar et al. PLoS One. .

Abstract

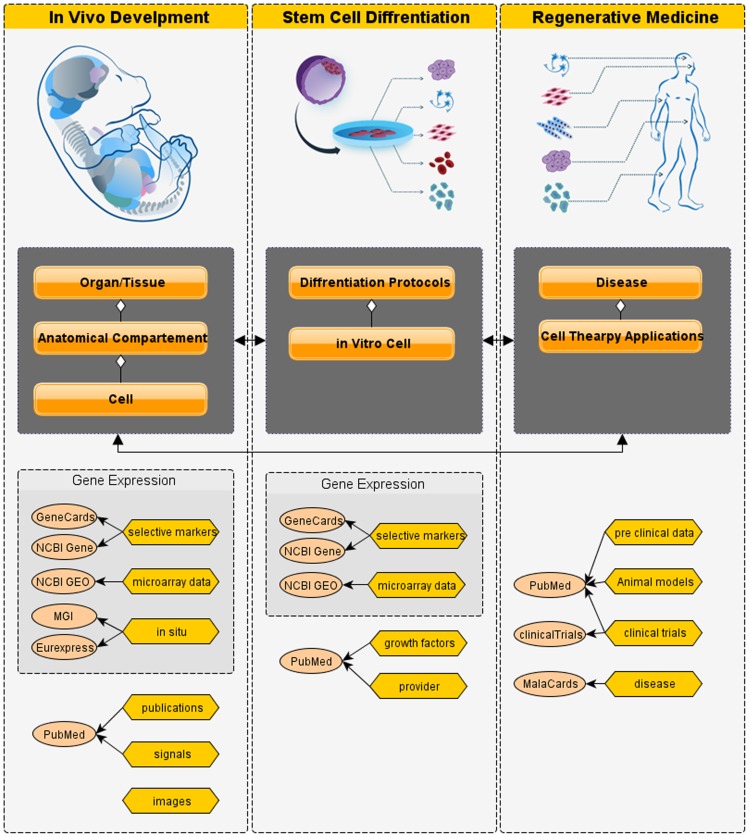
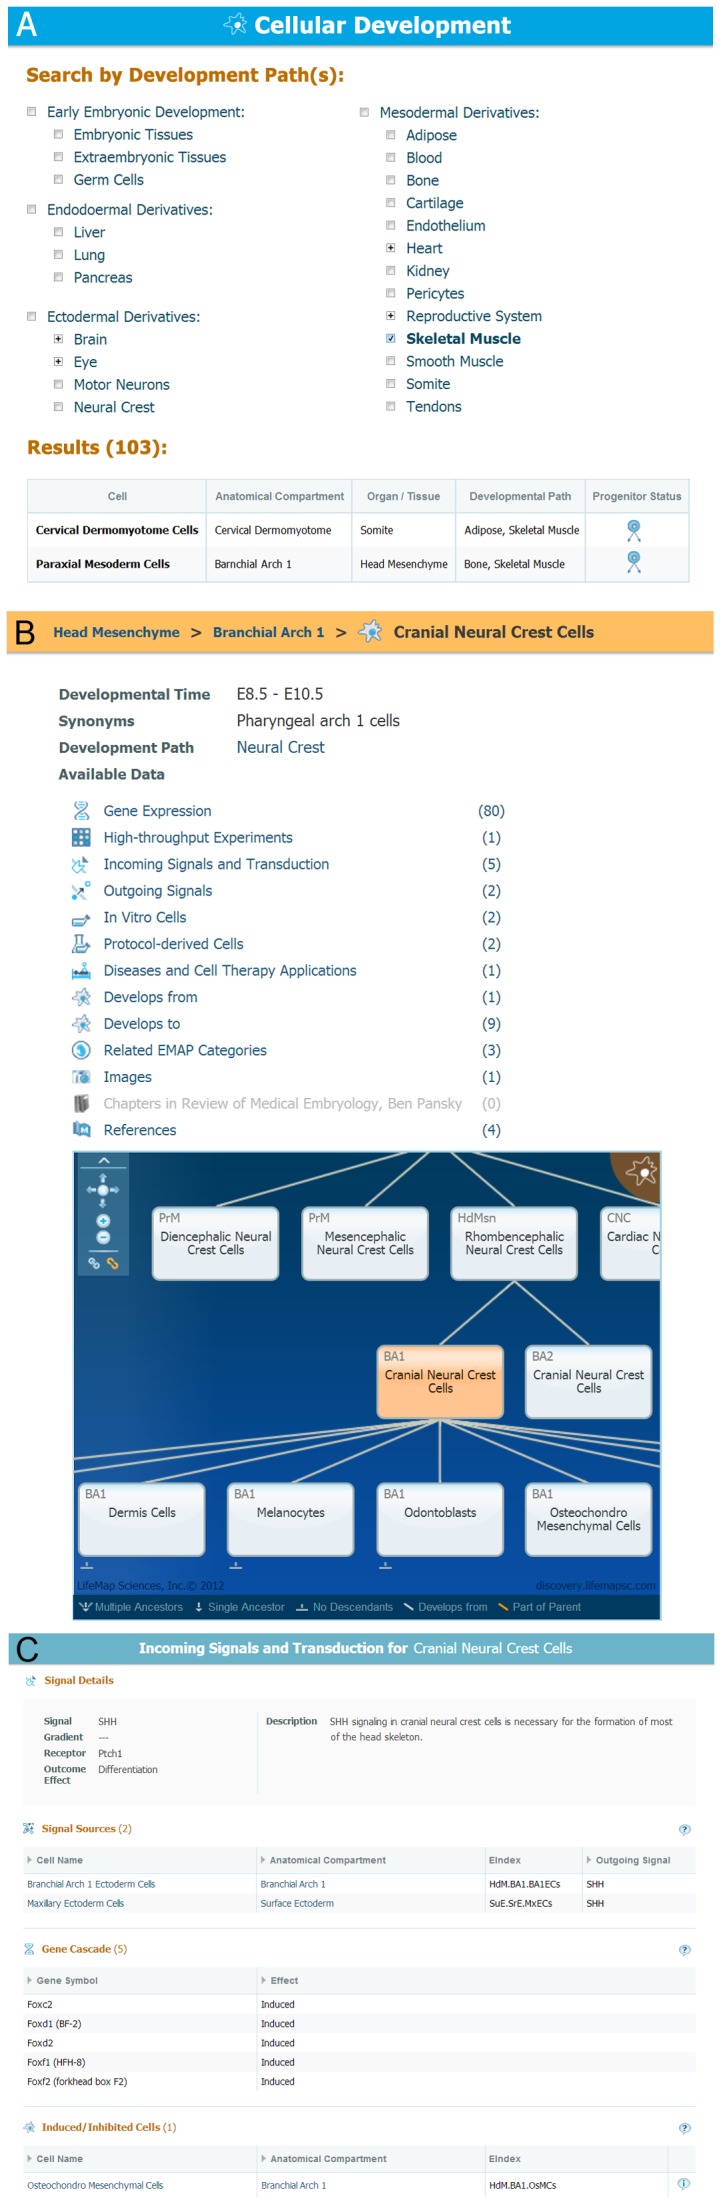
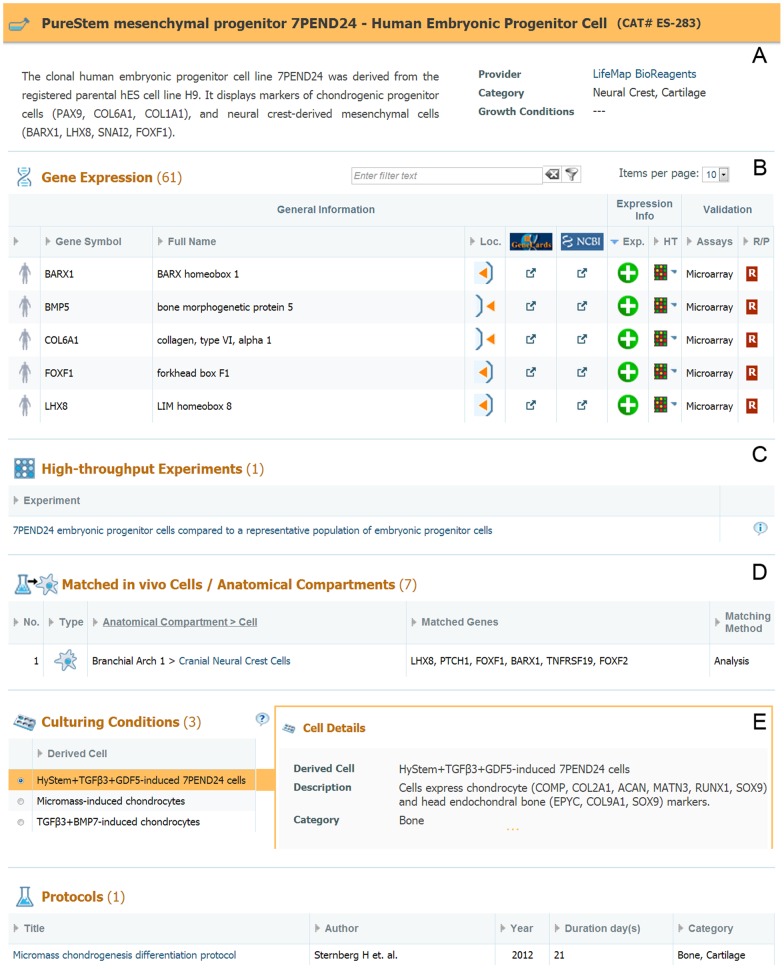
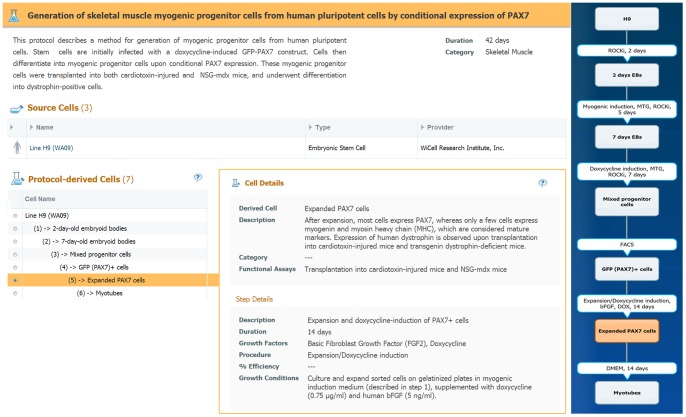
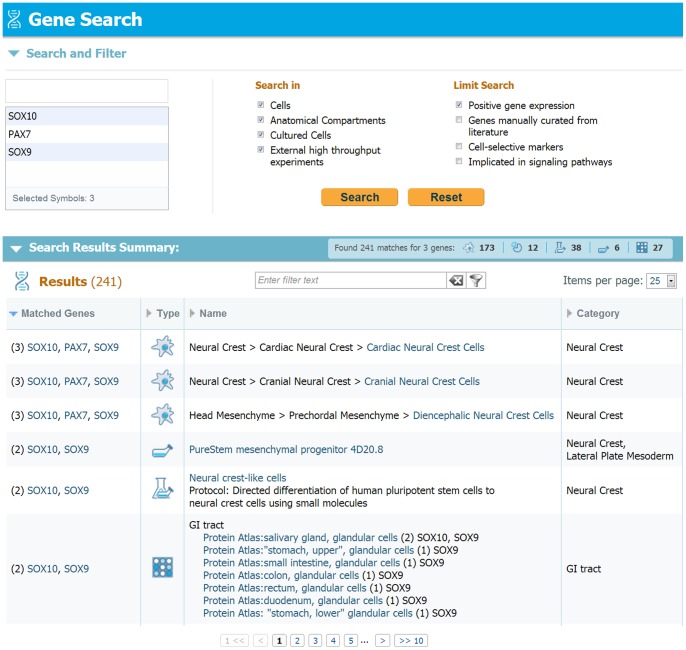
LifeMap Discovery™ provides investigators with an integrated database of embryonic development, stem cell biology and regenerative medicine. The hand-curated reconstruction of cell ontology with stem cell biology; including molecular, cellular, anatomical and disease-related information, provides efficient and easy-to-use, searchable research tools. The database collates in vivo and in vitro gene expression and guides translation from in vitro data to the clinical utility, and thus can be utilized as a powerful tool for research and discovery in stem cell biology, developmental biology, disease mechanisms and therapeutic discovery. LifeMap Discovery is freely available to academic nonprofit institutions at http://discovery.lifemapsc.com.


Conflict of interest statement

Competing Interests: The authors have read the journal's policy and have the following conflicts: co-authors Ron Edgar, Yaron Mazor, Ariel Rinon, Jacob Blumenthal, Ella Buzhor, Idit Livnat, Shani Ben-Ari, Iris Lieder, Alina Shitrit, Yaron Gilboa, Ahmi Ben-Yehuda, Osnat Edri, Netta Shraga, Yoel Bogoch, Lucy Leshansky, Shlomi Aharoni, David Warshawsky and Ronit Shtrichman are affiliated with LifeMap LTD/Tel Aviv. Co-authors Michael D West, Yaron Golan and David Warshawsky are affiliated with LifeMap Sciences Inc, Alameda CA. Co-author Michael D West is affiliated by BioTime Inc. LifeMap Sciences is a subsidiary of BioTime, Inc. LifeMap Discovery is a database and portal that has been developed by LifeMap Sciences. MD West and D Warshawsky are board members of LifeMap Sciences LTD Inc; MD West, Y Golan and D Warshawsky own shares of LifeMap Sciences Inc and BioTime Inc. MD West is a board member for BioTime Inc. All authors are or were paid employees or consultants of these companies, and hold stock options in LifeMap Inc. There are no patents, products in development or marketed products to declare. This does not alter the authors' adherence to all the PLoS ONE policies on sharing data and materials.

Figures

Figure 1
Figure 1. Database Structure.
(A) The Discovery database contains three main components, (i) In vivo development, (ii) Stem cell Differentiation, and (iii) Regenerative Medicine. (B) Sections within each main component (e.g. the In Vivo Development component is made up of cells contained in anatomical compartments that in turn are contained in organs/tissues. The sections are connected by reciprocal links (black arrows). (C) Within each database component, main data categories and their main source of references are listed, e.g. inside Stem Cell Differentiation, growth factors are listed and linked to PubMed citations.
Figure 2
Figure 2. The Developmental Ontology Tree.
An interactive viewer available at the organ/tissue level. The ontology tree presents a low-resolution overview of organ/tissue development, and facilitates navigation by clickable entities that open the related card. The lower image shows the full ontology tree starting from the zygote, through the three germ layers; ectoderm, mesoderm and endoderm and to their derived organs and tissues. The upper image is an enlargement showing the contribution of the neural crest to the development of multiple tissues such as bone, cartilage and skeletal muscle as it is displayed in the database.
Figure 3
Figure 3. Assignment of Embryonic Index (EIndex).
Entities in each embryonic level are assigned a local index, e.g. the Head Mesenchyme local index is HdM, and one of its anatomical compartments, Branchial Arch 1 local index is BA1. The full Embryonic index for Branchial Arch 1 is hence HdM.BA1. Similarly, Paraxial Mesoderm Cells contained in the Branchial Arch 1 are given a local index PMCs and a fully qualified EIndex of HdM.BA1.PMCs.
Figure 4
Figure 4. Branchial Arch 1 (HdM.BA1) anatomical compartment development card.
A. Anatomical compartment viewer demonstrating the contribution of ‘Head Mesoderm’ and ‘Cranial Neural Crest’ to the developing ‘Head Mesenchyme’, which give rise to Branchial Arch 1 and its functional derivatives (i.e., cartilage, bone and skeletal muscles), is depicted in this viewer (highlighted, orange colored boxes). B. Illustration showing the embryonic ontology and development of the two main cellular components (i.e., paraxial mesoderm and neural crest cells) which give rise to skeletal elements of the head (lateral view). Such anatomical illustrations are available in the database at the organ/tissue and anatomical compartment cards C. Examples of the display of selective gene markers of cells populating the anatomical compartment. Here the selective genes of CNC cells and Paraxial Mesoderm cells are shown in the BA1 anatomical compartment card. Abbreviations: mb, midbrain; fb, forebrain;r1–7, rhombomeres 1–7; HdM.BA1–4, branchial arch 1–4; OV, optic vesicle.
Figure 5
Figure 5. Cellular Development level and Cell Card Representation.
This figure demonstrates some of the comprehensive data provided for a single cell in the database. A. The cellular filter list, available at LifeMap Discovery, showing all available cellular developmental paths currently available in the database. This example demonstrates results from search of skeletal muscle-related cells; two selected cells with their developmental path annotation (e.g., Skeletal Muscle) are shown for simplification. B. ‘Cranial Neural Crest Cell’ (CNCCs) card shows the available information (e.g., gene expression) for these cells, accompanied by the interactive clickable graphical development viewer on the right. C. An example for a specific signal display- with a description (SHH), signal source, associated gene cascade and biological cellular outcome.
Figure 6
Figure 6. 7PEND24 PureStem Progenitor Cell Card.
A. Cell description and available data summary. B. Gene expression list including expression pattern, assay type and links to external resources. C. Links to cell-related high-throughput experiments, available in the database. D. List of in vivo cells or anatomical compartments that were matched to the PureStem progenitor and the related genes for each match. E. List of culturing conditions and protocols related to the PureStem progenitor cell.
Figure 7
Figure 7. Differentiation Protocol Card.
Synopsis of the protocol, including duration, a summary of available data (not shown in figure), and an interactive viewer (right hand side) showing the protocol flow and its differentiation steps. Information about the in vitro cells that are used as source cells for the protocol is presented below the protocol title. The list of the protocol derived cells (PDCs) are shown on the left, ordered by the protocol steps. For a selected PDC (highlighted in the diagram), a description for the cell and step details are available, including list of growth factors used, step procedure, duration and functional assay, if available.
Figure 8:
Figure 8:. Gene search display.
Demonstration of a gene search in LifeMap Discovery. Genes of interest are selected and the search can be limited and filtered by several criteria, e.g. the card type and the gene expression pattern. Following query submission, a results summary table is shown, indicating the number of results for each card type (cells, compartments and organ/tissue cards). The results list presents the name and number of genes found in each card, as well as the link to card itself.

References

    1. West MD, Mason C (2007) Mapping the human embryome: 1 to 10e13 and all the cells in between. Regen Med 2: 329–333. - PubMed
    1. Bonfanti P, Barrandon Y, Cossu G (2012) ‘Hearts and bones’: the ups and downs of ‘plasticity’ in stem cell biology. EMBO Mol Med 4: 353–361. - PMC - PubMed
    1. Geffers L, Herrmann B, Eichele G (2012) Web-based digital gene expression atlases for the mouse. Mamm Genome 23: 525–538. - PubMed
    1. Hatano A, Chiba H, Moesa HA, Taniguchi T, Nagaie S, et al. (2011) CELLPEDIA: a repository for human cell information for cell studies and differentiation analyses. Database (Oxford) 2011: bar046. - PMC - PubMed
    1. Hackney JA, Moore KA (2005) A functional genomics approach to hematopoietic stem cell regulation. Methods Mol Med 105: 439–452. - PubMed