

SMETANA: accurate and scalable algorithm for probabilistic alignment of large-scale biological networks
- PMID: 23874484
- PMCID: PMC3710069
- DOI: 10.1371/journal.pone.0067995
SMETANA: accurate and scalable algorithm for probabilistic alignment of large-scale biological networks
Abstract
In this paper we introduce an efficient algorithm for alignment of multiple large-scale biological networks. In this scheme, we first compute a probabilistic similarity measure between nodes that belong to different networks using a semi-Markov random walk model. The estimated probabilities are further enhanced by incorporating the local and the cross-species network similarity information through the use of two different types of probabilistic consistency transformations. The transformed alignment probabilities are used to predict the alignment of multiple networks based on a greedy approach. We demonstrate that the proposed algorithm, called SMETANA, outperforms many state-of-the-art network alignment techniques, in terms of computational efficiency, alignment accuracy, and scalability. Our experiments show that SMETANA can easily align tens of genome-scale networks with thousands of nodes on a personal computer without any difficulty. The source code of SMETANA is available upon request. The source code of SMETANA can be downloaded from http://www.ece.tamu.edu/~bjyoon/SMETANA/.
Conflict of interest statement
Figures
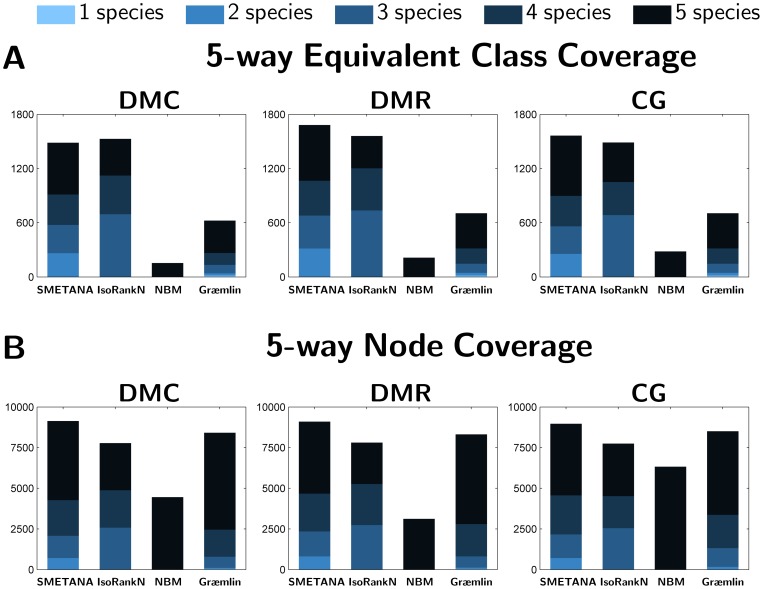
 species (
 ). (B) Node Coverage: Number of nodes (i.e. proteins) that belong to equivalence classes that contain nodes from
  species in the 5-way alignment.
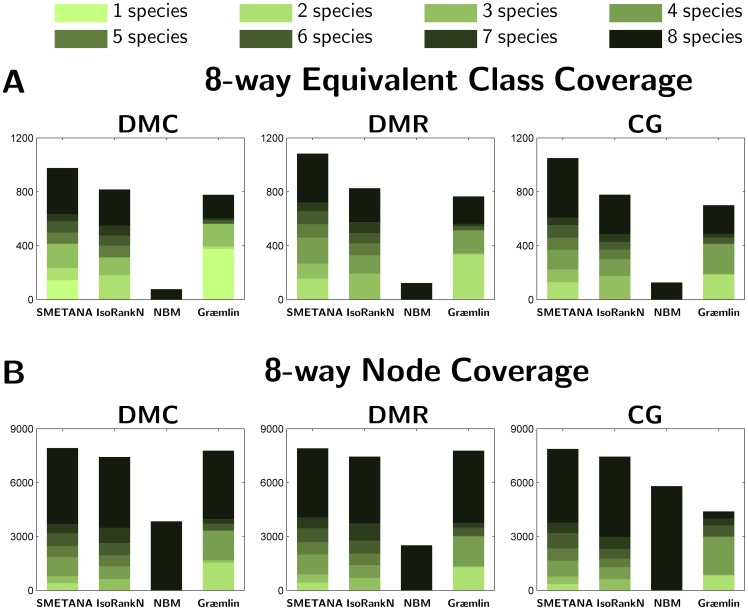
 species (
 ). (B) Node Coverage: Number of nodes (i.e. proteins) that belong to equivalence classes that contain nodes from
  species in the 8-way alignment.
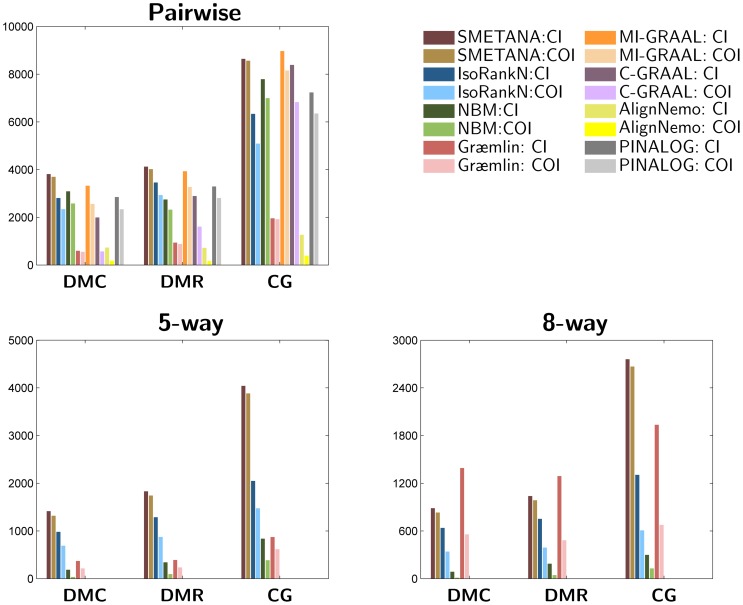

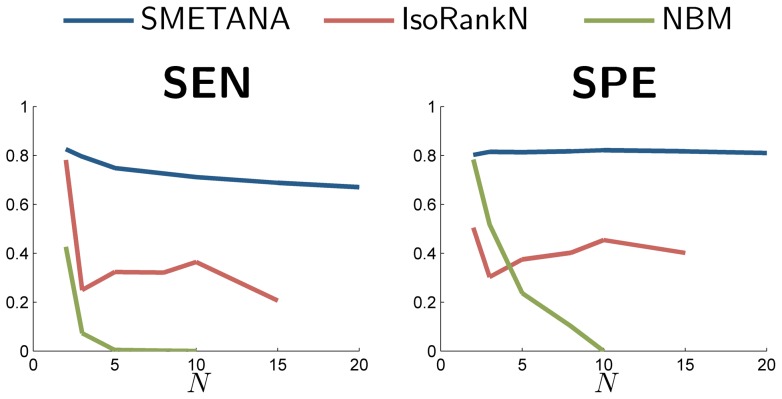
 increases the separation between the two score distributions, which increases the discriminative power of the node similarity score for predicting potential orthologs. Measures reported: specificity (SPE), number of correct nodes (CN) (which reflects the sensitivity), mean normalized entropy (MNE), number of conserved interactions (CI), number of conserved orthologous interactions (COI).
References
-
- Zhang A (2009) Protein Interaction Networks: Computational Analysis. New York, NY, USA: Cambridge University Press, 1st edition.
-
- Barabasi AL, Oltvai ZN (2004) Network biology: understanding the cell's functional organization. Nat Rev Genet 5: 101–113. - PubMed
-
- Cusick ME, Klitgord N, Vidal M, Hill DE (2005) Interactome: gateway into systems biology. Hum Mol Genet 14 Spec No. 2: R171–181. - PubMed
-
- Uetz P, Giot L, Cagney G, Mansfield TA, Judson RS, et al. (2000) A comprehensive analysis of protein-protein interactions in Saccharomyces cerevisiae. Nature 403: 623–627. - PubMed
-
- Ho Y, Gruhler A, Heilbut A, Bader GD, Moore L, et al. (2002) Systematic identification of protein complexes in Saccharomyces cerevisiae by mass spectrometry. Nature 415: 180–183. - PubMed
Publication types
MeSH terms
LinkOut - more resources
Full Text Sources
Other Literature Sources
