. 2013 Jul 9;8(7):e68076.
doi: 10.1371/journal.pone.0068076. Print 2013.

Inhibition of dual/mixed tropic HIV-1 isolates by CCR5-inhibitors in primary lymphocytes and macrophages

Affiliations

Inhibition of dual/mixed tropic HIV-1 isolates by CCR5-inhibitors in primary lymphocytes and macrophages

Matteo Surdo et al. PLoS One. .

Abstract

Background: Dual/mixed-tropic HIV-1 strains are predominant in a significant proportion of patients, though little information is available regarding their replication-capacity and susceptibility against CCR5-antagonists in-vitro. The aim of the study was to analyze the replication-capacity and susceptibility to maraviroc of HIV-1 clinical isolates with different tropism characteristics in primary monocyte-derived-macrophages (MDM), peripheral-blood-mononuclear-cells (PBMC), and CD4(+) T-lymphocytes.

Methods: Twenty-three HIV-1 isolates were phenotipically and genotipically characterized as R5, X4 or dual (discriminated as R5(+)/X4, R5/X4, R5/X4(+)). Phenotypic-tropism was evaluated by multiple-cycles-assay on U87MG-CD4(+)-CCR5(+)-/CXCR4(+)-expressing cells. Genotypic-tropism prediction was obtained using Geno2Pheno-algorithm (false-positive-rate [FPR] = 10%). Replication-capacity and susceptibility to maraviroc were investigated in human-primary MDM, PBMC and CD4(+) T-cells. AMD3100 was used as CXCR4-inhibitor. Infectivity of R5/Dual/X4-viruses in presence/absence of maraviroc was assessed also by total HIV-DNA, quantified by real-time polymerase-chain-reaction.

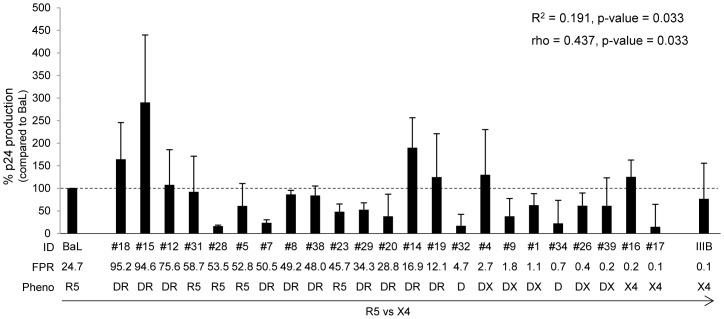
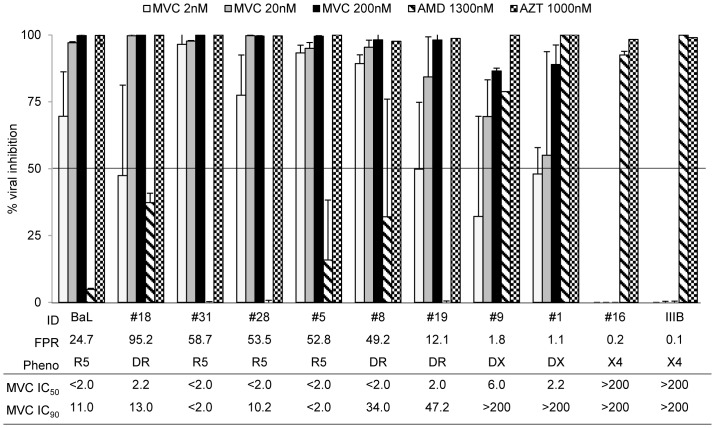
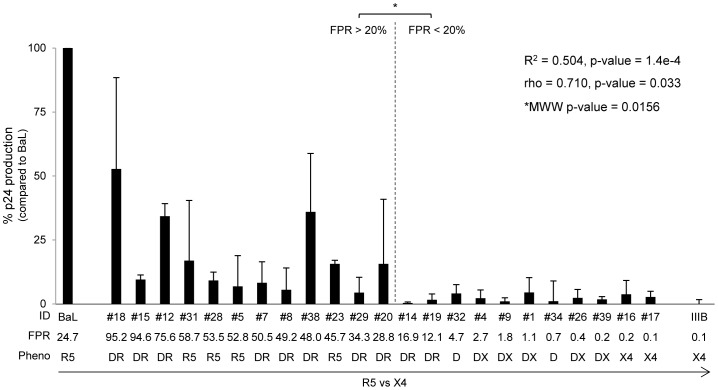
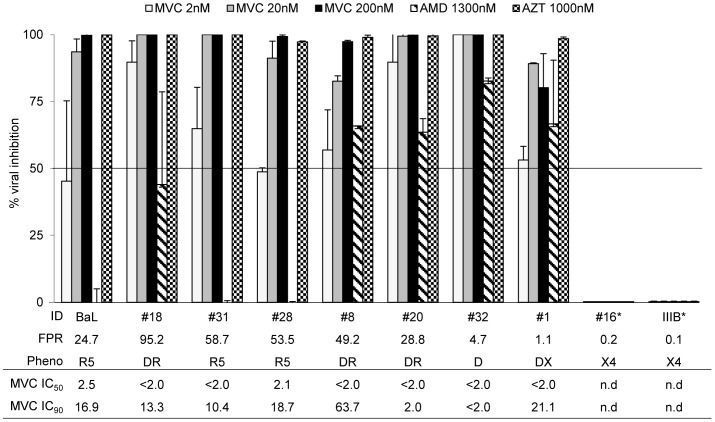
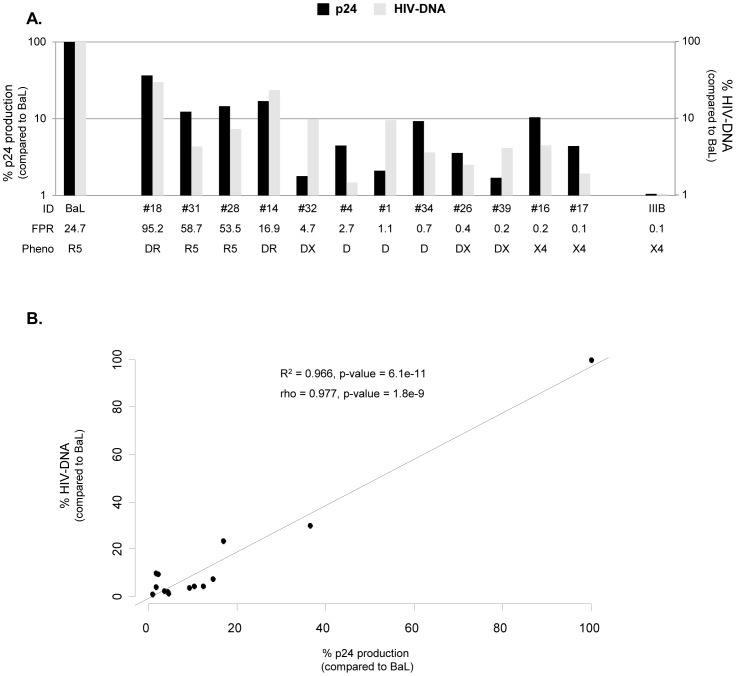
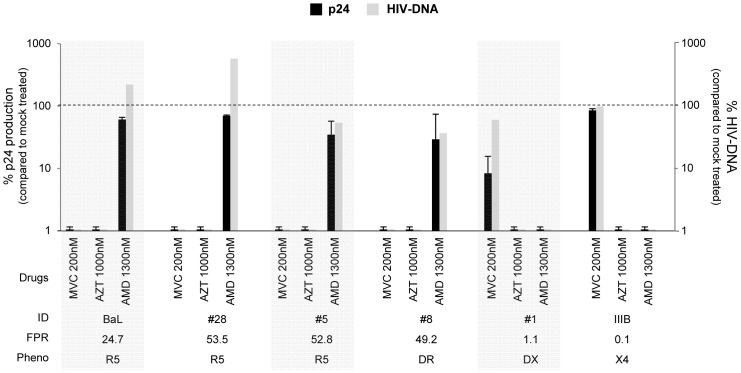
Results: Among 23 HIV-1 clinical isolates, phenotypic-tropism-assay distinguished 4, 17 and 2 viruses with R5-tropic, dual/mixed-, and X4-tropic characteristics, respectively. Overall, viruses defined as R5(+)/X4-tropic were found with the highest prevalence (10/23, 43.5%). The majority of isolates efficiently replicated in both PBMC and CD4(+) T-cells, regardless of their tropism, while MDM mainly sustained replication of R5- or R5(+)/X4-tropic isolates; strong correlation between viral-replication and genotypic-FPR-values was observed in MDM (rho = 0.710;p-value = 1.4e-4). In all primary cells, maraviroc inhibited viral-replication of isolates not only with pure R5- but also with dual/mixed tropism (mainly R5(+)/X4 and, to a lesser extent R5/X4 and R5/X4(+)). Finally, no main differences by comparing the total HIV-DNA with the p24-production in presence/absence of maraviroc were found.

Conclusions: Maraviroc is effective in-vitro against viruses with dual-characteristics in both MDM and lymphocytes, despite the potential X4-mediated escape. This suggests that the concept of HIV-entry through one of the two coreceptors "separately" may require revision, and that the use of CCR5-antagonists in patients with dual/mixed-tropic viruses may be a therapeutic-option that deserves further investigations in different clinical settings.


Conflict of interest statement

Competing Interests: CF Perno have received funds for attending symposia, speaking, organizing educational activities, grant research support, consultancy and advisory board membership, from Abbott, Boehringer Ingelheim, Bristol Myers Squibb, Gilead, Merck Sharp & Dohme, Janssen Cilag, Pfizer, Tibotec, Roche, and ViiV. F Ceccherini-Silberstein has received funds for attending symposia, speaking and organizing educational activities from Abbott, Merck Sharp & Dohme, Janssen Cilag, and ViiV. V Svicher has received funds for attending symposia, speaking and organizing educational activities from ViiV. The other authors declare that no competing interests exist. This does not alter the authors’ adherence to all the PLOS ONE policies on sharing data and materials.

Figures

Figure 1
Figure 1. Replication capacity in PBMC.
The bars represents the percentages of HIV-1 isolate replication in PBMC cultures infected with 16,000 p24 pg per 106 cells after 7 days post infection. The percentage of viral replication of each isolate is calculated considering the replication of the control virus HIVBaL as 100% (median value of 76,688 pg/ml). Mean values of at least 3 experiments for each isolate are shown. Error bars indicating inter-experimental standard deviations are shown. Linear regression model and Pearson correlation coefficient were used to determine the strength of correlation between the replication capacity (p24 production) and genotypic tropism (values of Geno2Pheno FPR). R2 = Coefficient of determination; rho = Pearson correlation coefficient; p, two-tailed p value. The False Positive Rate (FPR) values are based on the V3 sequences and calculated with Geno2Pheno algorithm. The phenotypic tropism was evaluated on astroglioma U87MG-CD4+-CCR5+−/CXCR4+-expressing cells (DR: R5+X4; D: R5/X4; DX: R5/X4+).
Figure 2
Figure 2. Activity of Maraviroc in PBMC.
In vitro efficacy of Maraviroc in PBMC cultures. The histogram represents the percentage of viral inhibition (p24 production pg/ml) in presence of Maraviroc, AMD3100 and AZT at different concentrations, considering the untreated as 100. Mean values of at least 3 experiments for each isolate are shown. Error bars indicating inter-experimental standard deviations are shown. Maraviroc median IC50 and IC90 values of 3 different experiments are also shown. The False Positive Rate (FPR) values are based on the V3 sequences and calculated with Geno2Pheno algorithm. The phenotypic tropism was evaluated on astroglioma U87MG-CD4+-CCR5+−/CXCR4+-expressing cells (DR: R5+X4; D: R5/X4; DX: R5/X4+).
Figure 3
Figure 3. Replication capacity in MDM.
The bars represents the percentages of HIV-1 isolate replication in MDM cultures infected with 8,000 pg per 105 cells after 14 days post infection. The percentage of viral replication of each isolate is calculated considering the replication of the control virus HIVBaL as 100% (median value of 162,143 pg/ml). Mean values of at least 3 experiments for each isolate are shown. Error bars indicating inter-experimental standard deviations are shown. Linear regression model and Pearson correlation coefficient were used to determine the strength of correlation between the replication capacity (p24 production) and genotypic tropism (values of Geno2Pheno FPR). Mann-Whitney-Wilcoxon (MWW) test was used to compare the replication capacity between isolates with FPR <20% and >20%. R2 = Coefficient of determination; rho = Pearson correlation coefficient; p, two-tailed p value. The False Positive Rate (FPR) values are based on the V3 sequences and calculated with Geno2Pheno algorithm. The phenotypic tropism was evaluated on astroglioma U87MG-CD4+-CCR5+−/CXCR4+-expressing cells (DR: R5+X4; D: R5/X4; DX: R5/X4+).
Figure 4
Figure 4. Activity of Maraviroc in MDM.
In vitro efficacy of Maraviroc in MDM cultures. The bars represents the percentage of viral inhibition (p24 production pg/ml) in presence of Maraviroc, AMD3100 and AZT at different concentrations, considering the untreated as 100. Mean values of at least 3 experiments for each isolate are shown. Error bars indicating inter-experimental standard deviations are shown. Maraviroc median IC50 and IC90 values of 3 different experiments are also shown. The False Positive Rate (FPR) values are based on the V3 sequences and calculated with Geno2Pheno algorithm. The phenotypic tropism was evaluated on astroglioma U87MG-CD4+-CCR5+−/CXCR4+-expressing cells (DR: R5+X4; D: R5/X4; DX: R5/X4+).*Antiviral activity against X4-tropic viruses (#16 and HIVIIIB) was not evaluated because due to their low replication.
Figure 5
Figure 5. Comparison of HIV-DNA and viral replication in PBMC and CD4+ T-cells.
The bars represents the percentage of HIV-1 DNA copies and p24 values (normalized per 106 cells) in human primary cell types. Panel A and B: PBMC and CD4+ T-cells infected with 16,000 pg per 106 cells after 7 days post infection, respectively. The percentage of p24 production and DNA copies of each isolate is calculated considering the replication of the control virus HIVBaL as 100 (in PBMC: median p24 production of 45.506 pg/106 and 555.000 HIV DNA copies/106; in CD4+ T-cells: median p24 production of 357.561 pg/106 and 2.5×10⁶ HIV DNA copies/106 cells). The experiments for PBMC and CD4+ T-cells were done using cells from the same donor. Mean p24 production values of 3 biological replicates for each isolate are shown. Error bars indicating intra-experimental standard deviations are shown. Linear regression model and Pearson correlation coefficient were used to determine the strength of correlation between p24 production and HIV-DNA copies. R2 = Coefficient of determination; rho = Pearson correlation coefficient; p, two-tailed p value. The False Positive Rate (FPR) values are based on the V3 sequences and calculated with Geno2Pheno algorithm. The phenotypic tropism was evaluated on astroglioma U87MG-CD4+-CCR5+−/CXCR4+-expressing cells (DR: R5+X4; D: R5/X4; DX: R5/X4+).
Figure 6
Figure 6. Comparison of HIV-DNA and viral replication in Macrophages.
Panel A: The bars represents the percentage of HIV-1 DNA copies and p24 values (normalized per 106 cells) in human primary MDM infected with 8,000 pg per 105 cells after 14 days post infection. The percentage of p24 production and DNA copies of each isolate is calculated considering the replication of the control virus HIVBaL as 100 (median p24 production of 499.310 pg/106 and 9.3×10⁶ HIV DNA copies/106). Panel B. The scatterplot shows the correlation between the replication capacity (p24 production) and HIV-DNA content, by using a simple linear regression model. Pearson correlation coefficient was also used to determine the strength of correlation between p24 production and HIV-DNA copies. R2 = Coefficient of determination; rho = Pearson correlation coefficient; p, two-tailed p value. The False Positive Rate (FPR) values are based on the V3 sequences and calculated with Geno2Pheno algorithm. The phenotypic tropism was evaluated on astroglioma U87MG-CD4+-CCR5+−/CXCR4+-expressing cells (DR: R5+X4; D: R5/X4; DX: R5/X4+).
Figure 7
Figure 7. Inhibition of HIV DNA in presence of maraviroc in PBMC cultures.
The bars represents the percentage of HIV-1 DNA copies and p24 values (normalized per 106 cells) in the presence of AMD, AZT and maraviroc at different concentrations considering the untreated as 100. HIVBaL is used as control virus. The p24 production is obtained from PBMC-cultures infected with 16,000 pg per 106 cells after 7 days post infection. Data represent one of three experiments yielding similar results. Mean values of 3 biological replicates (p24 production) for each isolate are shown. Error bars indicating intra-experimental standard deviations are shown. The False Positive Rate (FPR) values are based on the V3 sequences and calculated with Geno2Pheno algorithm. The phenotypic tropism was evaluated on astroglioma U87MG-CD4+-CCR5+−/CXCR4+-expressing cells (DR: R5+X4; D: R5/X4; DX: R5/X4+).

Similar articles

Cited by

References

    1. Goodenow MM, Collman RG (2006) HIV-1 coreceptor preference is distinct from target cell tropism: a dual-parameter nomenclature to define viral phenotypes. J Leukoc Biol 80: 965–972. jlb.0306148 [pii]; doi:10.1189/jlb.0306148. - PubMed
    1. Cammack N (1999) Human immunodeficiency virus type 1 entry and chemokine receptors: a new therapeutic target. Antivir Chem Chemother 10: 53–62. - PubMed
    1. Feng Y, Broder CC, Kennedy PE, Berger EA (1996) HIV-1 entry cofactor: functional cDNA cloning of a seven-transmembrane, G protein-coupled receptor. Science 272: 872–877. - PubMed
    1. Moore JP, Trkola A, Dragic T (1997) Co-receptors for HIV-1 entry. Curr Opin Immunol 9: 551–562. S0952-7915(97)80110-0 [pii]. - PubMed
    1. Dragic T, Litwin V, Allaway GP, Martin SR, Huang Y, et al. (1996) HIV-1 entry into CD4+ cells is mediated by the chemokine receptor CC-CKR-5. Nature 381: 667–673 doi:10.1038/381667a0 - DOI - PubMed

Publication types