. 2013 Jul 12;8(7):e68450.
doi: 10.1371/journal.pone.0068450. Print 2013.

High-content analysis of sequential events during the early phase of influenza A virus infection

Affiliations

High-content analysis of sequential events during the early phase of influenza A virus infection

Indranil Banerjee et al. PLoS One. .

Abstract

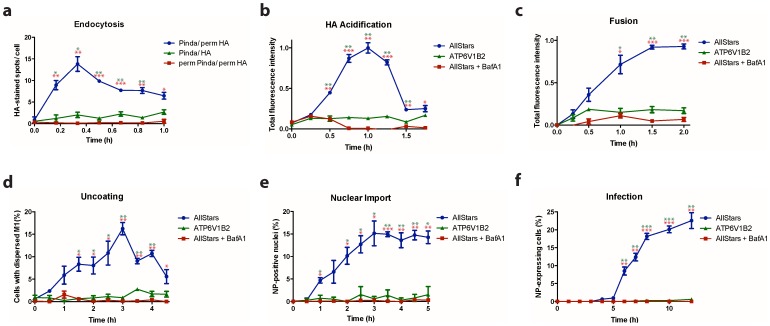
Influenza A virus (IAV) represents a worldwide threat to public health by causing severe morbidity and mortality every year. Due to high mutation rate, new strains of IAV emerge frequently. These IAVs are often drug-resistant and require vaccine reformulation. A promising approach to circumvent this problem is to target host cell determinants crucial for IAV infection, but dispensable for the cell. Several RNAi-based screens have identified about one thousand cellular factors that promote IAV infection. However, systematic analyses to determine their specific functions are lacking. To address this issue, we developed quantitative, imaging-based assays to dissect seven consecutive steps in the early phases of IAV infection in tissue culture cells. The entry steps for which we developed the assays were: virus binding to the cell membrane, endocytosis, exposure to low pH in endocytic vacuoles, acid-activated fusion of viral envelope with the vacuolar membrane, nucleocapsid uncoating in the cytosol, nuclear import of viral ribonucleoproteins, and expression of the viral nucleoprotein. We adapted the assays to automated microscopy and optimized them for high-content screening. To quantify the image data, we performed both single and multi-parametric analyses, in combination with machine learning. By time-course experiments, we determined the optimal time points for each assay. Our quality control experiments showed that the assays were sufficiently robust for high-content analysis. The methods we describe in this study provide a powerful high-throughput platform to understand the host cell processes, which can eventually lead to the discovery of novel anti-pathogen strategies.


Conflict of interest statement

Competing Interests: The authors have declared that no competing interests exist.

Figures

Figure 1
Figure 1. Sequential events during host-cell entry of IAV.
(a). Entry involves six steps; binding of the virus to the cell membrane (EB), internalization by endocytosis (EE), acidification in late endocytic vacuoles (EA), fusion of viral and vacuolar membranes (EF), uncoating of nucleocapsid (EU), and nuclear import of vRNPs (EI). Components of IAV are shown in the right (NA: neuraminidase, M2: proton channel). (b–g). High-resolution confocal images of the individual assays. (b) Binding (EB assay): (Top) AllStars negative siRNA-treated cells were incubated with IAV for 1 h in the cold. After washing, cell-bound virus particles were stained by IIF using the Pinda antibody against HA (green). The cells membrane was visualized with WGA-AF647 (blue). (Bottom) Cells with no virus (c) Endocytosis (EE assay): (Top) Cells were incubated with IAV for 1 h in the cold. After washing, cells with bound viruses were warmed up to 37°C for 20 min to allow virus internalization. To distinguish between the endocytosed and extracellular virus particles, the HA epitopes of the virus particles accessible from the medium were masked with the Pinda antibody. The cells were then permeabilized with detergent and incubated with a mouse monoclonal antibody (HA1). After fluorescently-labeled secondary antibody treatment, the endocytosed (green) and non-internalized virus particles (red) were identified (Pinda/perm HA). Cell membrane (blue) was stained with WGA. (Bottom) After virus internalization and fixation, cells were permeabilized with detergent and similar staining procedures were followed. The endocytosed and extracellular virus particles are not distinguished and both showed same fluorescent signal (red) (perm Pinda/perm HA). (d) Acidification (EA assay): (Top) Virus particles were allowed to enter the AllStars negative siRNA-treated cells at 37°C for 1.0 h and were stained with A1 antibody to detect the acid-induced conformation of HA (green) in endocytic vacuoles near the nucleus (blue). (Bottom) Cells treated with ATP6V1B2 siRNA showed no A1 signal due to block in endosome acidification. (e) Fusion (EF assay): (Top) Virus particles were labeled with SP-DiOC18 (3) and R18, and were allowed to enter the AllStars negative siRNA-treated cells at 37°C for 1.5 h, after which the cells were fixed. Fusion of viral and vacuolar membranes of cells triggered dequenching of DiOC18(3) (green). DiOC18(3) signal colocalized with the R18 (red) signal. (Bottom) Cells treated with ATP6V1B2 siRNA showed R18 (red) signal only. (f) Uncoating (EU assay): (Top) To detect the dispersal of M1 into the cytoplasm of the cells (blue), viruses were allowed to enter the AllStars negative siRNA treated cells at 37°C for 3 h. After fixation and permeabilization, mouse monoclonal antibody HB64 was used to stain the viral M1 (green). (Bottom) Block in uncoating due to ATP6V1B2 siRNA treatment, where the virus particles (green) accumulated in the endocytic vacuoles. (g) Nuclear import (EI assay): (Top) In the AllStars negative siRNA-treated cells, virus particles were allowed to enter at 37°C for 3.5 h. Incoming NP proteins (green) were detected within the nucleus (blue) by the treatment with mouse monoclonal antibody HB65. (Bottom) Import of NP (green) was blocked in cells treated with ATP6V1B2 siRNA. Scale bar = 5 µm.
Figure 2
Figure 2. Data analysis steps.
(a) Data analysis pipeline. Alternative concepts: (left column) single parameter-based statistics, (right column) machine learning. (b) Spot detection for the EE assay. Spot intensities with the desired size (black arrows) were amplified, while noise (red arrow) and uneven background was suppressed. (c) Analysis of the EA and EF assays. GFP intensity was thresholded, and the detected objects were filtered by size. (d) (Left) EU assay confusion matrix. (Right) Comparison of classification methods using 10-fold cross validation. Logistic regression classifiers with boosting (LogitBoost) were the most accurate (∼98%) (red arrow). (e) EI assay (Left) Original image. (Middle) Segmentation result. (Right) Phenotypic classification of cells: import-negative import-positive.
Figure 3
Figure 3. Time-course of IAV entry as shown by individual assays.
(a) Kinetics of IAV endocytosis in the ‘Pinda/perm HA’, ‘Pinda/HA’ and ‘perm Pinda/perm HA’ cells. Endocytosed IAV signal in the ‘Pinda/perm HA’cells peaks at 20 min post-infection. (b) Acidification time-course in the cells treated with AllStars negative and ATP6V1B2 siRNAs, and the cells treated with 50 nM Bafilomycin A1 (BafA1) to block endosomal acidification. The acidification signal in the AllStars negative siRNA-treated cells reaches the peak at 1 h post-infection. (c) Kinetics of viral fusion, which shows the dequenching signal from DiOC18(3) in the AllStars negative siRNA-treated cells peaks at 1.5 h post-infection. (d) Nucleocapsid uncoating time-course indicating the peak of M1 dispersal signal is at 3 h post-infection. (e) Nuclear import time course shows that the import plateaus at 3.5 h post-infection in the control cells. (f) Kinetics of infection (transcription and translation of NP), which shows that the optimal time for the detection of cells with newly synthesized NP is 8 h post-infection. Z’ factor values are represented by * - between 0 and 0.5; ** - between 0.5 and 0.8; and ***>0.8.

References

    1. Matlin KS, Reggio H, Helenius A, Simons K (1981) Infectious entry pathway of influenza virus in a canine kidney cell line. J Cell Biol 91: 601–613. - PMC - PubMed
    1. de Vries E, Tscherne DM, Wienholts MJ, Cobos-Jimenez V, Scholte F, et al. (2011) Dissection of the influenza A virus endocytic routes reveals macropinocytosis as an alternative entry pathway. PLoS Pathog 7: e1001329. - PMC - PubMed
    1. White J, Kartenbeck J, Helenius A (1982) Membrane fusion activity of influenza virus. EMBO J 1: 217–222. - PMC - PubMed
    1. Lakadamyali M, Rust MJ, Zhuang X (2004) Endocytosis of influenza viruses. Microbes Infect 6: 929–936. - PMC - PubMed
    1. Stertz S, Shaw ML (2011) Uncovering the global host cell requirements for influenza virus replication via RNAi screening. Microbes Infect 13: 516–525. - PMC - PubMed

Publication types

MeSH terms