. 2013 Jul 16;8(7):e68844.
doi: 10.1371/journal.pone.0068844. Print 2013.

Morphological and molecular characterization of dietary-induced pseudo-albinism during post-embryonic development of Solea senegalensis (Kaup, 1858)

Affiliations

Morphological and molecular characterization of dietary-induced pseudo-albinism during post-embryonic development of Solea senegalensis (Kaup, 1858)

Maria J Darias et al. PLoS One. .

Abstract

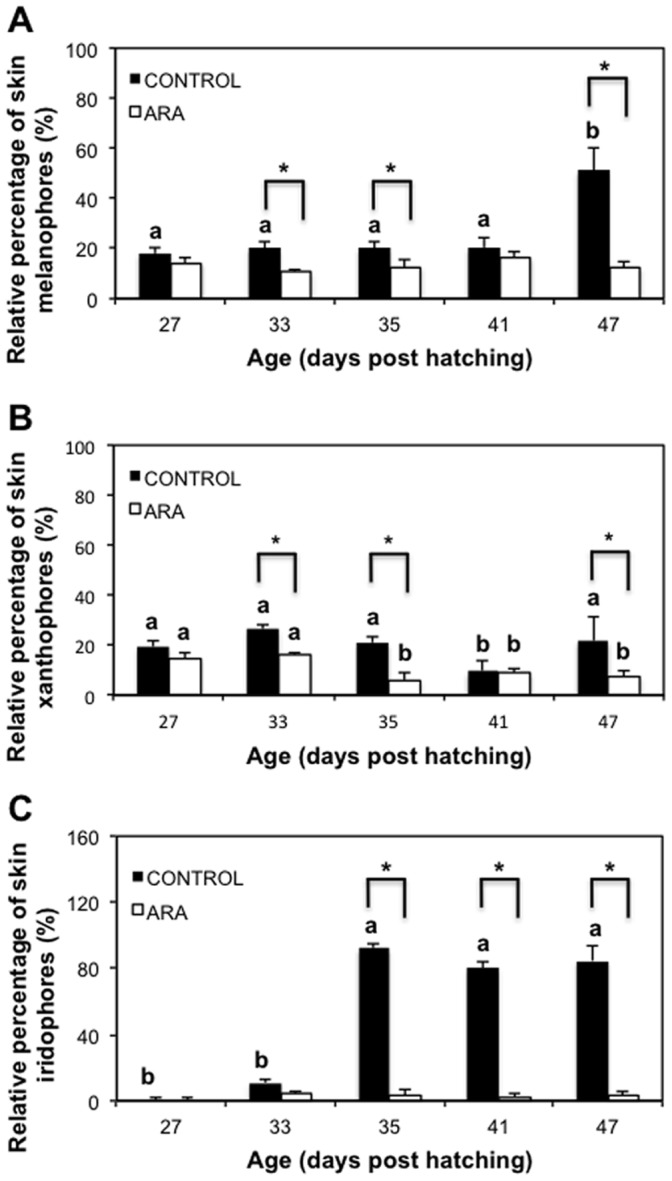
The appearance of the pseudo-albino phenotype was investigated in developing Senegalese sole (Solea senegalensis, Kaup 1858) larvae at morphological and molecular levels. In order to induce the development of pseudo-albinos, Senegalese sole larvae were fed Artemia enriched with high levels of arachidonic acid (ARA). The development of their skin pigmentation was compared to that of a control group fed Artemia enriched with a reference commercial product. The relative amount of skin melanophores, xanthophores and iridophores revealed that larval pigmentation developed similarly in both groups. However, results from different relative proportions, allocation patterns, shapes and sizes of skin chromatophores revealed changes in the pigmentation pattern between ARA and control groups from 33 days post hatching onwards. The new populations of chromatophores that should appear at post-metamorphosis were not formed in the ARA group. Further, spatial patterns of distribution between the already present larval xanthophores and melanophores were suggestive of short-range interaction that seemed to be implicated in the degradation of these chromatophores, leading to the appearance of the pseudo-albino phenotype. The expression profile of several key pigmentation-related genes revealed that melanophore development was promoted in pseudo-albinos without a sufficient degree of terminal differentiation, thus preventing melanogenesis. Present results suggest the potential roles of asip1 and slc24a5 genes on the down-regulation of trp1 expression, leading to defects in melanin production. Moreover, gene expression data supports the involvement of pax3, mitf and asip1 genes in the developmental disruption of the new post-metamorphic populations of melanophores, xanthophores and iridophores.


Conflict of interest statement

Competing Interests: The authors have declared that no competing interests exist.

Figures

Figure 1
Figure 1. Morphological comparison of the ontogeny of skin pigmentation in Senegalese sole larvae from the control (A–F) and ARA (A’–F’) groups.
A–A’) 22 dph, B–B’) 27 dph, C–C’) 33 dph, D–D’) 35 dph, E–E’) 41 dph, F–F’) 47 dph. At 22 dph, the pigmentation pattern of larvae from both dietary groups is similar, showing a very dense net of melanophores, xanthophores and leucophores that covers the head, the digestive cavity and the intermediate region of the trunk. They have also two patches of chromatophores in the dorsal fin and another one in the anal fin. At 27 dph, although the relative amounts of melanophores, xanthophores and iridophores was similar in both groups (Fig. 2), the skin of larvae from the ARA group appeared less pigmented than that of the larvae from the control group due to the progressive disappearance of leucophores that confers the greenish aspect to the skin. At 33 dph, the amount of melanophores in control larvae was higher than in those fed with ARA. Red arrows indicates the allocation of patches of melanophores, xanthophores and leucophores in pigmented individuals (C) and their absence in future pseudo-albino individuals (C’). Green arrows show the presence of iridophores in the pelvic fins of specimens from both groups. At 35 dph the pseudo-albino phenotype is already established. The differences in the amounts of xanthophores and iridophores between pigmented (D) and pseudo-albino (D’) specimens became more evident (Fig. X). Green arrows show aggrupation of iridophores in the dorsal fin in pigmented individuals (D) and their absence in future pseudo-albino individulas (D’). From 35 to 47 dph, the amount of chromatophores in pseudo-albinos remained invariable. However, because there was an increase in the amount of melanophores and xanthophores in pigmented individuales from 41 to 47 dph there was a significant difference in the amount of all chromatophores between pigmented and pseudo-albino individuals at 47 dph. Scale bar, 600 µm.
Figure 2
Figure 2. Relative percentage of skin melanophores (A), xanthophores (B) and iridophores (C) during post-metamorphosis of pigmented (control) and pseudo-albino (ARA) individuals of Senegalese sole.
Values are expressed as mean ± SD (N = 4). Superscript letters denote significant differences in the relative amount of chromatophores with age for a given larval group and asterisks indicate significant differences in the amount of chromatophores between pigmented and pseudo-albino specimens for a given larval age (Two-way ANOVA, P<0.05; diet x age interaction P<0.006).
Figure 3
Figure 3. Microscopic images of the trunk skin of pigmented (A–C) and pseudo-albino (A’–C’) Senegalese sole specimens.
A–C) skin showing abundant dendritic melanophores surrounded by several xanthophores. A’–C’) skin showing few melanophores and disintegrating xanthophores. A) 33 dph, B) 35 dph, C) 41 dph. Red arrows, melanophores; blue arrows, xanthophores. Scale bar, 500 µm.
Figure 4
Figure 4. Microscopic images showing details of chromatophores distribution in the skin of pigmented larvae and pseudo-albinos in the ocular side of the fish.
A–B) trunk skin at the level of the vertebral column in 47 day-old pigmented (A) and pseudo-albino (B) specimens. Melanophores are dendritic in pigmented individuals while the ability to disperse melanosomes is lost in pseudo-albinos. C–D) dorsal fin skin in 60 day-old pigmented (C) and pseudo-albino (D) specimens. Note the different shapes and sizes of xanthophores and melanophores between both groups: xanthophores are round in pigmented individuals whereas quite deformed and bigger in pseudo-albinos; melanophores are dendritic in pigmented individual while the round-shaped in pseudo-albinos. There are differences in the distance among xanthophores and melanophores between both groups. The interaction between these chromatophores was closer in pseudo-albinos and melanophores showed signs of disintegration. E) detail of the dorsal fin skin of a 33 day-old future pseudo-albino showing melanophores (black dendritic cells), xanthophores (yellow round cells), leucophores (dendritic cells that appear pale pink under reflecting light) and iridophores (iridescent round cells). Round-shaped melanophores and xanthophores were often associated in pairs, this being associated to the observed phenomenon of disintegration of one of the two chromatophores. F) detail of the dorsal fin skin of a 60 day-old pseudo-albino showing only few leucophores. Some non-identified transparent round structures were appreciated (red arrows). Red arrows, melanophores; blue arrows, xanthophores; green arrows, iridophores; yellow arrows, leucophores. Scale bars: A–B, 200 µm; C–F, 100 µm.
Figure 5
Figure 5. Relative percentage of skin chromatophores in pigmented (A) and pseudo-albino (B) specimens of Senegalese sole during post-metamorphosis.
Values are expressed as mean ± SD (N = 4). Superscript letters denote significant differences in the relative amount of chromatophores for a given larval age (One-way ANOVA, P<0.05). Note that differences in the relative proportion of the three chromatophores between control and ARA groups were evident from 35 dph onwards and that they became invariable from 41 dph, indicating the establishment of the final skin color phenotype on the ocular side.
Figure 6
Figure 6. Size of skin melanophores, xanthophores and iridophores, and melanin dispersion distance in 60 day-old pigmented (control) and pseudo-albino (ARA) specimens of Senegalese sole.
Values are expressed as mean ± SD (N = 4). Superscript letters denote significant differences in size between chromatophores of a given larval group (One-way ANOVA, P<0.05) and asterisks indicate significant differences in size of chromatophores and melanin dispersion distance between pigmented and pseudo-albino specimens (Student’s t-test, N = 4, P<0.001).
Figure 7
Figure 7. Fold change relative gene expression of pigmentation-related genes in 60 day-old pseudo-albino (ARA) specimens of Senegalese sole compared to pigmented specimens.
Melanocyte-stimulating hormone 1 receptor (mc1r), agouti signaling protein (asip1), paired box protein 3 (pax3), microphtalmia-associated transcription factor (mitf), tyrosinase (tyr), tyrosinase-related protein 1 (trp1), mast/stem cell growth factor receptor Kit (cKit), sodium/potassium/calcium exchanger 5 (slc24a5), enzyme caspase 3 (casp3), heat shock 70 kDa protein (hsp70) and somatolactin (sl). Student’s t-test, N = 4, P-values shown in figure.
Figure 8
Figure 8. Schematic picture showing the known action of the analyzed genes in melanocyte differentiation and melanogenesis in vertebrate melanocytes (A) and the suggested pathways of melanophore differentiation and melanogenesis that were altered in pseudo-albinos of Senegalese sole (B).
The explanation of the figure is given in the main text.

Similar articles

Cited by

References

    1. Montoliu L, Oetting WS, Bennett DC (2011) Color Genes. European Society for Pigment Cell Research. Available: http://www.espcr.org/micemut Accessed 2013 Jun 10.
    1. Hofreiter M, Schöneberg T (2010) The genetic and evolutionary basis of colour variation in vertebrates. Cell Mol Life Sci 67: 2591–603. - PMC - PubMed
    1. Fujii R (2000) The Regulation of Motile Activity in Fish Chromatophores. Pigment Cell Res 13: 300–319. - PubMed
    1. Lister JA (2002) Development of pigment cells in the zebrafish embryo. Micros Res Tech 58: 435–441. - PubMed
    1. Mellgrem EM, Johnson SL (2002) The evolution of morphological complexity in zebrafish stripes. Trends Genet 18: 128–134. - PubMed

Publication types

LinkOut - more resources