

Acoustic radiation force impulse imaging for noninvasive evaluation of renal parenchyma elasticity: preliminary findings
- PMID: 23874814
- PMCID: PMC3708904
- DOI: 10.1371/journal.pone.0068925
Acoustic radiation force impulse imaging for noninvasive evaluation of renal parenchyma elasticity: preliminary findings
Abstract
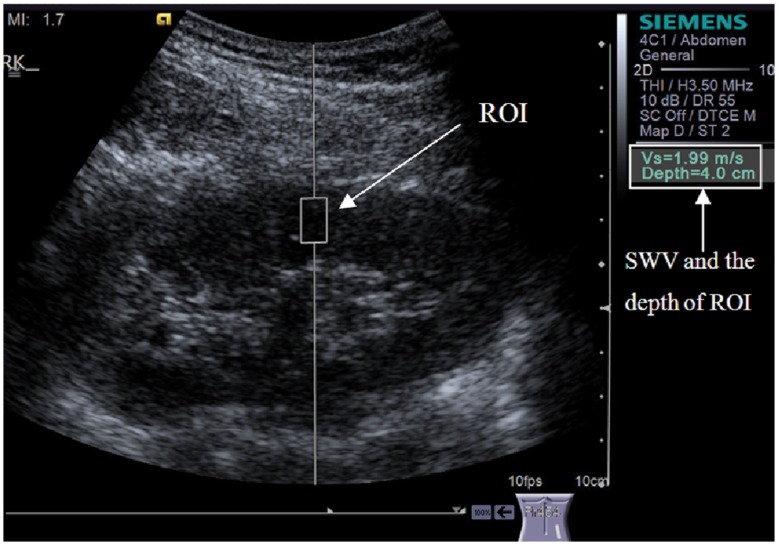
Objective: To evaluate the diagnostic value of acoustic radiation force impulse (ARFI) to test the elasticity of renal parenchyma by measuring the shear wave velocity (SWV) which might be used to detect chronic kidney disease (CKD).
Methods: 327 healthy volunteers and 64 CKD patients were enrolled in the study. The potential influencing factors and measurement reproducibility were evaluated in the healthy volunteers. Correlations between SWV and laboratory tests were analyzed in CKD patients.?Receiver-operating characteristic curve (ROC) analyses were performed to assess the diagnostic performance of ARFI.
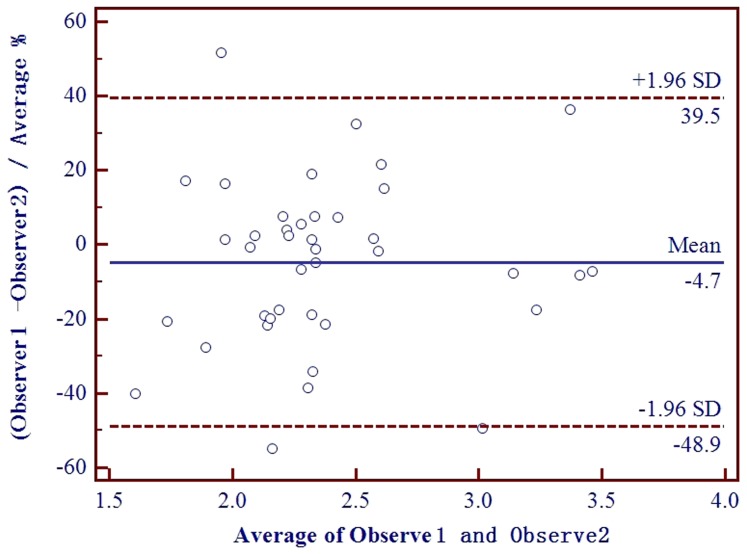
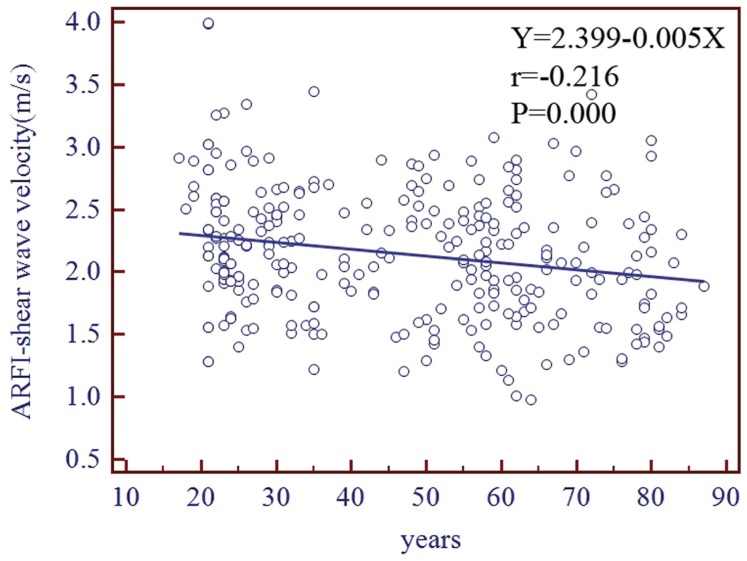
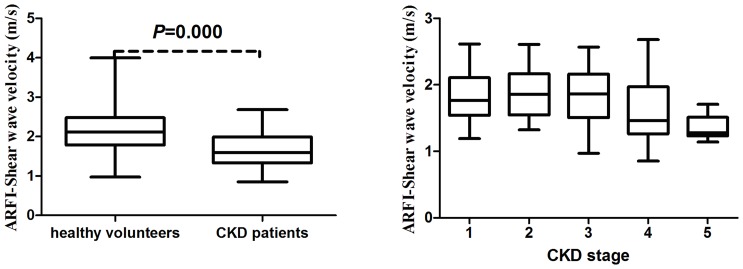
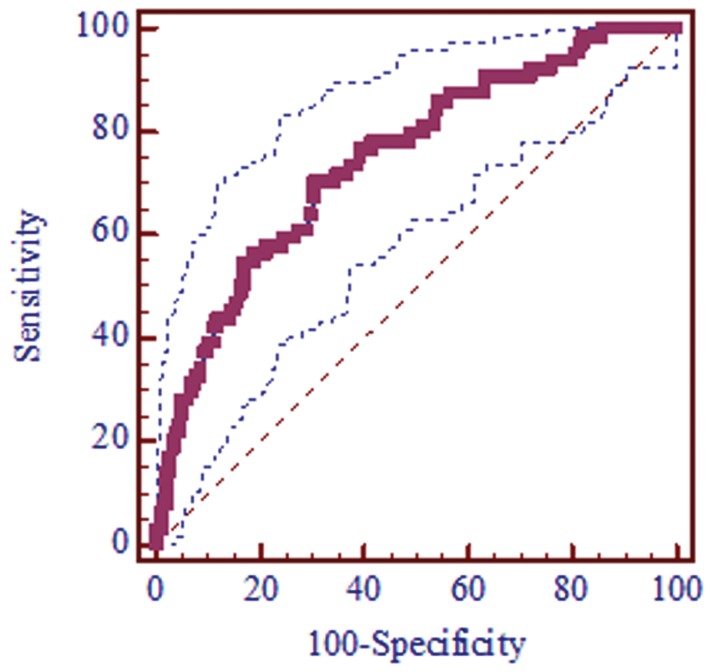
Results: The SWV of healthy volunteers correlated significantly to age (r = -0.22, P<0.001, n = 327) and differed significantly between men and women (2.06±0.48 m/s vs. 2.2±0.52 m/s, P = 0.018, n = 327). However, it did not correlate significantly to height, weight, body mass index, waistline, kidney dimension and the depth for SWV measurement (n = 30). Inter- and intraobserver agreement expressed as intraclass coefficient correlation were 0.64 (95% CI: 0.13 to 0.82, P = 0.011) and 0.6 (95% CI: 0.31 to 0.81, P = 0.001) (n = 40). The mean SWV in healthy volunteers was 2.15±0.51 m/s, while was 1.81±0.43 m/s, 1.79±0.29 m/s, 1.81±0.44 m/s, 1.64±0.55 m/s, and 1.36±0.17 m/s for stage 1, 2, 3, 4 and 5 in CKD patients respectively. The SWV was significantly higher for healthy volunteers compared with each stage in CKD patients. ARFI could not predict the different stages of CKD except stage 5. In CKD patients, SWV correlated to e-GFR (r = 0.3, P = 0.018), to urea nitrogen (r = -0.3, P = 0.016), and to creatinine (r = -0.41, P = 0.001). ROC analyses indicated that the area under the ROC curve was 0.752 (95% CI: 0.704 to 0.797) (P<0.001). The cut-off value for predicting CKD was 1.88 m/s (sensitivity 71.87% and specificity 69.69%).
Conclusion: ARFI may be a potentially useful tool in detecting CKD.
Conflict of interest statement
Figures
References
-
- Coresh J, Astor BC, Greene T, Eknoyan G, Levey AS (2003) Prevalence of chronic kidney disease and decreased kidney function in the adult US population: Third National Health and Nutrition Examination Survey. Am J Kidney Dis 41: 1–12. - PubMed
-
- Bello AK, Nwankwo E, El Nahas AM (2005) Prevention of chronic kidney disease: a global challenge. Kidney Int Suppl: S11–17. - PubMed
-
- Nugent RA, Fathima SF, Feigl AB, Chyung D (2011) The burden of chronic kidney disease on developing nations: a 21st century challenge in global health. Nephron Clin Pract 118: c269–277. - PubMed
-
- Zhang L, Wang F, Wang L, Wang W, Liu B, et al. (2012) Prevalence of chronic kidney disease in China: a cross-sectional survey. Lancet 379: 815–822. - PubMed
Publication types
MeSH terms
LinkOut - more resources
Full Text Sources
Other Literature Sources
Medical
Research Materials
Miscellaneous
