. 2013 Jul 16;8(7):e69216.
doi: 10.1371/journal.pone.0069216. Print 2013.

Deletion of Snai2 and Snai3 results in impaired physical development compounded by lymphocyte deficiency

Affiliations

Deletion of Snai2 and Snai3 results in impaired physical development compounded by lymphocyte deficiency

Peter D Pioli et al. PLoS One. .

Abstract

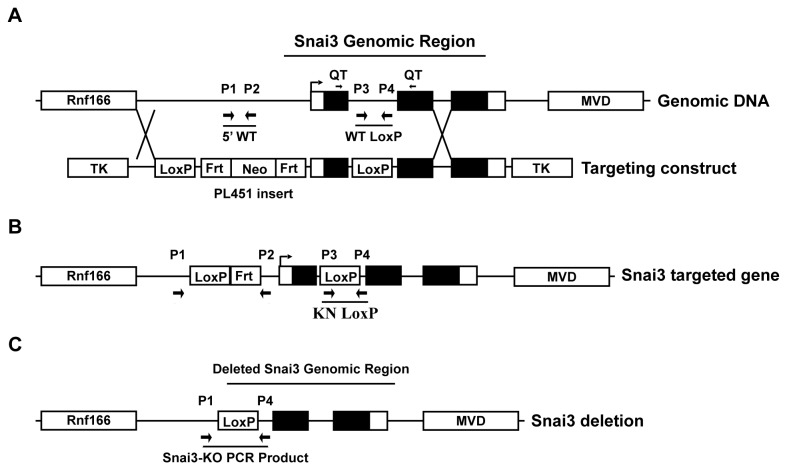
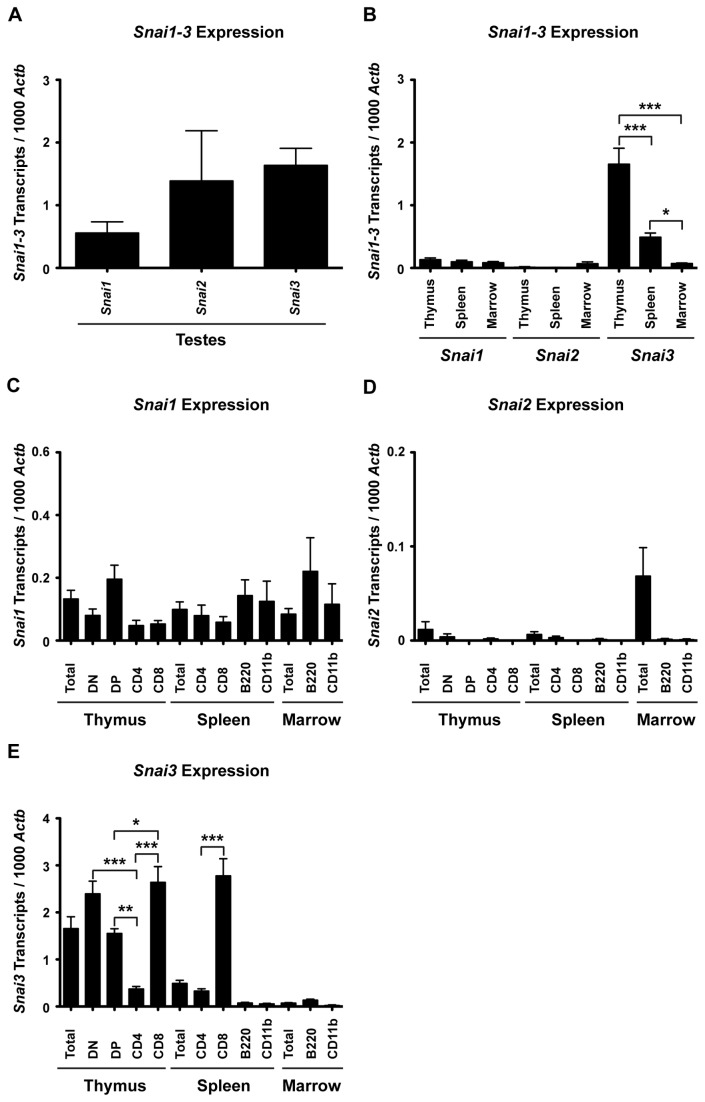
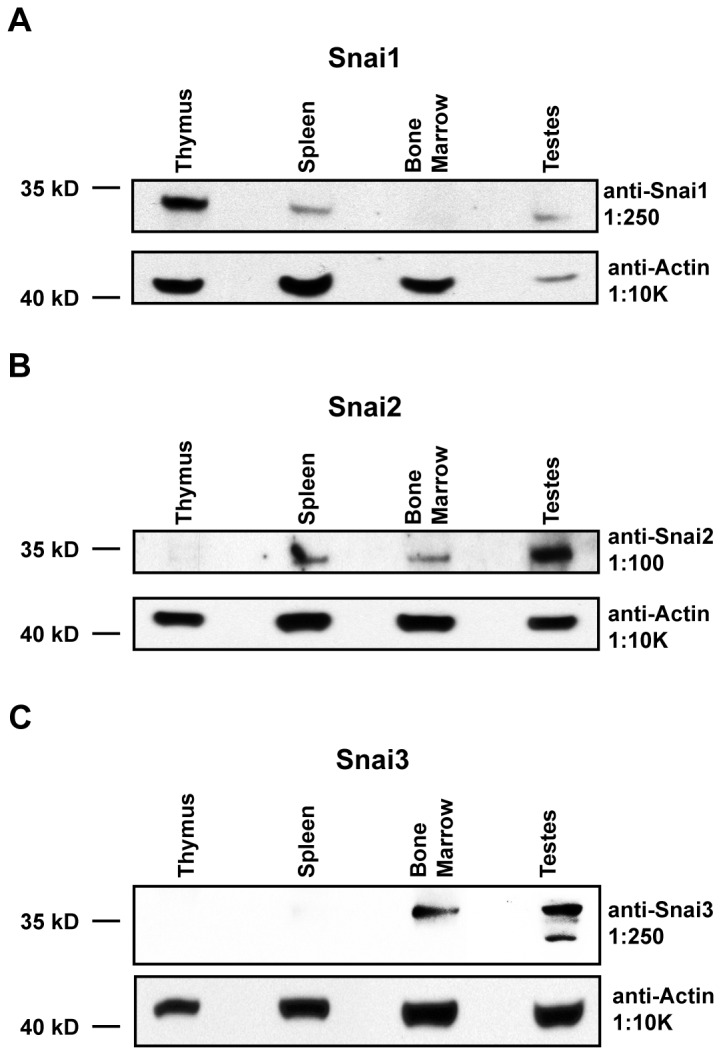
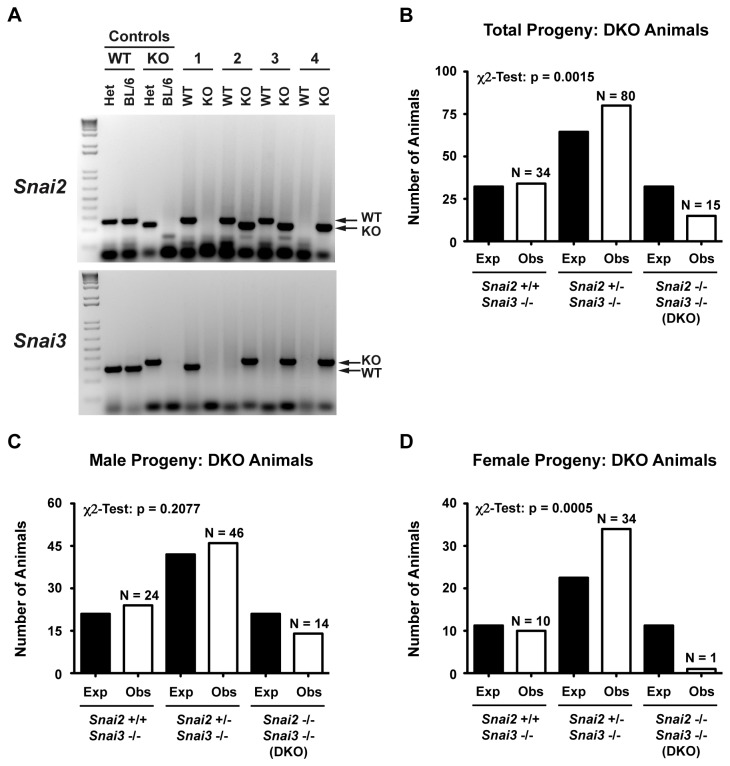
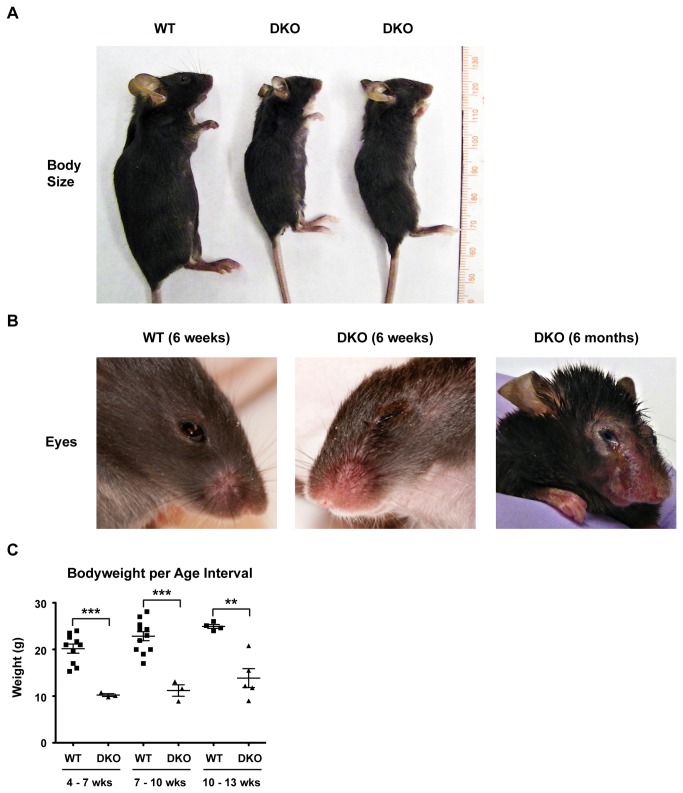
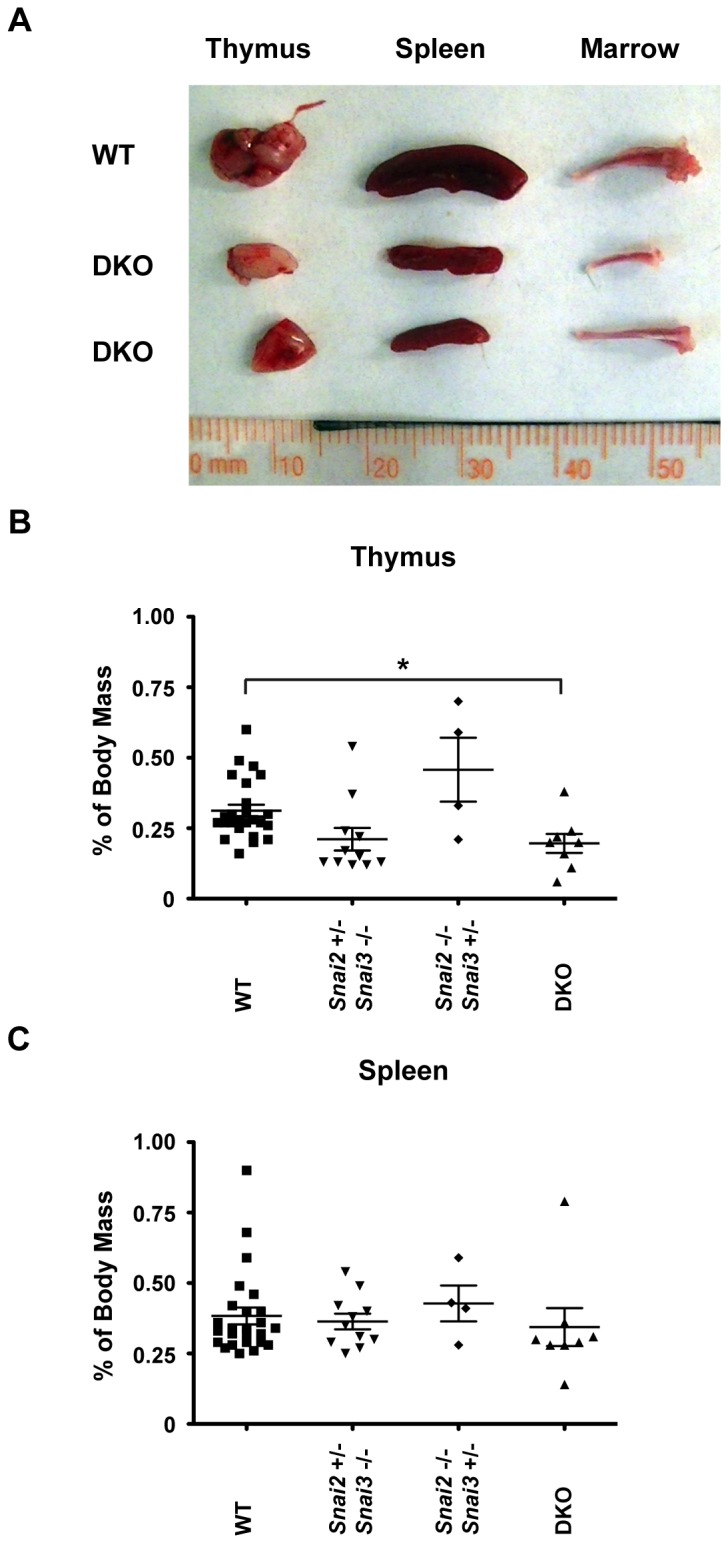
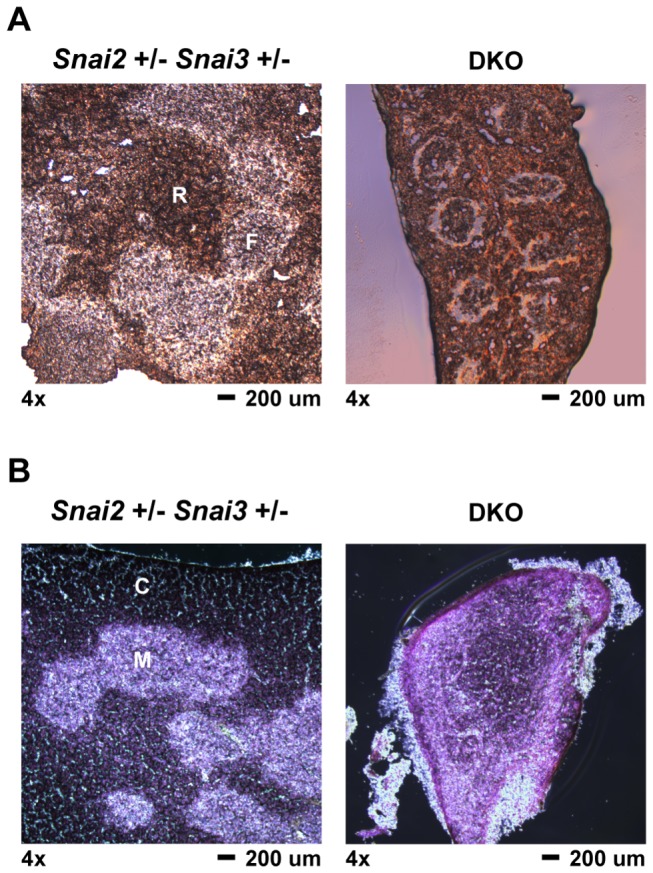
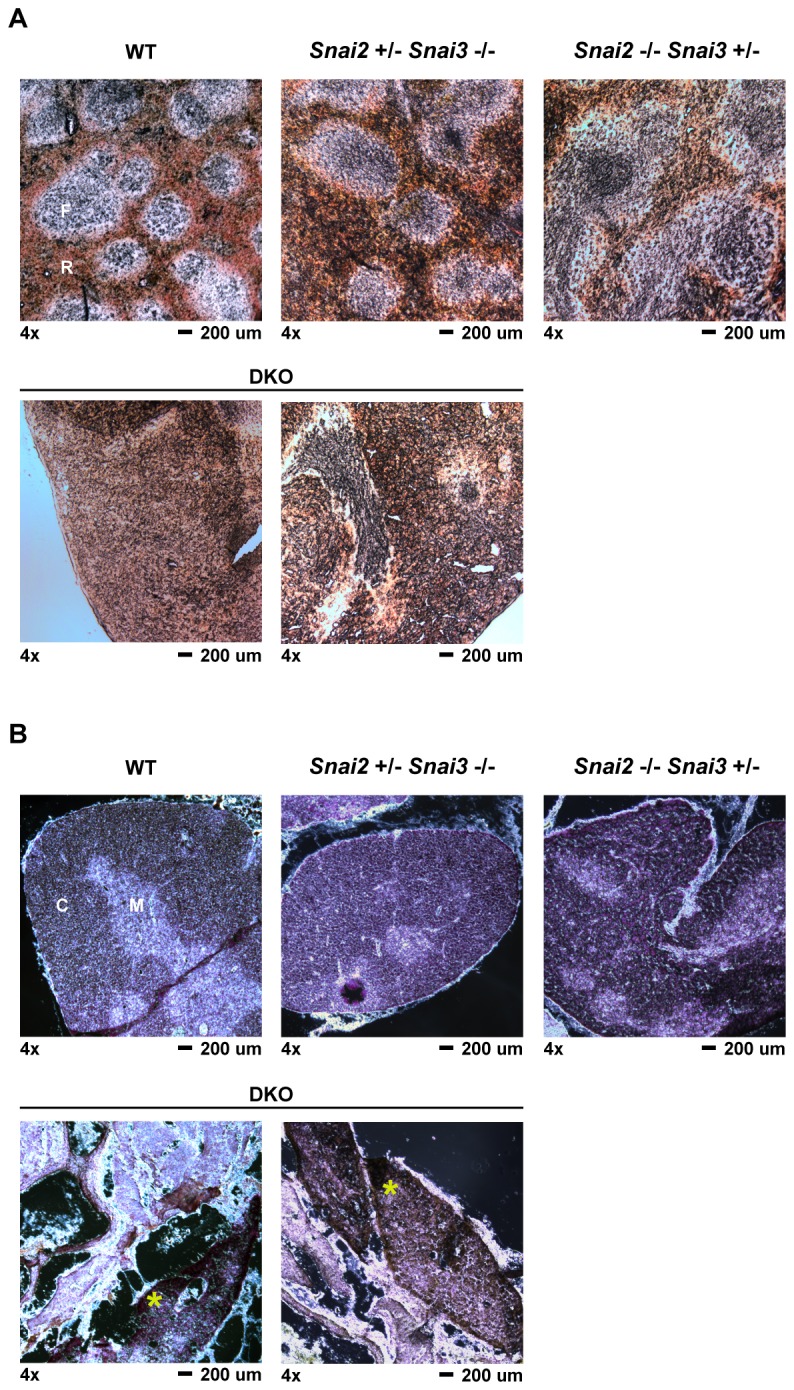
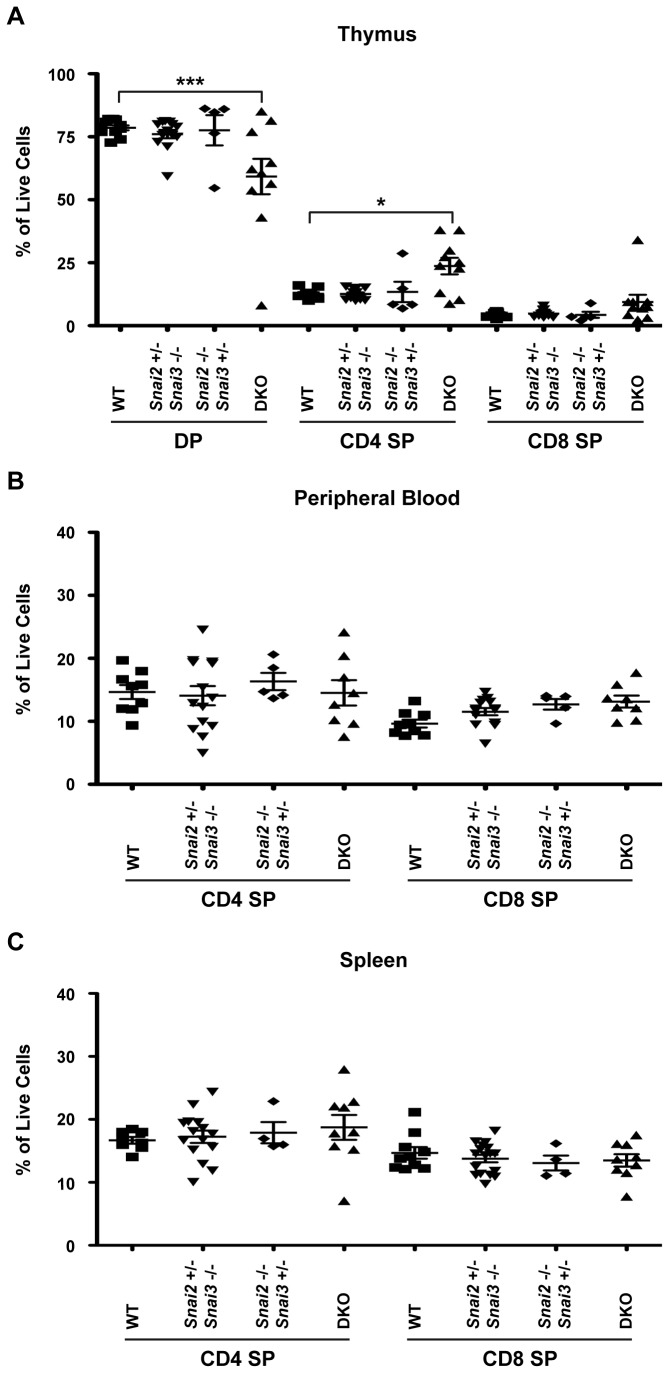
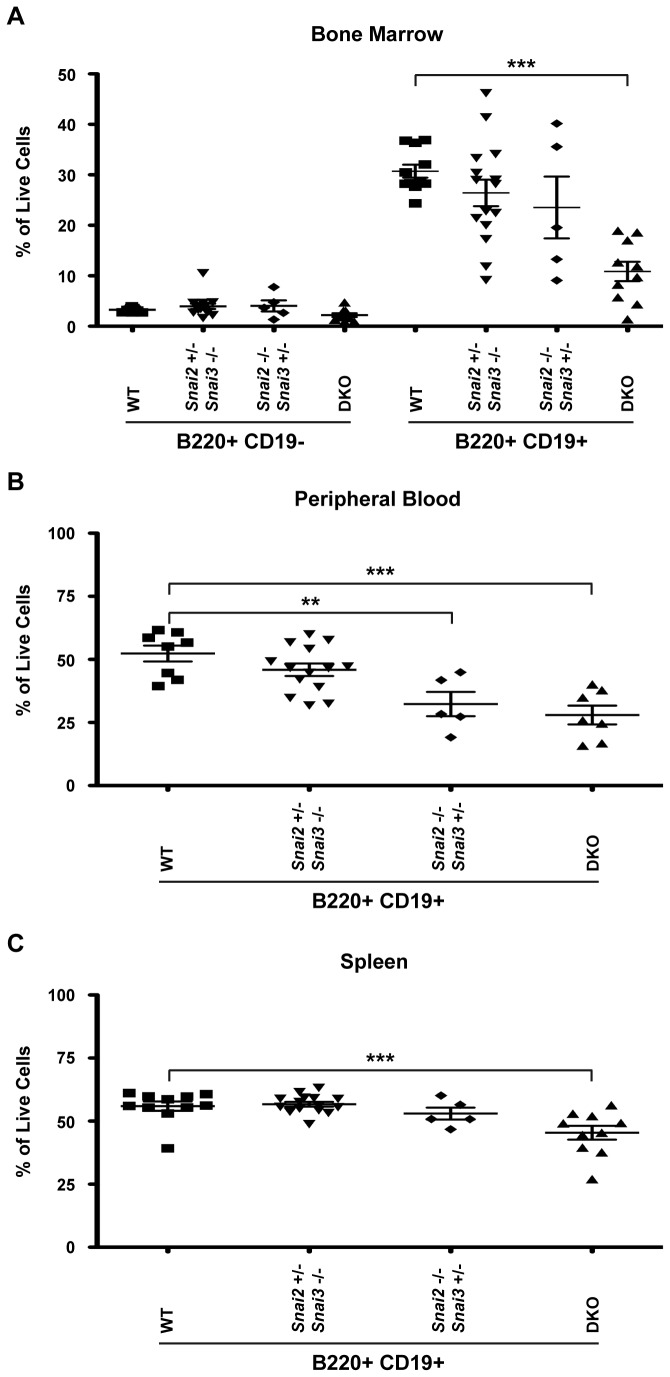
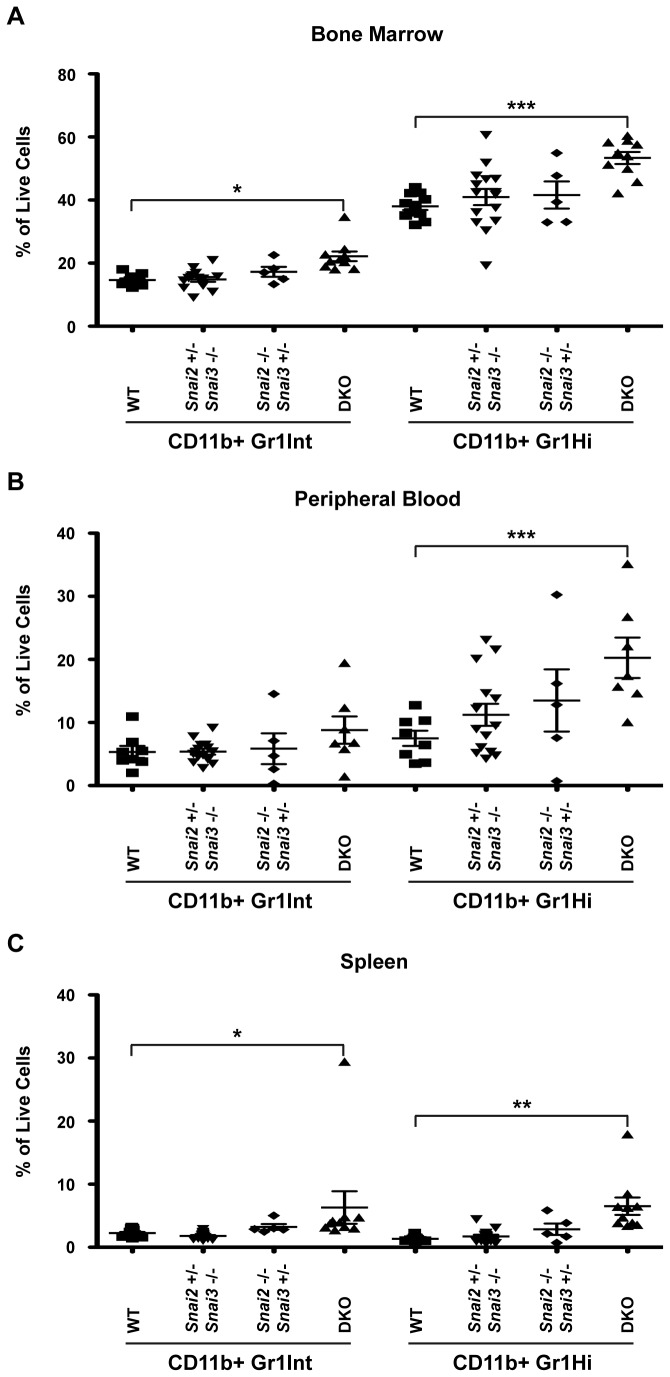
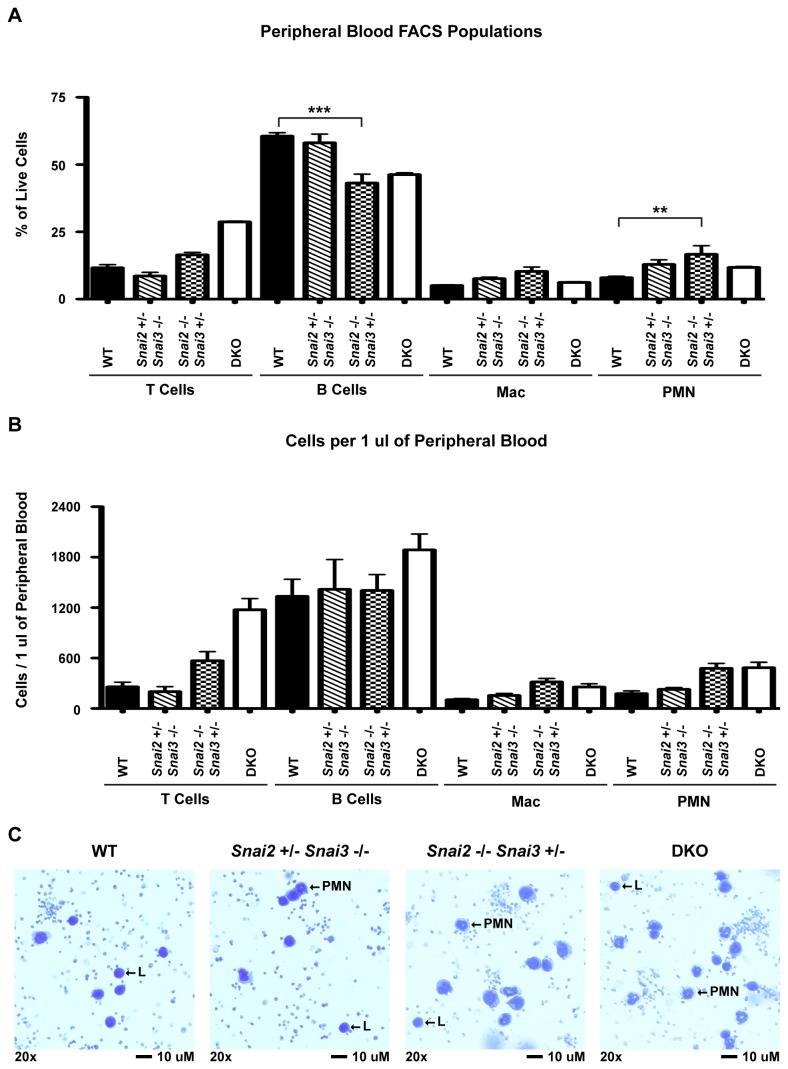
The Snail family of transcriptional regulators consists of three highly conserved members. These proteins regulate (repress) transcription via the recruitment of histone deacetylases to target gene promoters that possess the appropriate E-box binding sequences. Murine Snai1 is required for mouse development while Snai2 deficient animals survive with some anomalies. Less is known about the third member of the family, Snai3. To investigate the function of Snai3, we generated a conditional knockin mouse. Utilizing Cre-mediated deletion to facilitate the ablation of Snai3 in T cells or the entire animal, we found little to no effect of the loss of Snai3 in the entire animal or in T cell lineages. This finding provided the hypothesis that absence of Snai3 was mitigated, in part, by the presence of Snai2. To test this hypothesis we created Snai2/Snai3 double deficient mice. The developmental consequences of lacking both of these proteins was manifested in stunted growth, a paucity of offspring including a dramatic deficiency of female mice, and impaired immune cell development within the lymphoid lineages.


Conflict of interest statement

Competing Interests: The authors have declared that no competing interests exist.

Figures

Figure 1
Figure 1. Conditional Snai3 deletion strategy.
(A) The Snai3 WT genomic DNA region contains the Rnf166 gene 5 kb upstream and the MVD gene 10 kb downstream. The Snai3 gene consists of 5’ and 3’ untranslated regions (white boxes), three exons (black boxes), and two introns. Arrow marks the transcriptional start site (TSS). Primers used for genotyping mice and for QT-PCR of Snai3 transcript are labeled as P1-P4 and QT, respectfully, and listed in Supplemental Table 1. The Targeting Construct had a LoxP site inserted into the PacI site of intron one and the PL451 cassette inserted into the SalI site 2kb upstream of the TSS. (B) Homologous recombination created the Snai3 targeted genome containing unique 5’ PL451 and Knockin LoxP PCR products. The Neomycin (Neo) cassette was deleted via FLP-mediated recombination of Frt sites. (C) Cre recombinase activity deleted the Snai3 genomic region and created a new PCR product by bringing together primers P1 and P4, which are normally 6kb apart and unable to make a PCR product. Figure is not to scale.
Figure 2
Figure 2. Snai1-3 transcripts are differentially expressed in primary and secondary lymphoid organs of wild type mice.
RNA was isolated and cDNA synthesized as described in the Materials. Quantitative real-time RT-PCR was performed via LightCycler as described in the Materials. (A) cDNA from testes served as a positive control for all RT-PCR analysis. (B) Snai1-3 transcript analysis of cDNA generated from total thymus, spleen, and bone marrow. (C–E) RT-PCR of specific cell subsets demonstrating the distribution patterns of Snai1 (C), Snai2 (D), and Snai3 (E) expression. Three mice were analyzed for the testes. At least 4 mice were analyzed per immune cell type. Levels of Snai1-3 transcripts are relative to 1000 Actb transcripts per each individual sample. Data are represented by the mean ± SEM. One-way ANOVA with Bonferroni post hoc test: * p < 0.05, ** p < 0.01, *** p < 0.001.
Figure 3
Figure 3. Snai1-3 protein expression suggests post-translational regulation.
Whole cell lysates were generated from total thymus, spleen, bone marrow, and testes. Samples were subjected to immunoblot analysis as described in the Materials. (A–C) Samples were probed with primary antibodies specific for Snai1 (A), Snai2 (B), and Snai3 (C). Blots were probed for β-actin to verify equal protein loading. Representative blots are shown but similar results were generated for two independent mice.
Figure 4
Figure 4. Generation and Mendelian analysis of Snai2 and Snai3 double knockout (DKO) mice.
(A) Representative 2% agarose gels demonstrating genotyping of Snai2 and Snai3. WT and KO refer to primer sets specific for the wild type or knocked out allele. 1-4 refer to 4 separate experimental mice. Het = heterozygous control DNA, BL/6 = wild type control DNA (B) Analysis of all progeny derived from mating Snai2 +/- Snai3 -/- parents. Black bars indicate expected numbers while the open bars indicate actual progeny obtained per genotype. (C–D) Distribution of male (C) and female (D) DKO animals generated from Snai2 +/- Snai3 -/- parents. Animal numbers per group are represented by the “N” values (open bars) while predicted numbers based upon the numbers of males and females generated in the DKO colony are shown in the black bars. More total males of all three genotypes (about 2:1) were generated in this mouse mating scheme compared to females with all of the combined genotypes. χ2-test analysis for panels B, C, D demonstrates significance between predicted progeny genotypes and those obtained.
Figure 5
Figure 5. Snai2 and Snai3 DKO mice are developmentally stunted with ocular deformities.
(A) Representative photo of age and sex matched (males) WT and DKO mice. Animals are approximately 6 weeks of age and presented alongside a ruler for reference. (B) Representative photo of WT and DKO male facial ocular area. (C) Graphical representation comparing ages (weeks, wks) and weights (grams, g) of WT and DKO animals over 3 week intervals. One-way ANOVA with Bonferroni post hoc test: ** p < 0.01, *** p < 0.001.
Figure 6
Figure 6. Snai2 and Snai3 DKO lymphoid organs are reduced in size but present a healthy appearance.
(A) Representative photo of thymus, spleen, and bone marrow dissected from age and sex matched WT and DKO animals. Organs are presented with a ruler for reference. (B–C) Quantification of thymic (B) and splenic (C) mass among different iterations of Snai2 and Snai3 knockouts. % of Body Mass = (Organ Weight (mg) / Body Weight (mg)) X 100, One-way ANOVA with Bonferroni post hoc test: * p < 0.05.
Figure 7
Figure 7. Histological analysis of 4 week old DKO spleen and thymus.
Spleen and thymus were dissected from 4 week old Snai2+/- Snai3+/- and DKO animals. Organs were processed for histological analysis as described in the Materials. Tissue sections were cut to an approximate thickness of 10 µm. Representative images are shown for all genotypes and tissues assayed. (A) Splenic sections were left unstained and viewed by brightfield microscopy. 4x magnification of spleen sections from the Snai2+/- Snai3+/- and DKO. F = lymphoid follicle; R = red pulp. The DKO spleen is reduced in size compared to the Snai2+/- Snai3+/- spleen. (B) Thymus sections were stained with hematoxylin and eosin to differentiate between thymic cortex (darker stain in Snai2+/- Snai3+/-) and thymic medulla (lighter stain in Snai2+/- Snai3+/-): Snai2+/- Snai3+/- (left panel) and DKO (right panel). C = cortex; M = medulla. The DKO thymus is reduced in size compared to the Snai2+/- Snai3+/- thymus.
Figure 8
Figure 8. Histological analysis of six month DKO spleen and thymus tissues.
Spleen and thymus tissues were harvested from six month old mice and processed as described in the Materials. Tissue sections were cut to an approximate thickness of 10 µm. All images were captured at 4x magnification. Representative images are shown for all genotypes and tissues assayed with two different sections shown for the DKO samples. (A) Spleen samples from the animals as marked. Sections were kept unstained and viewed via light microscopy for easier assessment of follicular versus red pulp areas of the spleen. F = lymphoid follicle; R = red pulp (B) Thymus sections were stained with hematoxylin and eosin to differentiate between thymic cortex (darker stain) and thymic medulla (lighter stain). C = cortex; M = medulla. An * is shown in the DKO sample to highlight the localization of thymus-like epithelial tissue.
Figure 9
Figure 9. Double positive thymocytes are reduced in favor of an increased CD4+ single positive population in the Snai2 and Snai3 DKO.
FACS analysis was performed to assess T cell populations in the thymus (A), peripheral blood (B), and spleen (C). Cells were assayed for CD4 and CD8 cell surface staining. DP = CD4+CD8+ double positive cells, CD4 = CD4+ single positive, CD8 = CD8+ single positive, Results are presented as a percentage of total cells analyzed. One-way ANOVA with Bonferroni post hoc test: * p < 0.05, *** p < 0.001.
Figure 10
Figure 10. Snai2 and Snai3 DKO mice demonstrate a severe impairment in B cell development.
FACS analysis was performed to assess B cell populations in the bone marrow (A), peripheral blood (B), and spleen (C). B cell populations were assessed using surface staining for B220 and CD19. In the bone marrow (A), B220+CD19- (pre-pro-) and B220+CD19+ (pro-, pre-, immature, and mature re-circulating) cells were assayed. In the peripheral blood (B) and spleen (C), B cells were defined as B220+CD19+. Results are presented as a percentage of total cells analyzed. One-way ANOVA with Bonferroni post hoc test: ** p < 0.01, *** p < 0.001.
Figure 11
Figure 11. Myeloid populations are enhanced in the Snai2 and Snai3 DKO.
FACS analysis was performed to assess myeloid cell populations in the bone marrow (A), peripheral blood (B), and spleen (C). Cells were stained for CD11b and Gr1. Macrophages are identified by CD11b+ Gr1Int staining. Neutrophils (representative of granulocytes) are distinguished by CD11b+ Gr1Hi staining. Results are presented as a percentage of total cells analyzed. One-way ANOVA with Bonferroni post hoc test: * p < 0.05, ** p < 0.01, *** p < 0.001.
Figure 12
Figure 12. Circulating hematopoietic profile of six month old mice.
Retro-orbital bleeds were performed three times for each animal assayed. Three mice were analyzed for WT, Snai2+/- Snai3-/-, and Snai2-/- Snai3+/- genotypes. Only one DKO animal survived to six months of age. FACS was used to assess overall percentages (A) and absolute numbers of each lineage (B) within the peripheral blood. Significance was tested using one-way ANOVA followed by the Bonferroni post hoc test. ** p < 0.01, *** p < 0.001 (C) Snai2-/- Snai3+/- and DKO animals display increased lymphocytes and neutrophils in circulating blood. Cytospins were performed with 30 µl of peripheral blood. Slides were stained with Wright-Giemsa to differentiate between blood cell types. 20x images were photographed and representatives for each genotype are shown.

Similar articles

Cited by

References

    1. Barrallo-Gimeno A, Nieto MA (2009) Evolutionary history of the Snail/Scratch superfamily. Trends Genet 25: 248-252. doi:10.1016/j.tig.2009.04.001. PubMed: 19427053. - DOI - PubMed
    1. Manzanares M, Blanco MJ, Nieto MA (2004) Snail3 orthologues in vertebrates: divergent members of the Snail zinc-finger gene family. Dev Genes Evol 214: 47-53. doi:10.1007/s00427-003-0373-1. PubMed: 14655014. - DOI - PubMed
    1. Boulay JL, Dennefeld C, Alberga A (1987) The Drosophila developmental gene snail encodes a protein with nucleic acid binding fingers. Nature 330: 395-398. doi:10.1038/330395a0. PubMed: 3683556. - DOI - PubMed
    1. Nieto MA (2002) The snail superfamily of zinc-finger transcription factors. Nat Rev Mol Cell Biol 3: 155-166. doi:10.1038/nrm757. PubMed: 11994736. - DOI - PubMed
    1. Soleimani VD, Yin H, Jahani-Asl A, Ming H, Kockx CE et al. (2012) Snail Regulates MyoD Binding-Site Occupancy to Direct Enhancer Switching and Differentiation-Specific Transcription in Myogenesis. Mol: Cell Publishing House. - PMC - PubMed

Publication types

LinkOut - more resources