. 2013 Jul 18;8(7):e69306.
doi: 10.1371/journal.pone.0069306. Print 2013.

Genetics and evolution of the Salmonella galactose-initiated set of o antigens

Affiliations

Genetics and evolution of the Salmonella galactose-initiated set of o antigens

Peter R Reeves et al. PLoS One. .

Abstract

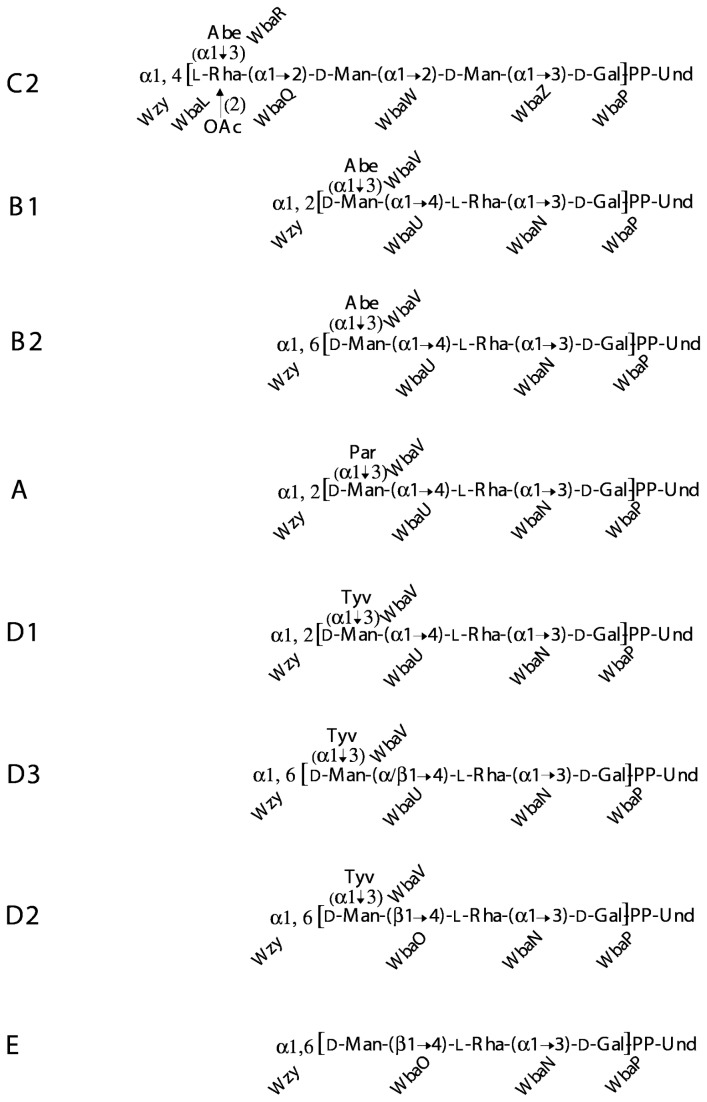
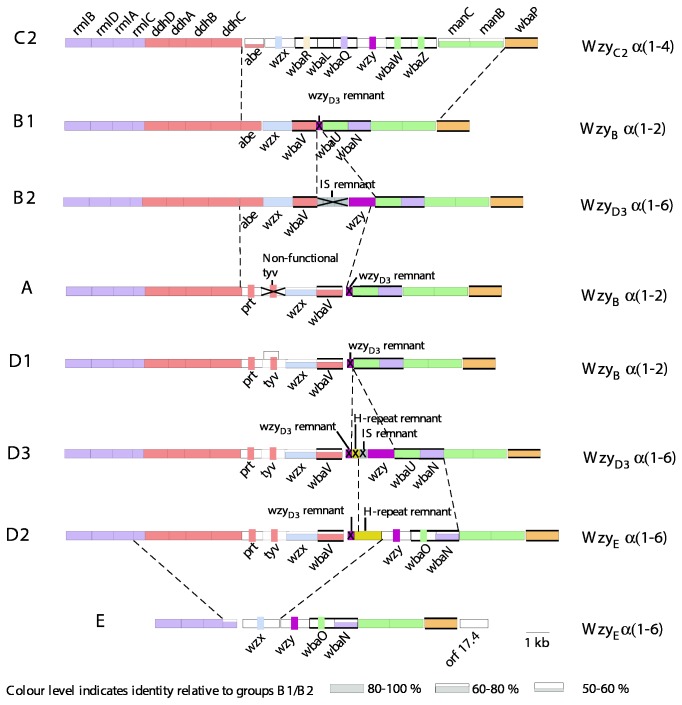
This paper covers eight Salmonella serogroups, that are defined by O antigens with related structures and gene clusters. They include the serovars that are now most frequently isolated. Serogroups A, B1, B2, C2-C3, D1, D2, D3 and E have O antigens that are distinguished by having galactose as first sugar, and not N-acetyl glucosamine or N-acetyl galactosamine as in the other 38 serogroups, and indeed in most Enterobacteriaceae. The gene clusters for these galactose-initiated appear to have entered S. enterica since its divergence from E. coli, but sequence comparisons show that much of the diversification occurred long before this. We conclude that the gene clusters must have entered S. enterica in a series of parallel events. The individual gene clusters are discussed, followed by analysis of the divergence for those genes shared by two or more gene clusters, and a putative phylogenic tree for the gene clusters is presented. This set of O antigens provides a rare case where it is possible to examine in detail the relationships of a significant number of O antigens. In contrast the more common pattern of O-antigen diversity within a species is for there to be only a few cases of strains having related gene clusters, suggesting that diversity arose through gain of individual O-antigen gene clusters by lateral gene transfer, and under these circumstances the evolution of the diversity is not accessible. This paper on the galactose-initiated set of gene clusters gives new insights into the origins of O-antigen diversity generally.


Conflict of interest statement

Competing Interests: The authors have declared that no competing interests exist.

Figures

Figure 1
Figure 1. Structures of the Galactose-initiated O units of S. enterica.
A single O unit is shown as it is built on the lipid carrier, Und-PP. The transferase responsible for the addition of each sugar of the O unit is shown. The repeat unit is given in square brackets. The Wzy polymerisation linkage is also shown to the left of the repeat unit. Sugar abbreviations: Abe, abequose; Gal, galactose; Man, mannose; Par, paratose; Rha, rhamnose; Tyv, Tyvelose.
Figure 2
Figure 2. Synthesis of the S. enterica group B O antigen.
The three stages of O-unit synthesis are shown: 1. Nucleotide-sugar biosynthesis (red), 2. O-unit assembly (blue), and 3. O-unit processing (purple). The proteins involved at each step are indicated. The final polymerised O-antigen chain is indicated by circles, where n indicates a variable number of repeat units present. Modified from [9]. Sugar abbreviations: Abe, abequose; Gal, galactose; Man, mannose; Rha, rhamnose.
Figure 3
Figure 3. Biosynthesis of O-antigen-related NDP-linked sugars.
Enzymes involved at each step are indicated. Sugar structures are shown for the end products and for one branch point intermediate.
Figure 4
Figure 4. O-antigen gene clusters of the Galactose-initiated S. enterica serogoups.
Genes are colour coded by synthesis pathways. Height of the coloured blocks indicates level of sequence similarity to group B1 genes; if little or no sequence similarity, the gene is colour coded by a vertical strip according to the pathway. Transferase genes are indicated by bold horizontal boundaries. Major junctions between blocks of genes with different relationships or levels of similarity are indicated by dashed lines. Gene names are shown and gene remnants labelled. The O-unit polymerase is shown on the right, named after the group in which it was first found, together with the linkage that it forms. Drawn to scale.
Figure 5
Figure 5. The 6 known group B1 and B2 forms of the region between wbaV and wbaU.
This is an expansion of a small segment of Figure 4 to show detail of the differences. The box insert has a cartoon of the clusters as shown in Figure 4. Forms differ in the presence or absence of insertion sequences, and either a non-functional wzy remnant (marked with an asterisk; characteristic of B1), or the complete wzy gene that characterises B2. IS types are colour-coded and labelled. Ends of sequence deletion/insertions are indicated by dashed lines, and the junctions with the neighbouring wbaV and wbaU genes are indicated by solid lines. A representative of each form is named on the right, as is information regarding segment length, the number of isolates within each form and their subspecies distribution. The proposed diversification from an ancestral Schleissheim form to other forms is shown by red arrows. Dashed arrow lines indicate alternative pathways. Modified from [39]..
Figure 6
Figure 6. Relationships of group D1, D2 and E gene clusters.
Gene clusters of groups D1, D2 and E are shown, with the D2 regions proposed to be derived from D1 and E indicated by red connecting lines. Genes are colour-coded as in other figures. Sequence alignments of D2 with D1 (above) and with E (below) are shown for the junctions between homologous and non-homologous sequence, with the E. coli K-12 H-repeat element, yhhI, used for the H-repeat comparison. Cartoons of 2 O-unit repeat structures of each group are shown to the right to highlight the structural differences that relate to the genetic differences between clusters: purple, polymerisation linkage; green, Man-Rha glycosidic linkage; orange, DDH sidebranch. Abbreviations: G, galactose; M, mannose; R, rhamnose; T, tyvelose.
Figure 7
Figure 7. Model for the origin of the D2 gene cluster by “recombination” between groups E and D1 gene clusters.
An H-repeat element present on a plasmid-based E-like gene cluster mediates a transposition event into the D1 gene cluster, with “resolution” of the intermediate cointegrate by homologous recombination in wbaN, instead of by a resolvase. Model based on replicative transposition. Modified from [32]..
Figure 8
Figure 8. Comparison of the segments between the wbaV and wbaU genes of Groups D1, D3, B2 and B1.
Base positions are indicated and are taken from either published or deposited sequences, as indicated in Table 1. The junctions with the neighbouring wbaV and wbaU genes are indicated by solid lines. A box cartoon to the left shows the gene clusters from Figure 4. Red arrows indicate a proposed diversification pathway of segments.
Figure 9
Figure 9. Group A triplication.
Alignment of group A sequences with and without the triplication of the wbaV region. Strain names are indicated on the left (see Table 1 for details). Both strains have identical gene clusters with the exception of the triplication of the region indicated. Drawn to scale.
Figure 10
Figure 10. O-unit serogroup modification in Group E.
The group EO unit is modified by phage genes that result in either glucosylation, O-acetylation, or a different O-unit polymerisation linkage being produced. The moieties undergoing change are circled and the differences define the 4 known group E structural variants: E1, E2, E3 and E4. The e15 and e34 phage are well known and modification to form an E4 variant is thought to be carried out by a P22-like phage (see text for details).
Figure 11
Figure 11. Sequences comparisons for the junctions in alignments of group B with group E or group C2-C3 gene clusters.
Pairwise alignments of nucleotide sequences were used to generate plots. Base differences or gaps were given a value of 1, identical bases a value of 0. Divergence was plotted using the values for 30 bp non-overlapping segments for each alignment. a) groups B1 and C2-C3 ddhD-abe segments; b) groups B1 and C2-C3 manC-wbaP segments; c). groups B1 and E rmlADC genes; d) groups B1 and E wbaN-wbaP segments. Divergence trends are indicated with solid lines. Gene clusters for groups B, C2-C3 and E are shown in the centre for reference.
Figure 12
Figure 12. Sequence comparisons for the group B1, D1 and D3 wzx-wbaV gene blocks.
Pairwise alignments of nucleotide sequences were used to generate plots. Base differences or gaps were given a value of 1, identical bases a value of 0. Divergence was plotted using these values over 30 bp non-overlapping bases of each alignment. Groups B1 and D1 are in the upper panel; groups B1 and D3 in the lower panel. Divergence trends are indicated with solid lines. Gene clusters for B1, D1 and D3 are shown for reference.
Figure 13
Figure 13. Model for evolution of the S. enterica Gal-initiated O-antigen gene clusters.
The model is based on the assumption that the ddh genes were never present in group E. See text for details and other possibilities.

Similar articles

Cited by

References

    1. Kauffmann F (1966) Enterobacteriaceae. Copenhagen: Ejnar Munksgaad.
    1. Guibourdenche M, Roggentin P, Mikoleit M, Fields PI, Bockemühl J et al. (2010) Supplement 2003-2007 (No. 47) to the White-Kauffmann-Le Minor scheme. Res Microbiol 161: 26-29. doi:10.1016/j.resmic.2009.10.002. PubMed: 19840847. - DOI - PubMed
    1. Boyd EF, Wang FS, Whittam TS, Selander RK (1996) Molecular genetic relationships of the Salmonellae . Appl Environ Microbiol 62: 804-808. PubMed: 8975610. - PMC - PubMed
    1. McQuiston JR, Herrera-Leon S, Wertheim BC, Doyle J, Fields PI et al. (2008) Molecular phylogeny of the Salmonellae: relationships among Salmonella species and subspecies determined from four housekeeping genes and evidence of lateral gene transfer events. J Bacteriol 190: 7060-7067. doi:10.1128/JB.01552-07. PubMed: 18757540. - DOI - PMC - PubMed
    1. Valvano MA (2003) Export of O-specific lipopolysaccharide. Front Biosci 8: S452-S471. doi:10.2741/1079. PubMed: 12700099. - DOI - PubMed

Publication types

LinkOut - more resources