

A modified entropy-based approach for identifying gene-gene interactions in case-control study
- PMID: 23874943
- PMCID: PMC3715501
- DOI: 10.1371/journal.pone.0069321
A modified entropy-based approach for identifying gene-gene interactions in case-control study
Abstract
Gene-gene interactions may play an important role in the genetics of a complex disease. Detection and characterization of gene-gene interactions is a challenging issue that has stimulated the development of various statistical methods to address it. In this study, we introduce a method to measure gene interactions using entropy-based statistics from a contingency table of trait and genotype combinations. We also developed an exploration procedure by using graphs. We propose a standardized relative information gain (RIG) measure to evaluate the interactions between single nucleotide polymorphism (SNP) combinations. To identify the k (th) order interactions, contingency tables of trait and genotype combinations of k SNPs are constructed, with which RIGs are calculated. The RIGs are standardized using the mean and standard deviation from the permuted datasets. SNP combinations yielding high standardized RIG are chosen for gene-gene interactions. Detection of high-order interactions and comparison of interaction strengths between different orders are made possible by using standardized RIG. We have applied the proposed standardized entropy-based method to two types of data sets from a simulation study and a real genetic association study. We have compared our method and the multifactor dimensionality reduction (MDR) method through power analysis of eight different genetic models with varying penetrance rates, number of SNPs, and sample sizes. Our method shows successful identification of genetic associations and gene-gene interactions both in simulation and real genetic data. Simulation results suggest that the proposed entropy-based method is better able to detect high-order interactions and is superior to the MDR method in most cases. The proposed method is well suited for detecting interactions without main effects as well as for models including main effects.
Conflict of interest statement
Figures
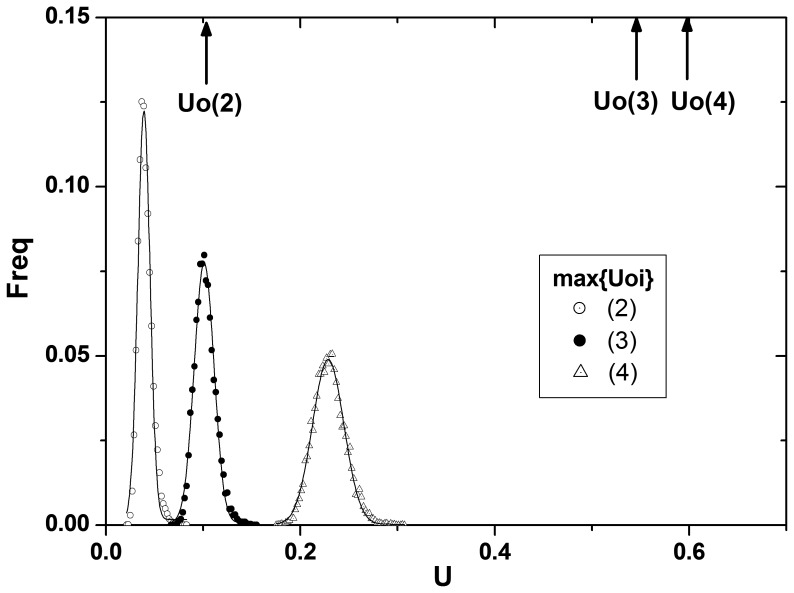
 in each order of interactions. The distributions are the null distribution of
  obtained by collecting the maximum
  s from each permuted data. Order of interaction is denoted within the parentheses.
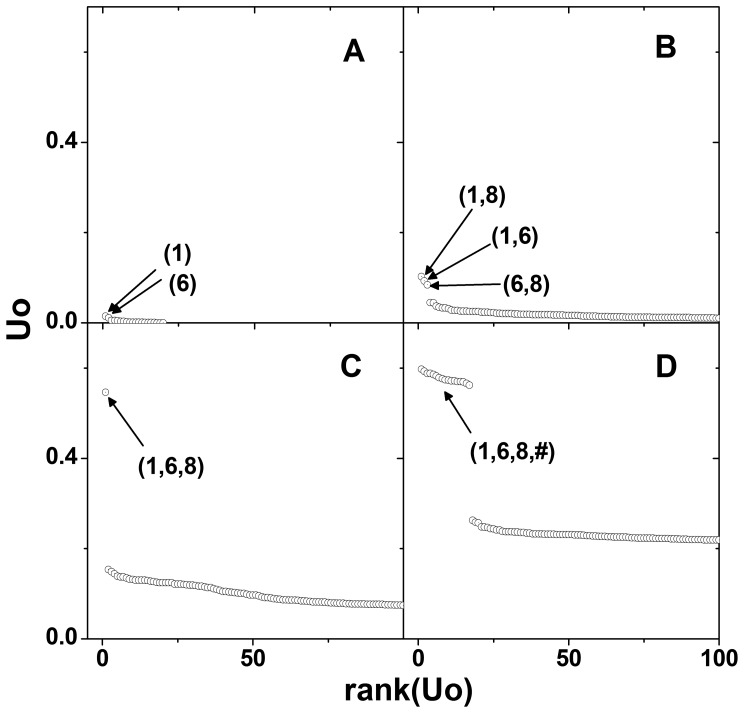
 , is plotted against the rank determined by the magnitude of
  . Only the top 100 ranked
  s are plotted for each order of interaction. Top ranked SNP names are denoted within the parentheses.
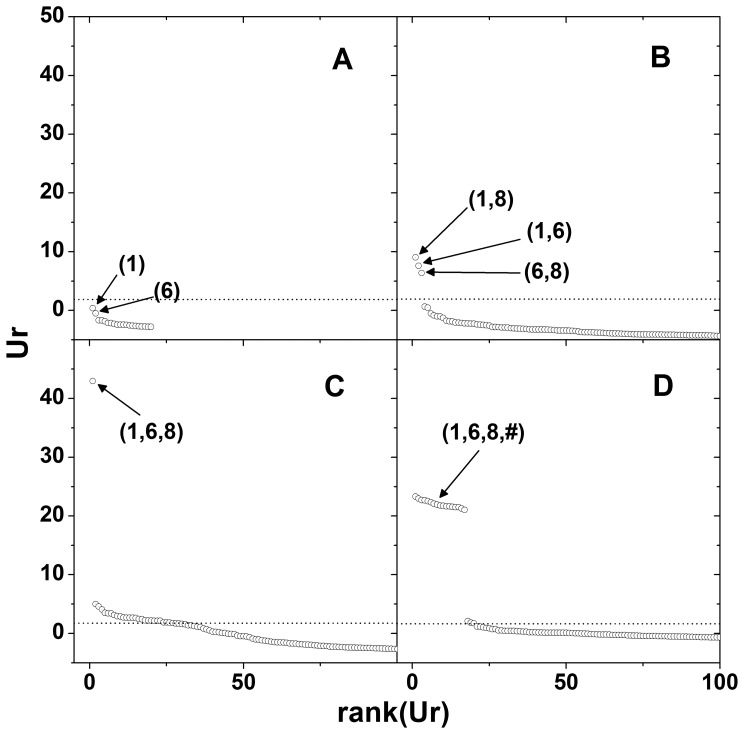
 , is plotted against the rank determined by the magnitude of
  . Open-source sample set is used to show the plausibility of using
  . Only the top 100 ranked
  s are plotted for each order of interaction. Top ranked SNP names are denoted in parentheses. The dotted lines show the upper 5% cut-off values of
  in the empirical null distribution. SNP combinations above the line may be interpreted as significant at 5% significance level.
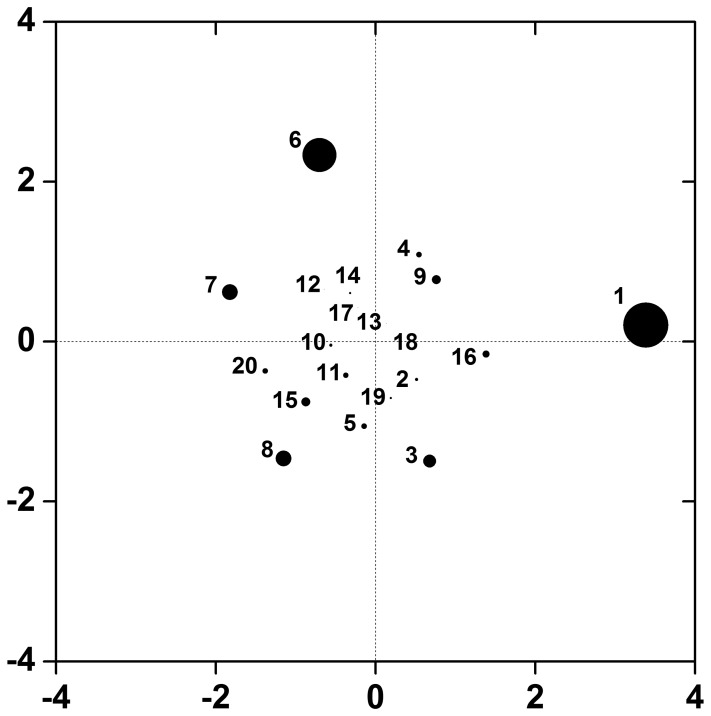
 of the 2nd order interactions. The distance between two points approximates the interaction between the corresponding SNPs. The size of the points is proportional to the size of the main effects.
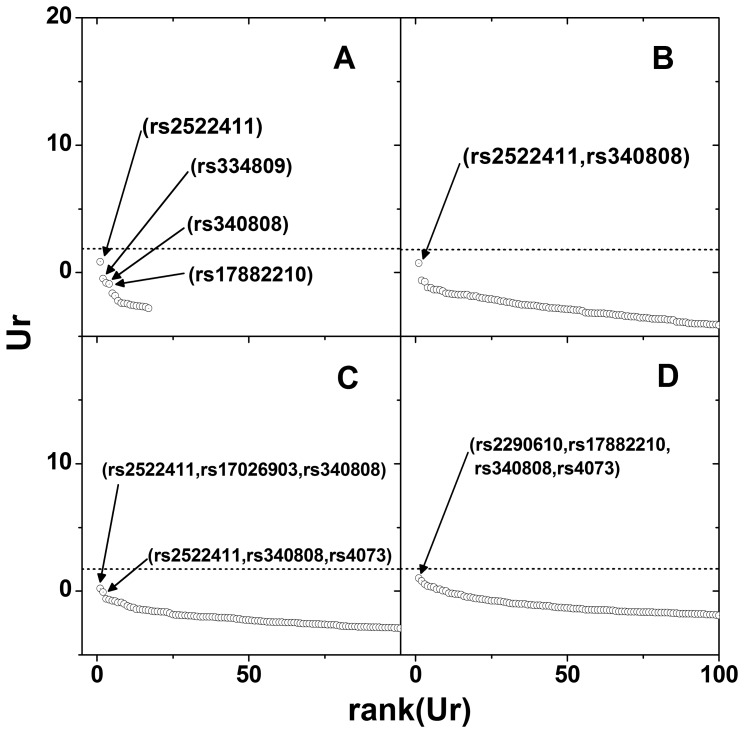
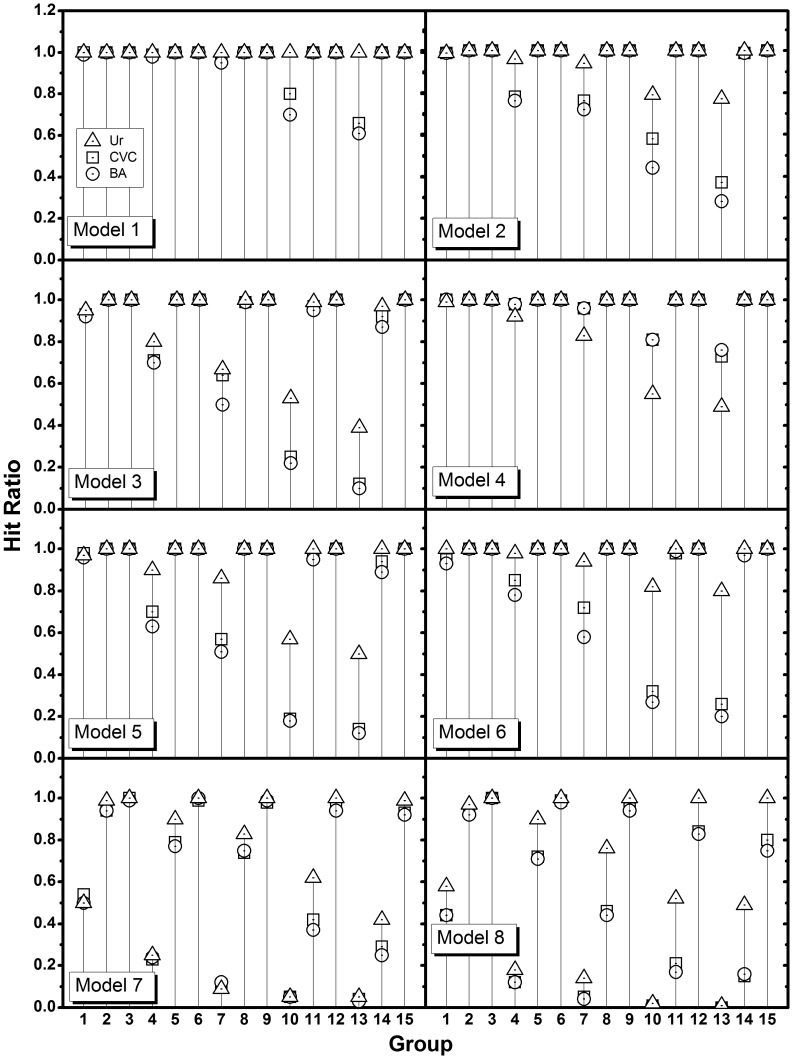
 , CVC, and BA are compared. Groups 1, 2, and 3 have the same number of SNPs (10), and the numbers of samples increase with the group numbers (400, 1000, 2000), repeating the same for the next 3 groups with an increased number of SNPs (50), and so on. See Table 3 for details. The power of
  is shown to be higher than the powers of MDR with CVC or BA. The superiority is clearer, especially for the groups 1, 4, 7, 10, 13 in which the number of samples are insufficient when compared to the number of SNPs. As the number of SNPs increases, the difference in power becomes larger.
References
-
- Zhang H, Bonney G (2000) Use of classification trees for association studies. Genet. Epidemiol. 19: 323–332. - PubMed
-
- Sheriff A, Ott J (2001) Applications of neural networks for gene finding. Adv. Genet. 42 287–297. - PubMed
-
- Kooperberg C, Ruczinski I (2005) Identifying interacting SNPs using Monte Carlo logic regression. Genet. Epidemiol. 28: 157–170. - PubMed
-
- Hosmer DW, Lemeshow D (2000) Applied logistic regression, 2nd edn. New York: John Wiley and Sons.
Publication types
MeSH terms
LinkOut - more resources
Full Text Sources
Other Literature Sources
