. 2013 Jul 18;8(7):e69363.
doi: 10.1371/journal.pone.0069363. Print 2013.

Turnover of amyloid precursor protein family members determines their nuclear signaling capability

Affiliations

Turnover of amyloid precursor protein family members determines their nuclear signaling capability

Manuel T Gersbacher et al. PLoS One. .

Abstract

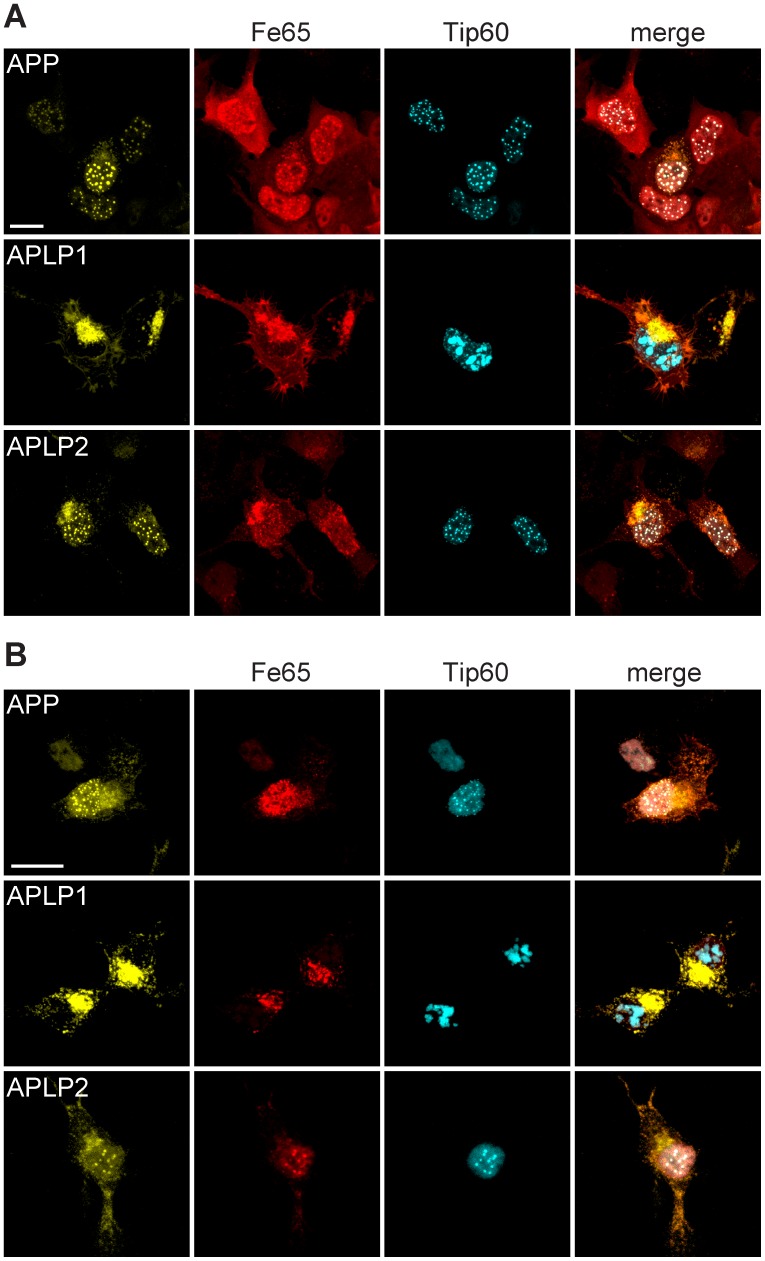
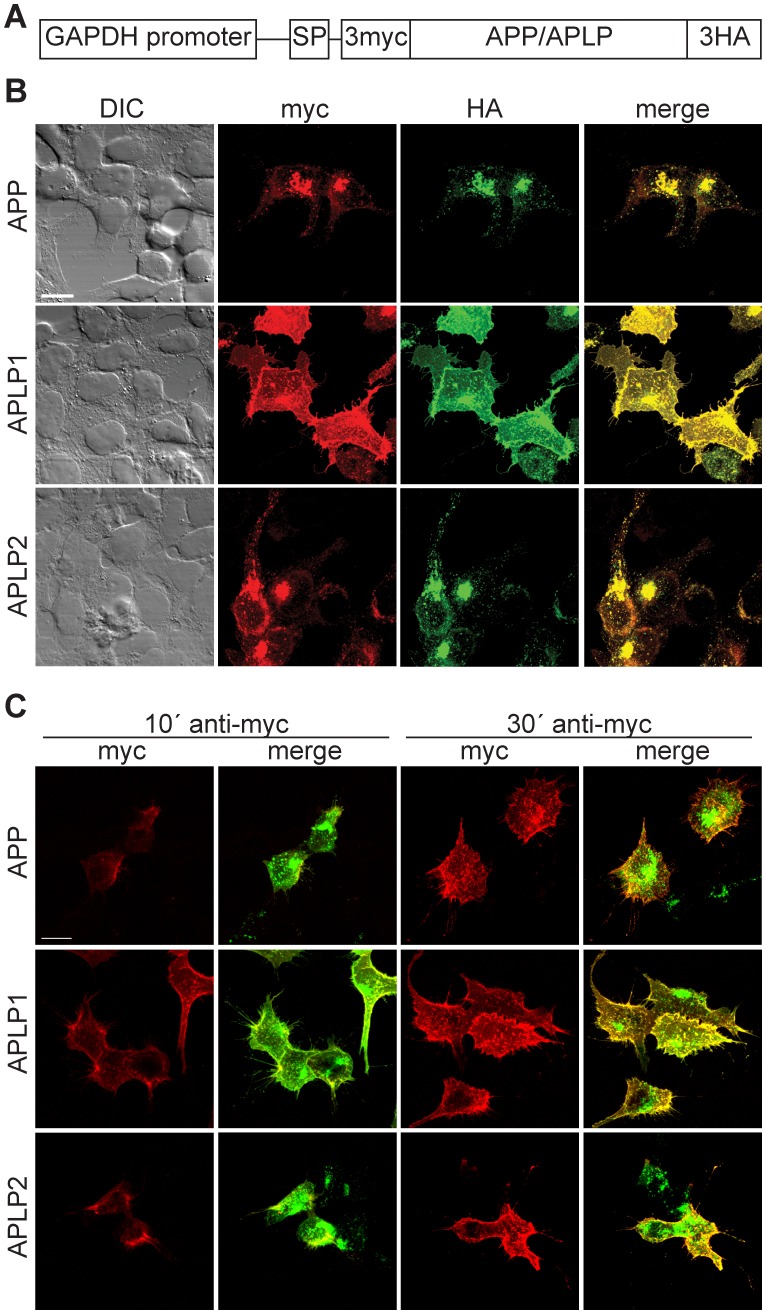
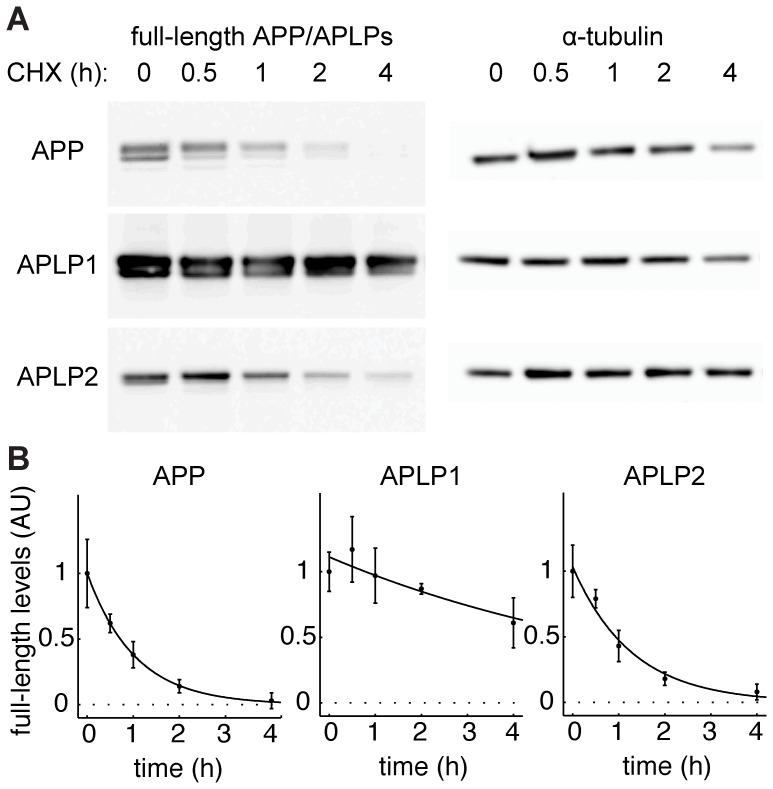
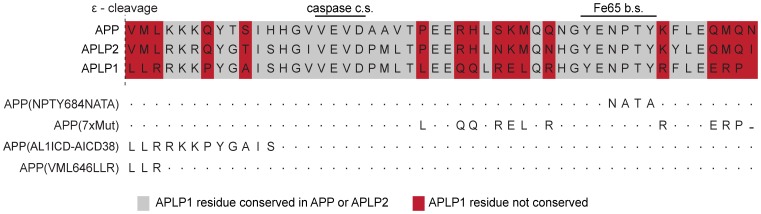
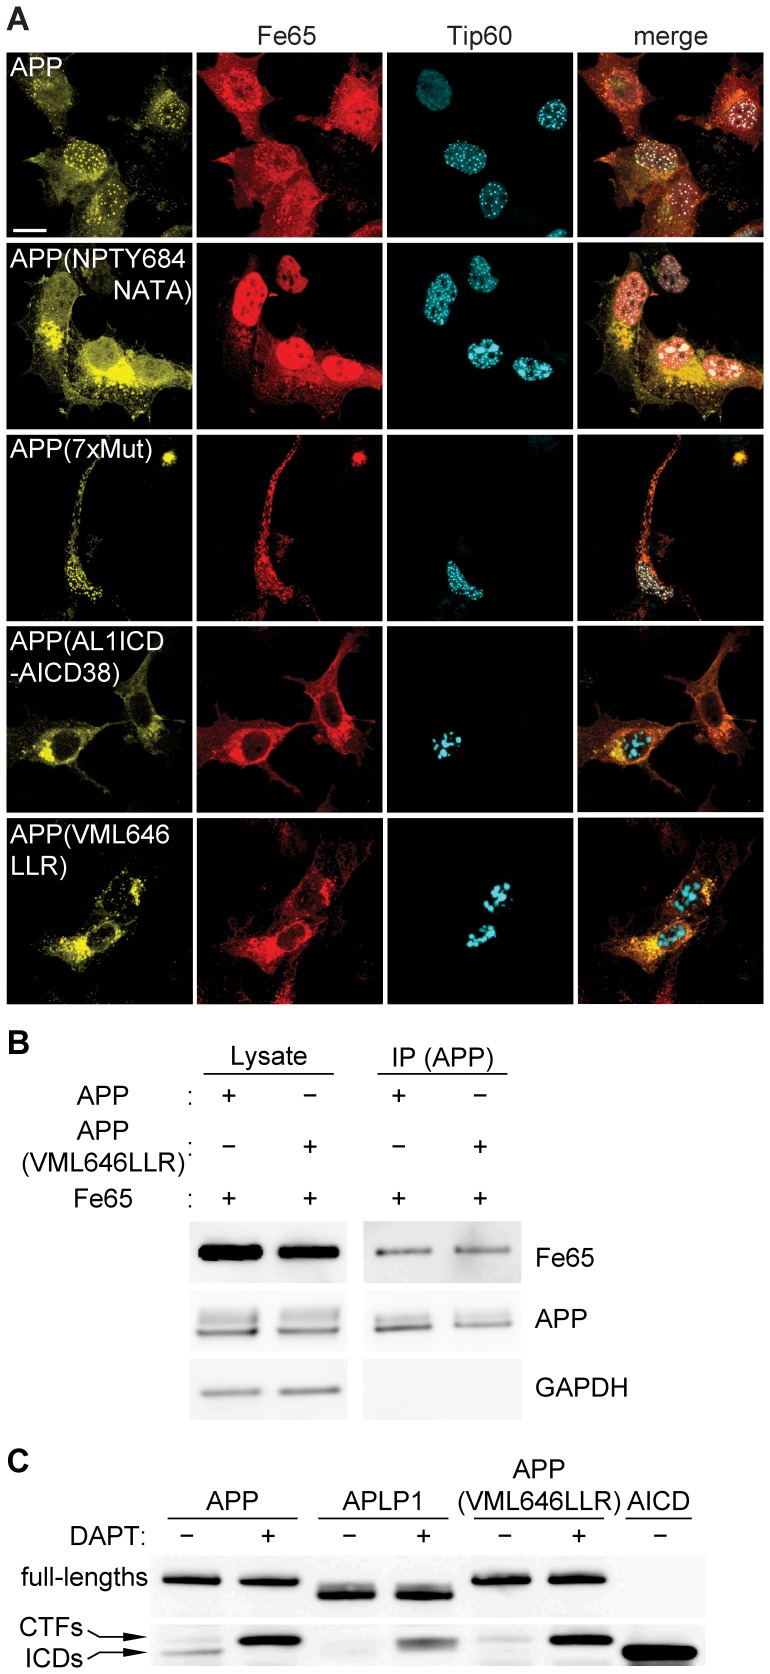
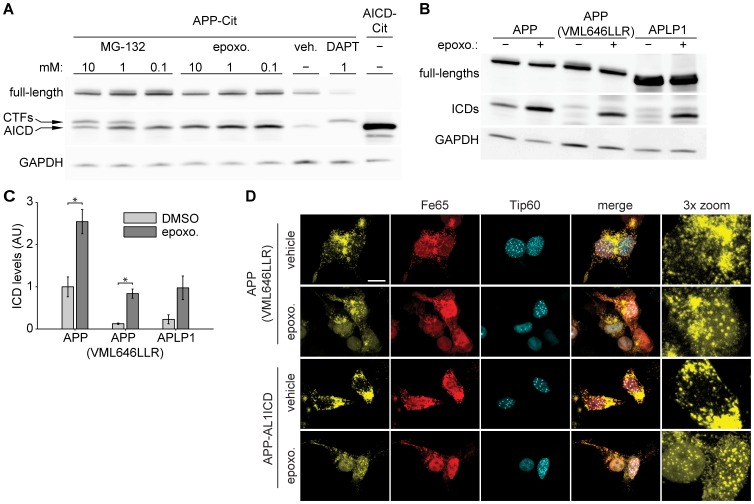
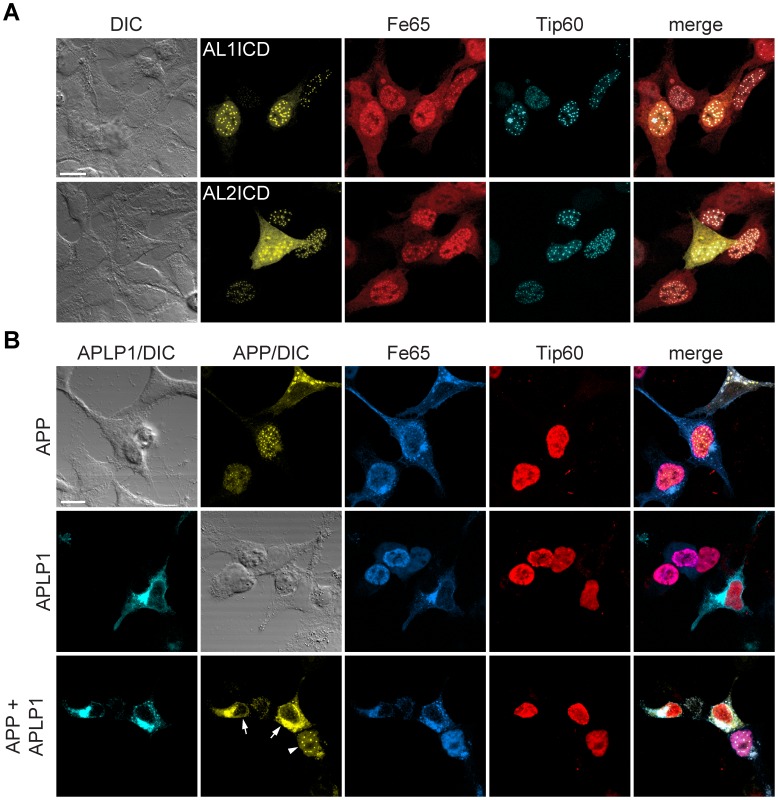
The amyloid precursor protein (APP) as well as its homologues, APP-like protein 1 and 2 (APLP1 and APLP2), are cleaved by α-, β-, and γ-secretases, resulting in the release of their intracellular domains (ICDs). We have shown that the APP intracellular domain (AICD) is transported to the nucleus by Fe65 where they jointly bind the histone acetyltransferase Tip60 and localize to spherical nuclear complexes (AFT complexes), which are thought to be sites of transcription. We have now analyzed the subcellular localization and turnover of the APP family members. Similarly to AICD, the ICD of APLP2 localizes to spherical nuclear complexes together with Fe65 and Tip60. In contrast, the ICD of APLP1, despite binding to Fe65, does not translocate to the nucleus. In addition, APLP1 predominantly localizes to the plasma membrane, whereas APP and APLP2 are detected in vesicular structures. APLP1 also demonstrates a much slower turnover of the full-length protein compared to APP and APLP2. We further show that the ICDs of all APP family members are degraded by the proteasome and that the N-terminal amino acids of ICDs determine ICD degradation rate. Together, our results suggest that different nuclear signaling capabilities of APP family members are due to different rates of full-length protein processing and ICD proteasomal degradation. Our results provide evidence in support of a common nuclear signaling function for APP and APLP2 that is absent in APLP1, but suggest that APLP1 has a regulatory role in the nuclear translocation of APP family ICDs due to the sequestration of Fe65.


Conflict of interest statement

Competing Interests: The authors have declared that no competing interests exist.

Figures

Figure 1
Figure 1. ICDs derived from APP and APLP2, but not APLP1, form nuclear AFT complexes.
(A) Confocal fluorescence images of HEK cells transfected with HA-Fe65, CFP-Tip60, and APP-Cit (top row), HA-Fe65, CFP-Tip60, and APLP1-Cit (middle row), HA-Fe65, CFP-Tip60, and APLP2-Cit (bottom row). (B) Confocal fluorescence images of N2a cells transfected with HA-Fe65, CFP-Tip60, and APP-Cit (top row), HA-Fe65, CFP-Tip60, and APLP1-Cit (middle row), HA-Fe65, CTP-Tip60, and APLP2-Cit (bottom row). Note the formation of spherical AFT complexes in the nucleus of cells transfected with APP or APLP2. In contrast expression of APLP1 resulted in accumulation of Fe65 and APLP1 in extranuclear compartments and at the plasma membrane, whereas Tip60 localized to nuclear speckles. Scale bars represent 13 µm.
Figure 2
Figure 2. APP and APLP2 differ in their subcellular localization from APLP1.
(A) Schematic presentation of APP/APLP-expression constructs with N-terminal 3 myc and C-terminal 3HA tags. The 3-myc tag is preceded by the APP signal peptide (SP) to ensure membrane insertion. (B) Confocal fluorescence images of HEK cells expressing APP (top row), APLP1 (middle row), or APLP2 (bottom row) and stained with anti-myc and anti-HA antibodies. APP and APLP2 showed a more prominent intracellular localization to vesicular structures, whereas APLP1 mostly localized to the cell membrane. (C) Confocal fluorescence images of HEK cells expressing APP (top row), APLP1 (middle row) or APLP2 (bottom row) after live antibody incubation. Incubation of cells with anti-myc antibody at 4°C for 10 minutes results in surface labeling, especially of APLP1. After 30 minutes of anti-myc antibody incubation, cell surface signals of APP and APLP2 reached a similar strength as APLP1. Cells were counter-stained with anti HA antibody after fixation. Scale bars represent 13 µm.
Figure 3
Figure 3. APP and APLP2 have a higher protein turnover than APLP1.
(A) Western blot analysis of HEK cells transfected with C-terminally HA-tagged APP/APLPs after indicated times of protein synthesis inhibition with cycloheximide (CHX). Western blots were probed with anti-HA antibody. Note the strong accumulation of APLP1 as compared to APP and APLP2. (B) APP/APLP full-length levels from A were normalized to α-tubulin. Mean ± SEM of n = 3 are shown for each time point. Data was fitted to exponential functions by the least square approach. R2 (APP) = 0.99; R2 (APLP1) = 0.82; R2 (APLP2) = 0.98.
Figure 4
Figure 4. Nuclear signaling capability of APP family members is mediated by the intracellular domain.
(A) Schematic representation of wildtype and chimeric APP/APLP1 constructs. (B) Confocal fluorescence pictures of HEK cells cotransfected with HA-Fe65, CFP-Tip60 and the chimeric constructs APP-AL1ICD-Cit (top row) or APLP1-AICD-Cit (bottom row). Note that AFT complexes are formed in cells expressing APLP1-AICD but not APP-AL1ICD. Scale bar represents 13 µm. (C) Western blot analysis of HEK cells transfected with wildtype or chimeric APP/APLP1 constructs after 24-hour treatment with the γ-secretase inhibitor DAPT. Western blots were probed with anti-HA antibody and accumulation of CTFs was observed with all constructs. (D) Western blot analysis of HEK cells transfected with C-terminally HA-tagged APP/APLP after indicated times of protein synthesis inhibition with cycloheximide (CHX).
Figure 5
Figure 5. APP family members show high sequence homology.
Schematic presentation of APP family ICD sequences and APP/APLP1 mutations. c.s.: cleavage site; b.s.: binding site.
Figure 6
Figure 6. N-terminal residues of APP family ICDs are crucial for nuclear signaling capability.
(A) Confocal fluorescence images of HEK cells transfected with HA-Fe65, CFP-Tip60 and cotransfected with APP-Cit or the indicated APP-Cit mutation constructs. Scale bar represents 13 µm. (B) Co-immunoprecipitation of SBP-tagged APP or APP(VML646LLR) together with HA-tagged Fe65 using Dynabeads. (C) Western blot analysis of HEK cells transfected with APP-Cit, APLP1-Cit or APP(VML646LLR)-Cit constructs after 24 hour treatment with the γ-secretase inhibitor DAPT. AICD-Cit transfected cell lysate was loaded to identify ICD bands and the membrane was probed with anti-GFP antibody.
Figure 7
Figure 7. Nuclear localization of APP family ICDs is regulated by different proteasomal degradation rates.
(A) Western blot analysis of HEK cells transfected with APP-Cit followed by 6 h treatment with indicated concentration of MG-132 or epoxomicin. APP-Cit transfected HEK cells treated with DMSO or DAPT and AICD-Cit transfected cells were loaded to identify CTFs and AICD bands. Membranes were probed with anti-GFP antibody. Note that MG-132 inhibits the proteasome and at higher concentrations also γ-secretase, whereas epoxomicin is a specific proteasome inhibitor. (B) Western blot analysis of HEK cells transfected with APP-Cit, APLP1-Cit or APP(VML646LLR)-Cit constructs followed by 6 hours of proteasome inhibition with epoxomicin or DMSO control treatment. The membrane was probed with anti-GFP antibody and GAPDH was used as a loading control. In the absence of proteasome inhibition ICDs generated from APP are clearly visible. (C) Quantification of ICD levels from B. Mean ± SEM of n = 3 are shown (p<0.05, t-test). (D) Confocal fluorescence images of HEK cells transfected with HA-Fe65, CFP-Tip60 and cotransfected with APP(VML646LLR)-Cit (upper rows) or chimeric APP-AL1ICD-Cit (bottom rows) mutation constructs with 6 hours epoxomicin or DMSO control treatment. Note that AFT complexes are formed after epoxomicin treatment. Scale bar represents 13 µm.
Figure 8
Figure 8. APLP1 expression prevents localization of AICD to AFT complexes.
(A) Confocal fluorescence images of HEK cells transfected with HA-Fe65, CFP-Tip60 and Cit-AL1ICD (top row) or Cit-AL2ICD (bottom row). Note the nuclear localization of Al1ICD to nuclear complexes. (B) Confocal fluorescence images of HEK cells transfected with HA-Fe65, Myc-Tip60 and cotransfected with APP-Cit (top row) APLP1-Cer (middle row) or both (bottom row). Note that AFT complex formation (arrowhead) was ablated in cells expressing APP as well as APLP1 (arrows). Scale bars represent 13 µm.

Similar articles

Cited by

References

    1. Kang J, Lemaire HG, Unterbeck A, Salbaum JM, Masters CL, et al. (1987) The precursor of Alzheimer’s disease amyloid A4 protein resembles a cell-surface receptor. Nature 325: 733–736. - PubMed
    1. De Strooper B, Annaert W (2000) Proteolytic processing and cell biological functions of the amyloid precursor protein. J Cell Sci 113 (Pt 11): 1857–1870. - PubMed
    1. Hardy J, Selkoe DJ (2002) The amyloid hypothesis of Alzheimer’s disease: progress and problems on the road to therapeutics. Science 297: 353–356. - PubMed
    1. von Rotz RC, Kohli BM, Bosset J, Meier M, Suzuki T, et al. (2004) The APP intracellular domain forms nuclear multiprotein complexes and regulates the transcription of its own precursor. J Cell Sci 117: 4435–4448. - PubMed
    1. Weidemann A, Eggert S, Reinhard FB, Vogel M, Paliga K, et al. (2002) A novel epsilon-cleavage within the transmembrane domain of the Alzheimer amyloid precursor protein demonstrates homology with Notch processing. Biochemistry 41: 2825–2835. - PubMed

Publication types

MeSH terms