Inhibition of inducible heat shock protein-70 (hsp72) enhances bortezomib-induced cell death in human bladder cancer cells
- PMID: 23874968
- PMCID: PMC3715471
- DOI: 10.1371/journal.pone.0069509
Inhibition of inducible heat shock protein-70 (hsp72) enhances bortezomib-induced cell death in human bladder cancer cells
Abstract
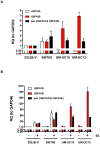
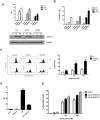
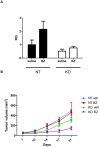
The proteasome inhibitor bortezomib (Velcade) is a promising new agent for bladder cancer therapy, but inducible cytoprotective mechanisms may limit its potential efficacy. We used whole genome mRNA expression profiling to study the effects of bortezomib on stress-induced gene expression in a panel of human bladder cancer cell lines. Bortezomib induced strong upregulation of the inducible HSP70 isoforms HSPA1A and HSPA1B isoforms of Hsp72 in 253J B-V and SW780 (HSPA1A(high)) cells, but only induced the HSPA1B isoform in UM-UC10 and UM-UC13 (HSPA1A(low)) cells. Bortezomib stimulated the binding of heat shock factor-1 (HSF1) to the HSPA1A promoter in 253JB-V but not in UM-UC13 cells. Methylation-specific PCR revealed that the HSPA1A promoter was methylated in the HSPA1A(low) cell lines (UM-UC10 and UM-UC13), and exposure to the chromatin demethylating agent 5-aza-2'-deoxycytidine restored HSPA1A expression. Overexpression of Hsp72 promoted bortezomib resistance in the UM-UC10 and UM-UC13 cells, whereas transient knockdown of HSPA1B further sensitized these cells to bortezomib, and exposure to the chemical HSF1 inhibitor KNK-437 promoted bortezomib sensitivity in the 253J B-V cells. Finally, shRNA-mediated stable knockdown of Hsp72 in 253J B-V promoted sensitivity to bortezomib in vitro and in tumor xenografts in vivo. Together, our results provide proof-of-concept for using Hsp72 inhibitors to promote bortezomib sensitivity in bladder cancers and suggest that selective targeting of HSPA1B could produce synthetic lethality in tumors that display HSPA1A promoter methylation.
Conflict of interest statement
Figures


Similar articles
-
Proteomic identification of aldo-keto reductase AKR1B10 induction after treatment of colorectal cancer cells with the proteasome inhibitor bortezomib.Mol Cancer Ther. 2009 Jul;8(7):1995-2006. doi: 10.1158/1535-7163.MCT-08-0987. Epub 2009 Jun 30. Mol Cancer Ther. 2009. PMID: 19567817
-
Hsp72 controls bortezomib-induced HepG2 cell death via interaction with pro-apoptotic factors.Oncol Rep. 2007 Aug;18(2):447-50. Oncol Rep. 2007. PMID: 17611669
-
The proteasome inhibitor bortezomib synergizes with gemcitabine to block the growth of human 253JB-V bladder tumors in vivo.Mol Cancer Ther. 2004 Mar;3(3):279-90. Mol Cancer Ther. 2004. PMID: 15026548
-
The proteasome inhibitor bortezomib is a potent inducer of zinc finger AN1-type domain 2a gene expression: role of heat shock factor 1 (HSF1)-heat shock factor 2 (HSF2) heterocomplexes.J Biol Chem. 2014 May 2;289(18):12705-15. doi: 10.1074/jbc.M113.513242. Epub 2014 Mar 11. J Biol Chem. 2014. PMID: 24619424 Free PMC article.
-
Induction of heme oxygenase-1 by cobalt protoporphyrin enhances the antitumour effect of bortezomib in adult T-cell leukaemia cells.Br J Cancer. 2007 Oct 22;97(8):1099-105. doi: 10.1038/sj.bjc.6604003. Epub 2007 Sep 25. Br J Cancer. 2007. PMID: 17895889 Free PMC article.
Cited by
-
Functional redundancy of HSPA1, HSPA2 and other HSPA proteins in non-small cell lung carcinoma (NSCLC); an implication for NSCLC treatment.Sci Rep. 2019 Oct 7;9(1):14394. doi: 10.1038/s41598-019-50840-7. Sci Rep. 2019. PMID: 31591429 Free PMC article.
-
TG2 regulates the heat-shock response by the post-translational modification of HSF1.EMBO Rep. 2018 Jul;19(7):e45067. doi: 10.15252/embr.201745067. Epub 2018 May 11. EMBO Rep. 2018. PMID: 29752334 Free PMC article.
-
The Transcription Axes ERK-Elk1, JNK-cJun, and JAK-STAT Promote Autophagy Activation and Proteasome Inhibitor Resistance in Prostate Cancer Cells.Curr Issues Mol Biol. 2025 May 12;47(5):352. doi: 10.3390/cimb47050352. Curr Issues Mol Biol. 2025. PMID: 40699751 Free PMC article.
-
Combination of Anti-Cancer Drugs with Molecular Chaperone Inhibitors.Int J Mol Sci. 2019 Oct 24;20(21):5284. doi: 10.3390/ijms20215284. Int J Mol Sci. 2019. PMID: 31652993 Free PMC article. Review.
-
Inhibition of Histone H3K18 Acetylation-Dependent Antioxidant Pathways Involved in Arsenic-Induced Liver Injury in Rats and the Protective Effect of Rosa roxburghii Tratt Juice.Toxics. 2023 Jun 3;11(6):503. doi: 10.3390/toxics11060503. Toxics. 2023. PMID: 37368603 Free PMC article.
References
-
- Wu WK, Sakamoto KM, Milani M, Aldana-Masankgay G, Fan D, et al. (2010) Macroautophagy modulates cellular response to proteasome inhibitors in cancer therapy. Drug Resist Updat 13: 87–92. - PubMed
-
- Mathew A, Morimoto RI (1998) Role of the heat-shock response in the life and death of proteins. Ann N Y Acad Sci 851: 99–111. - PubMed
-
- Nollen EA, Morimoto RI (2002) Chaperoning signaling pathways: molecular chaperones as stress-sensing ‘heat shock’ proteins. J Cell Sci 115: 2809–2816. - PubMed
Publication types
MeSH terms
Substances
Grants and funding
LinkOut - more resources
Full Text Sources
Other Literature Sources
Medical

