. 2013 Jul 17;8(7):e69641.
doi: 10.1371/journal.pone.0069641. Print 2013.

ERK positive feedback regulates a widespread network of tyrosine phosphorylation sites across canonical T cell signaling and actin cytoskeletal proteins in Jurkat T cells

Affiliations

ERK positive feedback regulates a widespread network of tyrosine phosphorylation sites across canonical T cell signaling and actin cytoskeletal proteins in Jurkat T cells

Ynes A Helou et al. PLoS One. .

Abstract

Competing positive and negative signaling feedback pathways play a critical role in tuning the sensitivity of T cell receptor activation by creating an ultrasensitive, bistable switch to selectively enhance responses to foreign ligands while suppressing signals from self peptides. In response to T cell receptor agonist engagement, ERK is activated to positively regulate T cell receptor signaling through phosphorylation of Ser(59) Lck. To obtain a wide-scale view of the role of ERK in propagating T cell receptor signaling, a quantitative phosphoproteomic analysis of 322 tyrosine phosphorylation sites by mass spectrometry was performed on the human Jurkat T cell line in the presence of U0126, an inhibitor of ERK activation. Relative to controls, U0126-treated cells showed constitutive decreases in phosphorylation through a T cell receptor stimulation time course on tyrosine residues found on upstream signaling proteins (CD3 chains, Lck, ZAP-70), as well as downstream signaling proteins (VAV1, PLCγ1, Itk, NCK1). Additional constitutive decreases in phosphorylation were found on the majority of identified proteins implicated in the regulation of actin cytoskeleton pathway. Although the majority of identified sites on T cell receptor signaling proteins showed decreases in phosphorylation, Tyr(598) of ZAP-70 showed elevated phosphorylation in response to U0126 treatment, suggesting differential regulation of this site via ERK feedback. These findings shed new light on ERK's role in positive feedback in T cell receptor signaling and reveal novel signaling events that are regulated by this kinase, which may fine tune T cell receptor activation.


Conflict of interest statement

Competing Interests: The authors have declared that no competing interests exist.

Figures

Figure 1
Figure 1. ERK positive feedback model.
(1) ERK phosphorylation at Ser59 Lck leads to modification of Lck’s SH2 domain. (2) Modification of Lck’s SH2 domain prevents SHP-1 association with Lck.
Figure 2
Figure 2. Experimental protocol.
Human Jurkat T cells were incubated with light or heavy stable isotope-labeled arginine and lysine amino acids, physically differentiating the two proteomes by a shift in molecular weights. Cells were treated with either U0126 (heavy-labeled cells) or DMSO (light-labeled cells) for 2.5 hours prior to stimulation. Each cell population was then pre-incubated with OKT3 and OKT4 antibodies for 30 seconds at 37°C and then cross-linked with IgG at 37°C for the times indicated.
Figure 3
Figure 3. U0126 inhibits ERK1/2 activation across a time course of TCR stimulation.
Jurkat T cells were treated with either 20 µM U0126 or 0.1% DMSO for 2.5 hours prior to TCR stimulation. (A) Cell lysates from a time course of TCR stimulation in the presence of 0.1% DMSO or 20 µM U0126 were separated by SDS-PAGE and immunodetected with phospho-p44/p42 MAPK (ERK1/2) and p44/42 MAPK (ERK1/2) specific antibodies. (B) Densitometric analysis of phospho-ERK1/2 levels normalized to ERK1/2 levels was performed. Shown is the mean ± S.D. from 4 biological replicate experiments. Statistically significant differences in relative phospho-ERK1/2 levels between U0126-treated and DMSO-treated cells for each time point are indicated with an asterisk (*-p value <0.01).
Figure 4
Figure 4. Phosphorylation of Ser59 Lck across a time course of TCR stimulation.
(A) Cell lysates from a time course of TCR stimulation in the presence of 0.1% DMSO or 20 µM U0126 were separated by SDS-PAGE and immunodetected with phospho-Ser59 Lck and Lck specific antibodies. (B) Densitometric analysis of phospho-Ser59 Lck levels normalized to Lck levels was performed. Shown is the mean ± S.D. from 4 biological replicate experiments. Statistically significant differences in relative phospho-Ser59 levels between U0126-treated and DMSO-treated cells for each time point are indicated with an asterisk (*-p value <0.007, **-p value <0.015).
Figure 5
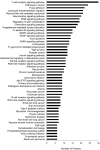
Figure 5. KEGG pathway analysis.
A KEGG analysis of confidently identified phosphopeptides (1% FDR) from four biological replicate experiments was performed.
Figure 6
Figure 6. Effects of U0126 on the canonical TCR signaling pathway.
Depicted is a model of ERK positive feedback with quantitative U0126-treated to DMSO-treated SILAC ratio heatmaps beside individual proteins, corresponding to the changes in phosphorylation between the two conditions across the four time points of TCR stimulation. Heatmaps were calculated from the averages of four biological replicate experiments. Green represents elevated phosphorylation in response to U0126 treatment relative to DMSO-treated controls, whereas red represents a decrease in phosphorylation relative to DMSO-treated controls. Blanks in the heatmap indicate that a clearly defined SIC peak was not observed for that phosphopeptide in that time point. Black represents no change. White dots within the heatmap indicate a statistically significant difference (q value <0.02) in the comparison between U0126-treated and control DMSO-treated SILAC ratios for that time point. Below each heatmap square is a color bar representing the percent CV for that time point. Orange represents a high degree of variation, while black represents a low degree of variation amongst the replicate analyses. Blanks indicate a lack of replicate data required to accurately determine the CV.
Figure 7
Figure 7. Quantitative phosphoproteomic analysis of proteins associated with the KEGG TCR signaling pathway.
Depicted is a SILAC heatmap representation of temporal changes in tyrosine phosphorylation of proteins associated with the KEGG TCR signaling pathway. Heatmaps were calculated from the averages of four biological replicate experiments. SILAC ratios between U0126-treated and control DMSO-treated Jurkat T cells are represented for each phosphopeptide and time point. A white dot within the SILAC heatmaps indicate a statistically significant difference (q value <0.02) in the comparison between U0126-treated and control SILAC ratios for that time point. Abbreviations: GSK3 beta, Glycogen synthase kinase 3 beta; PI3K alpha, Phosphatidylinositol 3 kinase regulatory subunit, alpha; SHP-2, Protein tyrosine phosphatase, nonreceptor type 11.
Figure 8
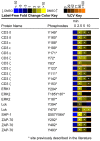
Figure 8. Label-free heatmaps of canonical TCR signaling proteins.
Label-free heatmaps represent the temporal change in phosphorylation of DMSO-treated control Jurkat T cells through the time course of TCR stimulation. Heatmaps were calculated from the averages of four biological replicate experiments. In the label-free heatmaps, black color represents peptide abundance equal to the geometric mean for that peptide across all time points. Blue color represents peptide abundance less than the mean, whereas yellow corresponds to peptide abundance more than the mean. A white dot within a label-free heatmap square indicates a statistically significant difference (q value <0.02) in the fold change in peptide abundance for that time point in DMSO-treated control cells.
Figure 9
Figure 9. Tyrosine phosphorylation in U0126-treated and DMSO-treated Jurkat T cells across a time course of TCR stimulation.
Cell lysates from one replicate of a time course of TCR stimulation in the presence of 0.1% DMSO or 20 µM U0126 were separated by SDS-PAGE and immunodetected with a monoclonal 4G10 antibody that recognizes phosphotyrosines. The immunoblot is representative of data from 4 biological replicate experiments.
Figure 10
Figure 10. Phosphorylation of the activation site of ZAP-70 across a time course of TCR stimulation.
(A) Cell lysates from one replicate of a time course of TCR stimulation in the presence of 0.1% DMSO or 20 µM U0126 were separated by SDS-PAGE and immunodetected with phospho-ZAP-70 (Tyr493) and ZAP-70 specific antibodies. (B) Densitometric analysis of phospho-ZAP-70 levels normalized to ZAP-70 levels was performed. Shown is the mean ± S.D. from 4 biological replicate experiments. Statistically significant differences in relative phospho-ZAP-70 levels between U0126-treated and DMSO-treated cells for each time point are indicated with an asterisk (*-p value <0.003).
Figure 11
Figure 11. Quantitative phosphoproteomic analysis of proteins associated with the KEGG regulation of actin cytoskeleton category.
Heatmaps were calculated from the averages of four biological replicate experiments. White dots within the SILAC heatmaps indicate a statistically significant difference (q value <0.02) in the comparison between U0126-treated and DMSO-treated control Jurkat T cell SILAC ratios for that time point. Abbreviations: A_Raf: A-Raf proto-oncogene; CYFIP1, Cytoplasmic FMR1 interacting protein 1; GIT1, G protein-coupled receptor kinase-interactor 1; IQGAP1, IQ motif containing GTPase activating protein 1.
Figure 12
Figure 12. Quantitative phosphoproteomic analysis of proteins implicated in integrin signaling.
Heatmaps were calculated from the averages of four biological replicate experiments. White dots within the SILAC heatmaps indicate a statistically significant difference (q value <0.02) in the comparison between U0126-treated and DMSO-treated control Jurkat T cell SILAC ratios for that time point.

Similar articles

Cited by

References

    1. Acuto O, Di Bartolo V, Micheli F (2008) Tailoring T-cell receptor signals by proximal negative feedback mechanisms. Nat Rev Immunol 8: 699–712. - PubMed
    1. Palacios EH, Weiss A (2004) Function of the Src-family kinases, Lck and Fyn, in T-cell development and activation. Oncogene 23: 7990–8000. - PubMed
    1. Au-Yeung BB, Deindl S, Hsu LY, Palacios EH, Levin SE, et al. (2009) The structure, regulation, and function of ZAP-70. Immunol Rev 228: 41–57. - PubMed
    1. Stefanova I, Hemmer B, Vergelli M, Martin R, Biddison WE, et al. (2003) TCR ligand discrimination is enforced by competing ERK positive and SHP-1 negative feedback pathways. Nat Immunol 4: 248–254. - PubMed
    1. Mueller DL (2003) Tuning the immune system: competing positive and negative feedback loops. Nat Immunol 4: 210–211. - PubMed

Publication types