. 2013 Jul 17;8(7):e69830.
doi: 10.1371/journal.pone.0069830. Print 2013.

Age-dependent modulation of synaptic plasticity and insulin mimetic effect of lipoic acid on a mouse model of Alzheimer's disease

Affiliations

Age-dependent modulation of synaptic plasticity and insulin mimetic effect of lipoic acid on a mouse model of Alzheimer's disease

Harsh Sancheti et al. PLoS One. .

Erratum in

  • PLoS One. 2014;9(12):e116442

Abstract

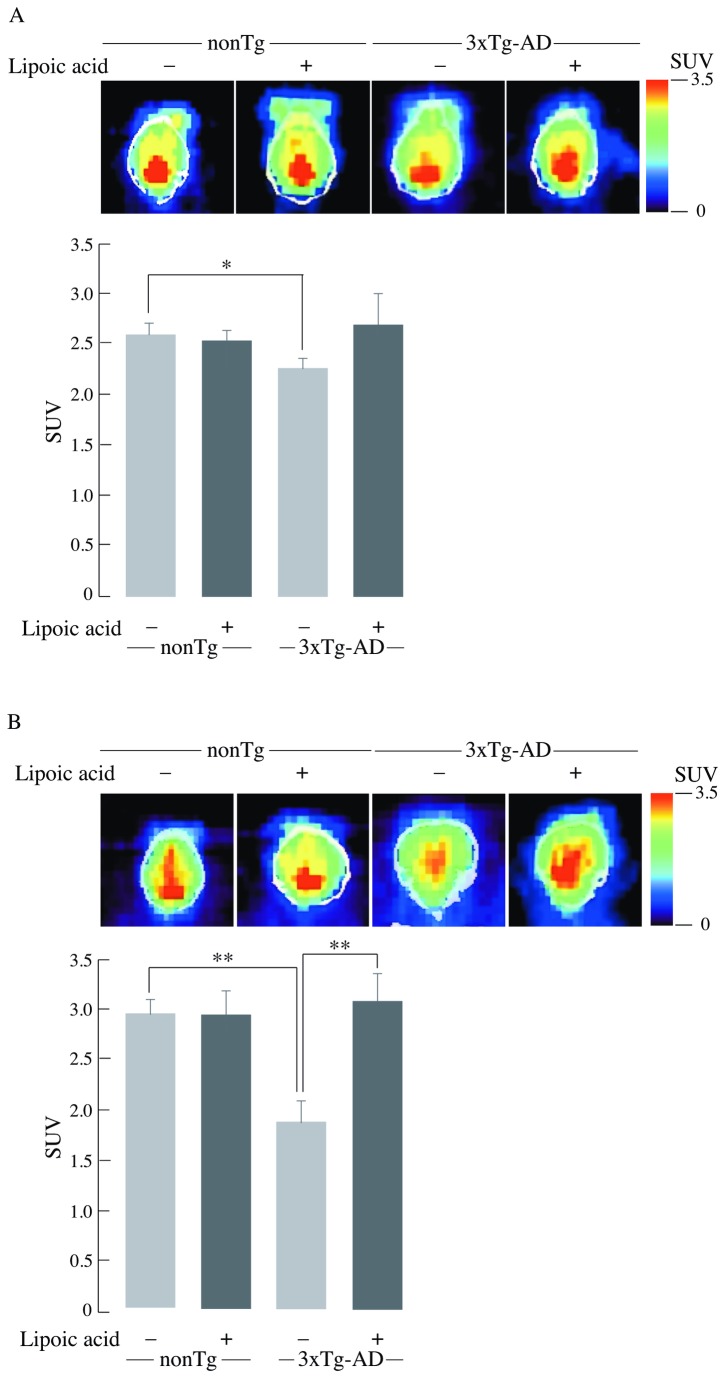
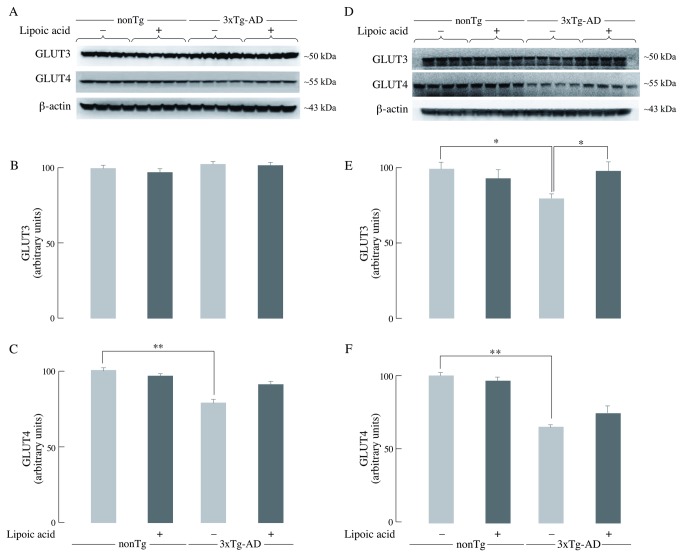
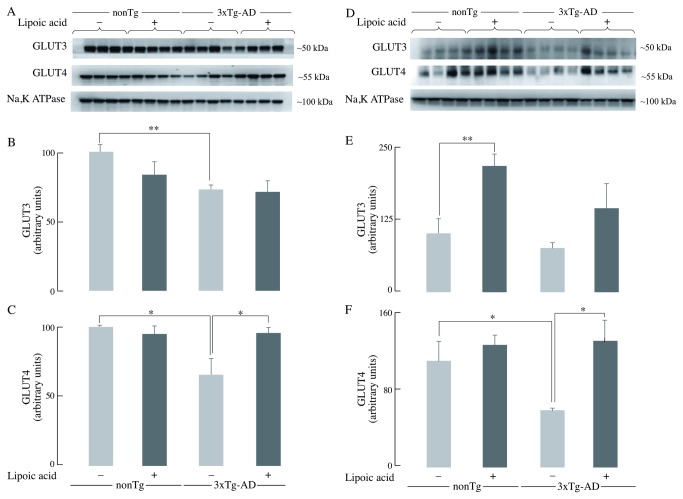
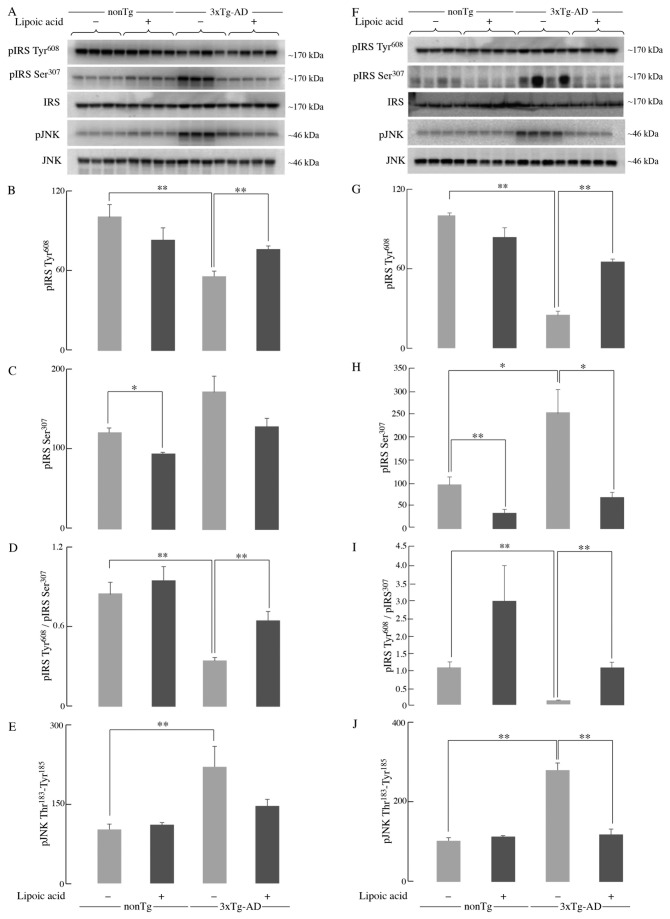
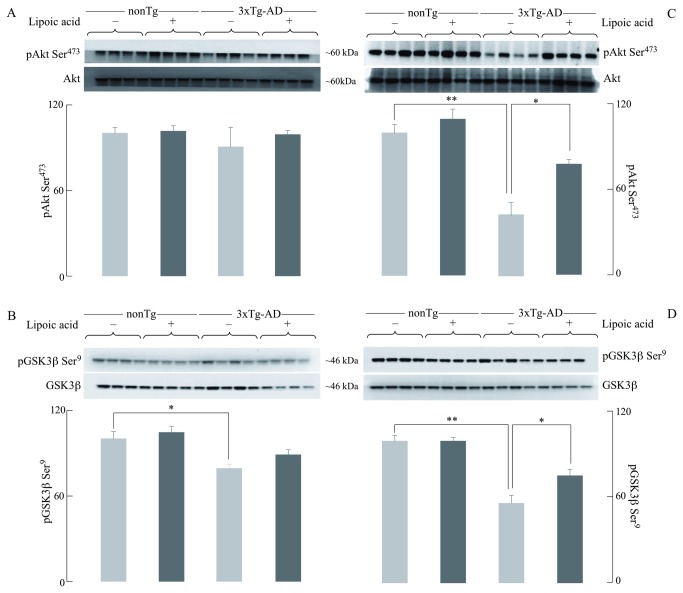
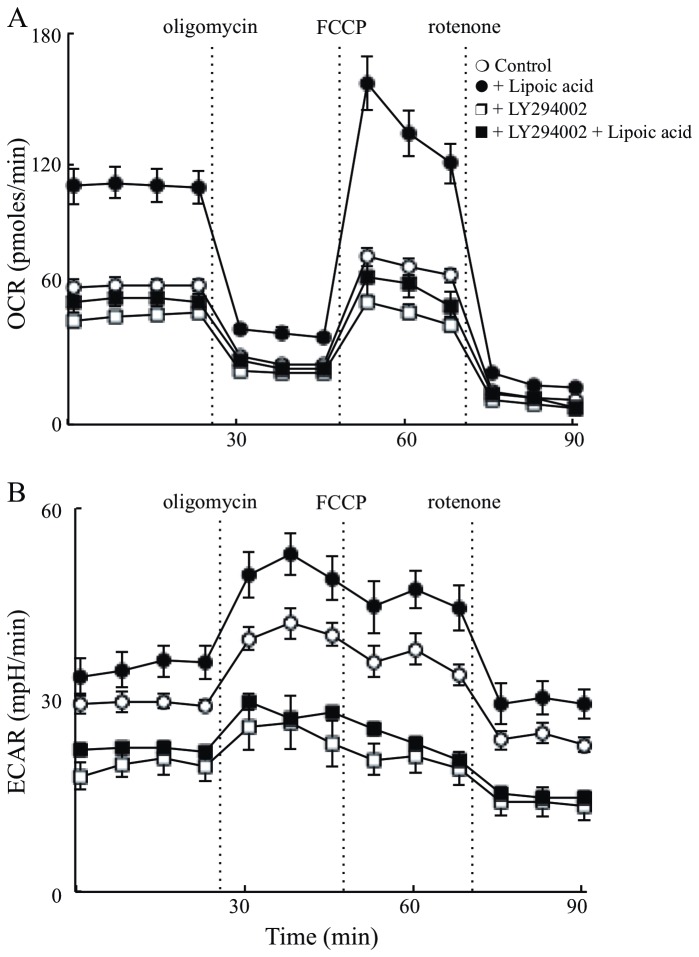
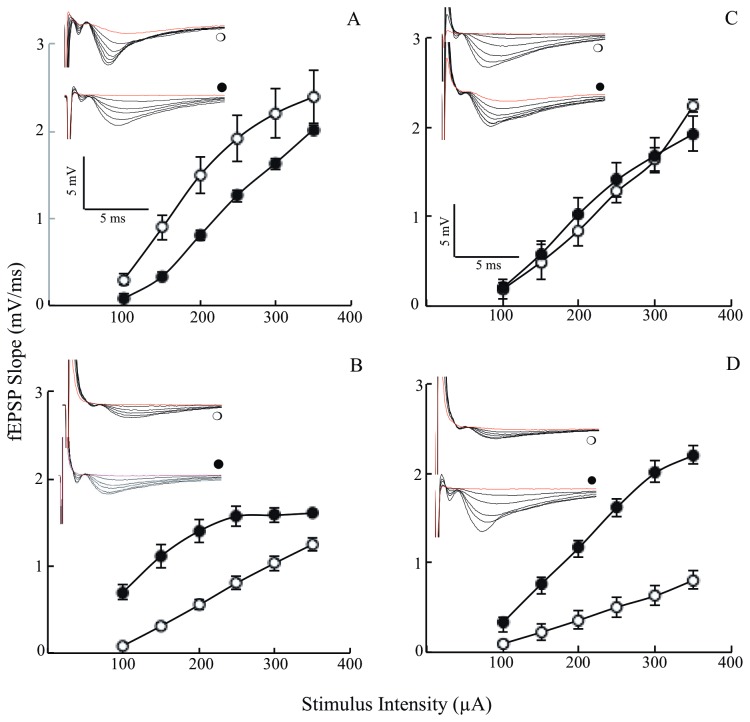
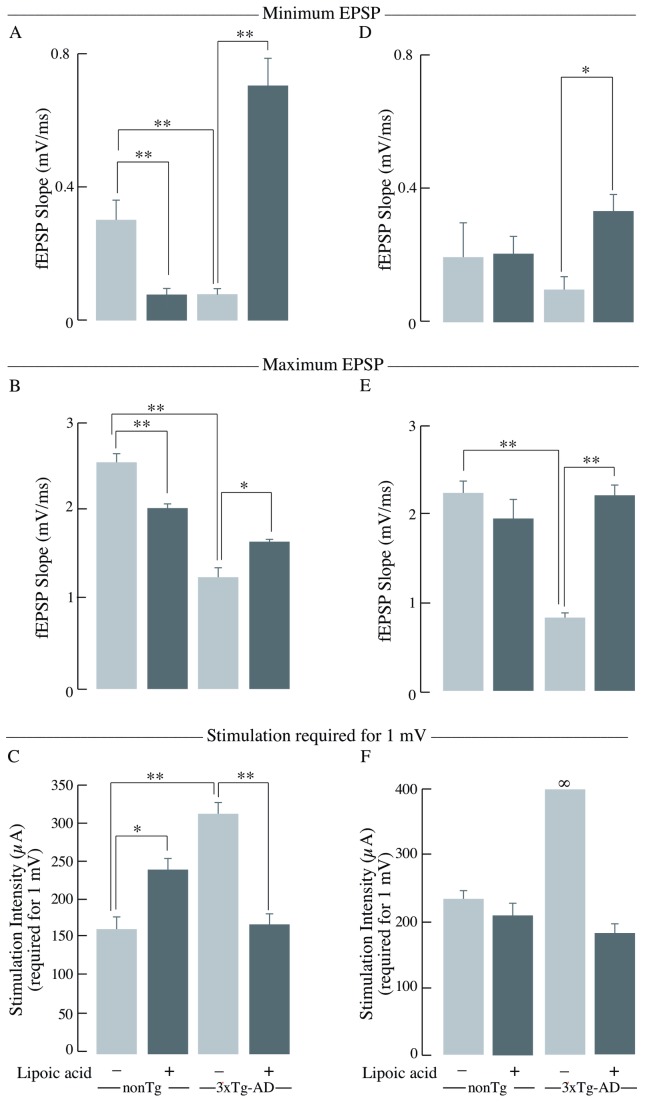
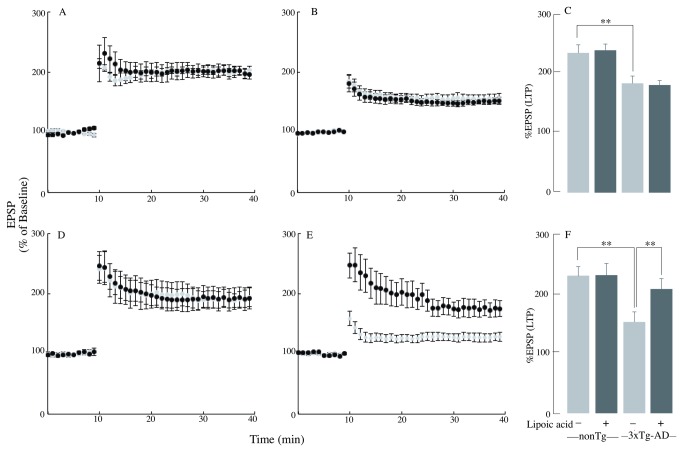
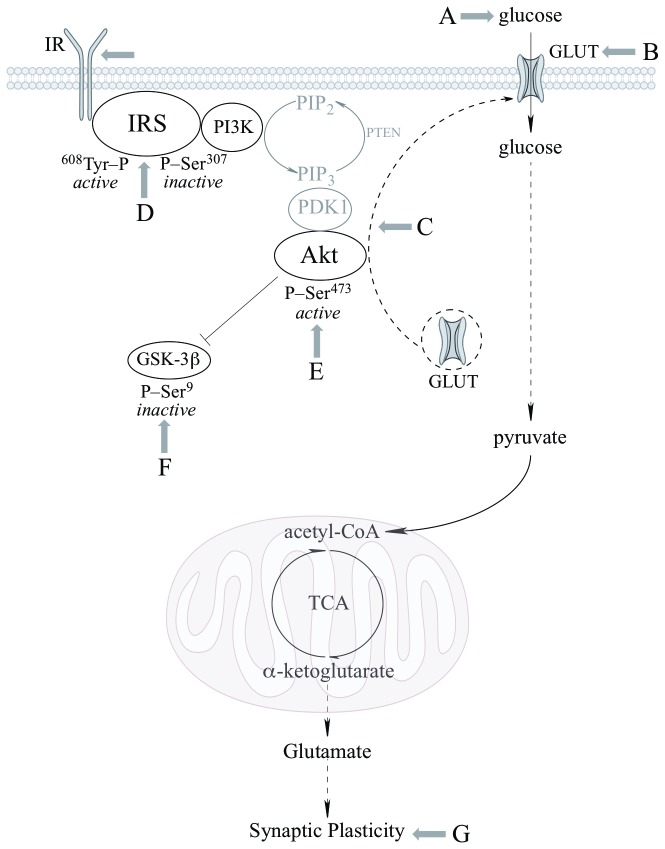
Alzheimer's disease is a progressive neurodegenerative disease that entails impairments of memory, thinking and behavior and culminates into brain atrophy. Impaired glucose uptake (accumulating into energy deficits) and synaptic plasticity have been shown to be affected in the early stages of Alzheimer's disease. This study examines the ability of lipoic acid to increase brain glucose uptake and lead to improvements in synaptic plasticity on a triple transgenic mouse model of Alzheimer's disease (3xTg-AD) that shows progression of pathology as a function of age; two age groups: 6 months (young) and 12 months (old) were used in this study. 3xTg-AD mice fed 0.23% w/v lipoic acid in drinking water for 4 weeks showed an insulin mimetic effect that consisted of increased brain glucose uptake, activation of the insulin receptor substrate and of the PI3K/Akt signaling pathway. Lipoic acid supplementation led to important changes in synaptic function as shown by increased input/output (I/O) and long term potentiation (LTP) (measured by electrophysiology). Lipoic acid was more effective in stimulating an insulin-like effect and reversing the impaired synaptic plasticity in the old mice, wherein the impairment of insulin signaling and synaptic plasticity was more pronounced than those in young mice.


Conflict of interest statement

Competing Interests: The authors have declared that no competing interests exist.

Figures

Figure 1
Figure 1. Age-dependent decrease of whole brain glucose uptake and the restorative effect of lipoic acid.
Standard uptake value (SUV) was calculated after [18F]-FDG injection followed by PET and CT scanning as described in the Materials and Methods section. (A) Young mice, n = 34, n ≥ 6/group. (B) Old mice, n = 27, n ≥ 6/group. Upper panel: Representative combined images from PET-CT scanning of nonTg and 3xTg-AD mice ± lipoic acid; lower panel: Average SUV values with the error bar indicating ± SEM. *P ≤ 0.05, **P ≤ 0.01.
Figure 2
Figure 2. Brain GLUT3 and GLUT4 levels.
The levels of total GLUT3 and GLUT4 in whole brain from nonTg and 3xTg-AD mice +/- lipoic acid (young and old) were determined by western-blot analyses. Left panels (A, B, and C) correspond to data from young mice; right panels (D, E, and F) to data from old mice. Representative western blot images of GLUT3, GLUT4, and β-actin (loading control) are shown. Bar graphs show the average GLUT3 or GLUT4 values after normalization with the loading control and the error bars indicating ± SEM. Total n = 48, n ≥ 5/group. *P ≤ 0.05, **P ≤ 0.01.
Figure 3
Figure 3. Membrane-associated GLUT3 and GLUT4 levels in brain.
The levels of GLUT3 and GLUT4 in whole brain crude membranes from nonTg and 3xTg-AD mice +/- lipoic acid (young and old) were determined by western-blot analyses. Left panels (A, B, and C) correspond to data from young mice, whereas right panels (D, E, and F) correspond to data from old mice. Representative western blot images of GLUT3, GLUT4, and Na, K-ATPase (loading control) in whole brain crude membrane are shown. Bar graphs show the average membrane-associated GLUT3 and GLUT4 values after normalization with the loading control and the error bars indicating ± SEM. Total n = 32, n = 4/group. *P ≤ 0.05, **P ≤ 0.01.
Figure 4
Figure 4. IRS activation status in the 3xTg-AD mice and the effect of lipoic acid.
The levels of pIRS-Tyr608 (activated) and pIRS-Ser307 (inactivated) in whole brain from young and old nonTg and 3xTg-AD mice +/- lipoic acid were determined by western-blot analyses. Left panels (A, B, C, D, and E) correspond to data from young mice; right panels (F, G, H, I, and J) correspond to data from old mice. Bar graphs show the average pIRS Tyr608, pIRS Ser307, and pJNK Thr183-Tyr185 values after normalization with the loading control (IRS and JNK) and the error bars indicating ± SEM Total n = 48, n ≥ 5/group. *P ≤ 0.05, **P ≤ 0.01.
Figure 5
Figure 5. Effect of lipoic acid on age-dependent changes in brain pAkt and pGSK3β.
Western blot analyses of the levels of pAkt Ser473 and pGSK3β Ser9 in whole brain from nonTg and 3xTg-AD mice +/- lipoic acid. Left panels (A and B) correspond to data from young mice and right panels (C and D) to data from old mice. Bar graphs show the average pAkt Ser473 (normalized to loading control, Akt) and pGSK3β Ser9 (normalized to loading control, GSK3β) with error bars indicating ± SEM. Total n = 48, n ≥ 5/group. *P ≤ 0.05, **P ≤ 0.01.
Figure 6
Figure 6. PI3K dependent effect of lipoic acid on cellular bioenergetics.
Primary cortical neurons from nonTg mice were isolated and cultured for 7 days. 18 hours before the assay, lipoic acid (20 µM) and/or LY294002 (50 µM) were added to medium. (A) OCR and (B) ECAR were determined using Seahorse XF-24 Metabolic Flux Analyzer. Vertical dashed lines indicate time of addition of mitochondrial inhibitors: oligomycin (4 µM), FCCP (1 µM), and rotenone (1 µM) (open circles). control; (closed circles) plus lipoic acid; (open squares) plus LY294002; (closed squares) plus lipoic acid and LY294002. OCR and ECAR readings were normalized to total protein concentration in each well.
Figure 7
Figure 7. Age dependent changes in I/O of the 3xTg-AD mice and the effect of lipoic acid.
I/O relationships after applying increasing stimulation to the stratum radiatum of the CA1 region in the hippocampus for nonTg and 3xTg-AD mice +/- lipoic acid and recording the output (electrophysiology techniques as described in the Materials and Methods section). Left panels (A and B) correspond to data from young mice and right panels (C and D) to data from old mice (open circles). Control; (closed circles) Plus lipoic acid. fEPSP slope (mV/ms) plotted against the corresponding stimulation intensity for (A) young non-Tg mice (p < 0.001; F = 27.1 repeated measures ANOVA; young nonTg n = 4, young nonTg + lipoic acid n = 7); (B) young 3xTg-AD mice (p < 0.002; F = 20.4 repeated measures ANOVA; young 3xTg-AD n = 8, young 3xTg-AD + lipoic acid n = 6). (C) old nonTg mice (p < 0.004; F = 13.9 repeated measures ANOVA; old nonTg n = 6, old nonTg + lipoic acid n = 6). (D) old 3xTg-AD mice (p < 0.00003; F = 46.4 repeated measures ANOVA; old 3xTg-AD n = 6, old 3xTg-AD + lipoic acid n = 7). The inserts in each panel are the corresponding representative I/O raw data as obtained during the electrophysiology recordings: (open circles) control and (closed circles) plus lipoic acid. Total n = 51 slices, n ≥ 5 slices/group and at least 3-4 animals/group.
Figure 8
Figure 8. Minimum EPSP, maximum EPSP, and stimulation intensity required to reach 1mV.
Bar graphs of the levels of minimum EPSP, maximum EPSP, and stimulation intensity required to reach 1 mV as obtained during the I/O recordings in the stratum radiatum of the hippocampal CA1 region for nonTg and 3xTg-AD mice +/- lipoic acid. Left panels (A, B, and C) correspond to data from young mice and right panels (D, E, and F) to data from old mice. Bar graphs showing the minimum EPSP or the fEPSP slope values at 100 µA and the error bars indicating ± SEM for (A) young mice and (D) old mice. Bar graphs showing the maximum EPSP or the fEPSP slope values at 350 µA and the error bars indicating ± SEM for (B) young mice and (E) old mice. Bar graphs showing the stimulation intensity required to reach at least 1mV output and the error bars indicating ± SEM for (C) young mice (p < 0.01; F = 8.9 repeated measures ANOVA) (young nonTg n = 7, young 3xTg-AD n = 7) and (F) old mice (p < 0.003; F = 14.6 repeated measures ANOVA) (old nonTg n = 6, old 3xTg-AD n = 7). Total n = 51 slices, n ≥ 5 slices/group and at least 3-4 animals/group. *P ≤ 0.05, **P ≤ 0.01.
Figure 9
Figure 9. Age dependent changes in the LTP of the 3xTg-AD mice and the lipoic acid effect.
LTP was induced at baseline intensity using theta burst stimulation (TBS) consisting of ten trains of five 100 Hz stimulation repeated at 5 Hz. Slope of EPSPs was measured and results normalized to the average value measured during the 10 min baseline period. Recording continued for at least 30 min following TBS and the last 5 min was used to calculate the LTP. Panels A, B, and C correspond to data from young mice, whereas, panels D, E, and F correspond to data from old mice (gray circles/bars – control (nonTg or 3xTg-AD), black circles/bars – fed lipoic acid (nonTg or 3xTg-AD + lipoic acid). A graph showing the first 10 min of baseline followed by the percentage of the baseline response elicited after TBS for 30 min for (A) young nonTg mice, (B) young 3xTg-AD mice, (D) old nonTg mice, (E) old 3xTg-AD mice. Bar graphs showing the measured LTP using % EPSP for the last 5 min of the response to TBS stimulation for (C) young mice and (F) old mice. Total n = 51 slices, n ≥ 5 slices/group and at least 3-4 animals/group. *P ≤ 0.05, **P ≤ 0.01.
Figure 10
Figure 10. Sites of action and effects of lipoic acid on brain glucose metabolism.
The scheme shows the PI3K/Akt pathway of insulin signaling and the effects of lipoic acid on the different components investigated in this study: (A) glucose uptake, (B) total GLUT3 and GLUT4 expression, (C) translocation of GLUT3 and GLUT4 to the plasma membrane from intracellular vesicles, (D) changes in IRS-Tyr608 /IRS-Ser307 ratio, (E) activation of Akt, (F) phosphorylation of GSK3β at Ser9, and (G) synaptic plasticity.

Similar articles

Cited by

References

    1. Hansson O, Zetterberg H, Buchhave P, Londos E, Blennow K et al. (2006) Association between CSF biomarkers and incipient Alzheimer s disease in patients with mild cognitive impairment: a follow-up study. Lancet Neurol 5: 228-234. - PubMed
    1. Brinton RD (2008) Estrogen regulation of glucose metabolism and mitochondrial function: therapeutic implications for prevention of Alzheimer’s disease. Adv Drug Deliv Rev 60: 1504-1511. doi:10.1016/j.addr.2008.06.003. PubMed: 18647624. - DOI - PMC - PubMed
    1. Swerdlow RH (2011) Brain aging, Alzheimer’s disease, and mitochondria. Biochim Biophys Acta 1812: 1630-1639. doi:10.1016/j.bbadis.2011.08.012. PubMed: 21920438. - DOI - PMC - PubMed
    1. Swerdlow RH, Khan SM (2004) A "mitochondrial cascade hypothesis" for sporadic Alzheimer’s disease. Med Hypotheses 63: 8-20. doi:10.1016/j.mehy.2003.12.045. PubMed: 15193340. - DOI - PubMed
    1. Mosconi L, de Leon M, Murray J, Lezi E, Lu J et al. (2011) Reduced mitochondria cytochrome oxidase activity in adult children of mothers with Alzheimer’s disease. J Alzheimers Dis 27: 483-490. PubMed: 21841246. - PMC - PubMed

Publication types