. 2013 Jul 11:3:182.
doi: 10.3389/fonc.2013.00182. eCollection 2013.

Molecular Characteristics in MRI-Classified Group 1 Glioblastoma Multiforme

Affiliations

Molecular Characteristics in MRI-Classified Group 1 Glioblastoma Multiforme

William E Haskins et al. Front Oncol. .

Abstract

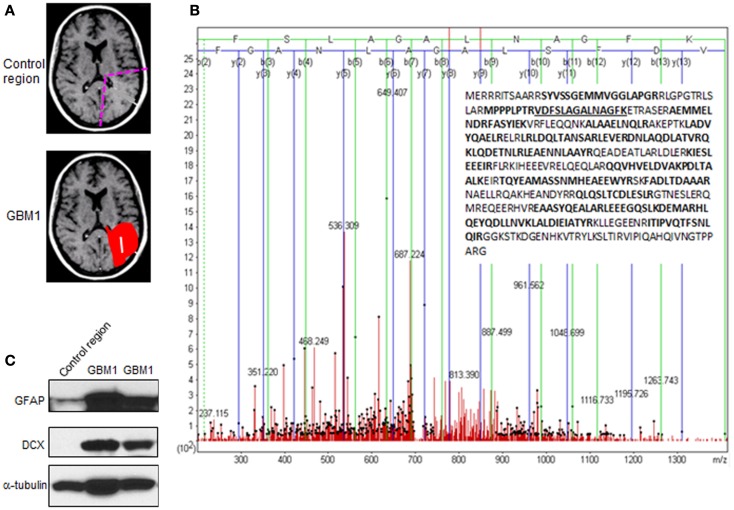
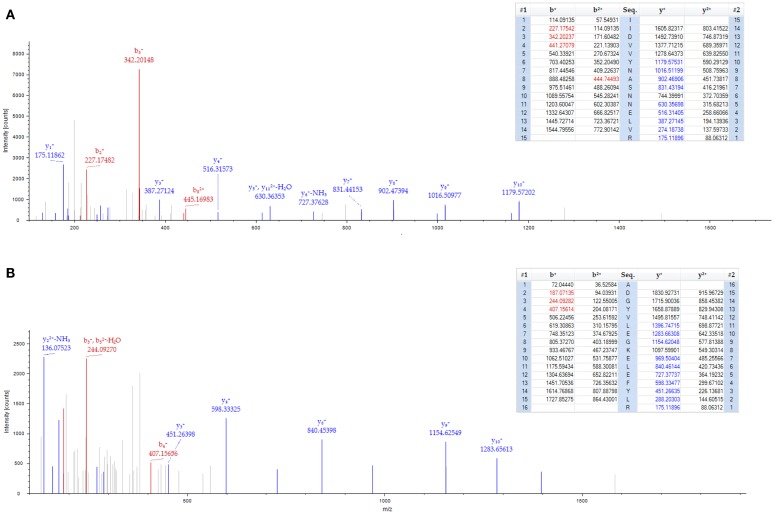
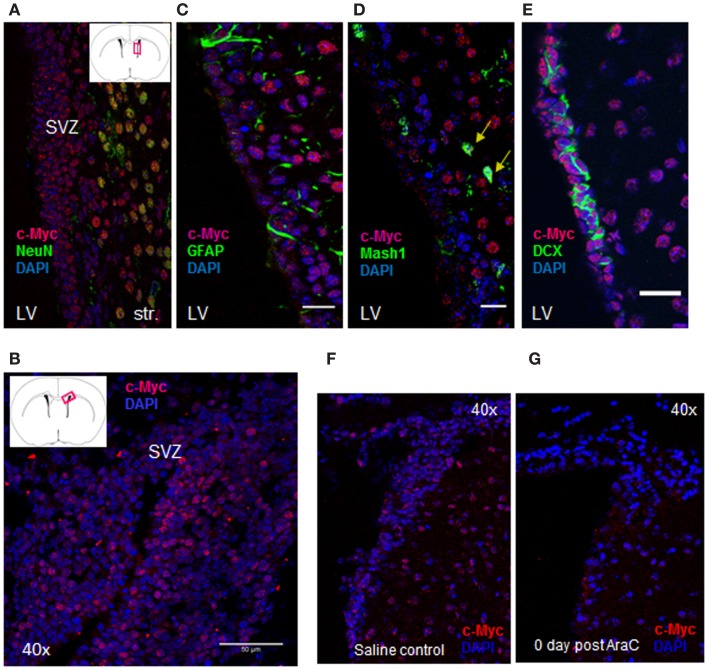
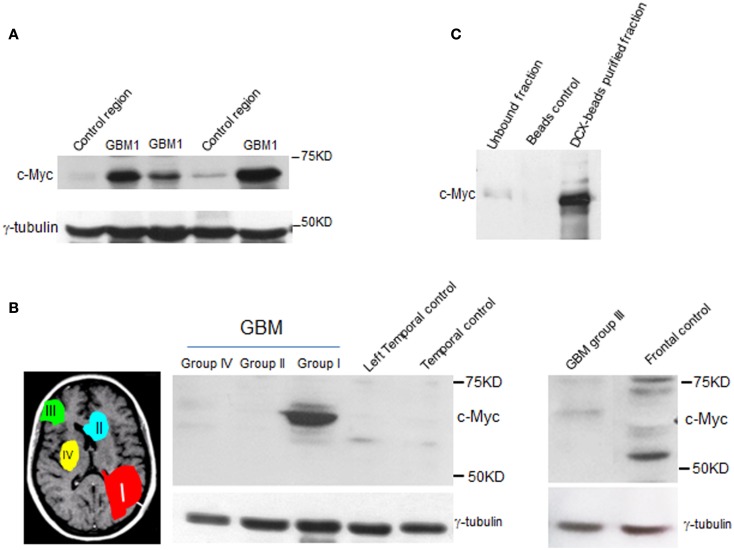
Glioblastoma multiforme (GBM) is a clinically and pathologically heterogeneous brain tumor. Previous studies of transcriptional profiling have revealed biologically relevant GBM subtypes associated with specific mutations and dysregulated pathways. Here, we applied a modified proteome to uncover abnormal protein expression profile in a MRI-classified group I GBM (GBM1), which has a spatial relationship with one of the adult neural stem cell niches, subventricular zone (SVZ). Most importantly, we identified molecular characteristics in this type of GBM that include up-regulation of metabolic enzymes, ribosomal proteins, and heat shock proteins. As GBM1 often recurs at great distances from the initial lesion, the rewiring of metabolism, and ribosomal biogenesis may facilitate cancer cells' growth and survival during tumor progression. The intimate contact between GBM1 and the SVZ raises the possibility that tumor cells in GBM1 may be most related to SVZ cells. In support of this notion, we found that markers representing SVZ cells are highly expressed in GBM1. Emerged findings from our study provide a specific protein expression profile in GBM1 and offer better prediction or therapeutic implication for this multifocal GBM.

Keywords: GBM; SVZ; heat shock protein; oncoprotein; ribogenesis.


Figures

Figure 1
Figure 1
Experimental strategy and results from proteomic screening. (A) Schematic diagram depicting the region of GBM1 specimen for proteomic screening. (B) Glial fibrillary acidic protein (GFAP or E9PAX3_HUMAN), one of the top-ranked proteins shown in Table 1, was highly expressed in GBM1 vs. normal brain region specimens. The annotated MS/MS spectrum shown illustrates the amino acid sequence assignment of product ions to the top-ranked tryptic peptide, VDFSLAGALNAGFK, which spans amino acid residues 50–63 of GFAP. The insert shows the amino acid sequence coverage of GFAP with tryptic peptides observed in bold (and peptide 50–63 underlined). (C) Abundant level of GFAP and doublecortin (DCX) in independent GBM1 specimens by western blot.
Figure 2
Figure 2
Spectrum of 40S ribosomal protein in GBM1. Two peptides from the 40S ribosomal protein S8 were identified with high confidence (less than 1% false discovery rate cut-off) by mass spectrometry. (A) 40S ribosomal protein S8 peptide sequences (IIDVVYNASNNELVR). (B) 40S ribosomal protein S8 peptide sequences (ADGYVLEGKELEFYLR). The top portion of each frame shows the predicted b- and y-ions values (m/z) for possible fragments of the identified peptide. Those values highlighted in red and blue correspond to b-ion and y-ion fragments, respectively, found in the tandem mass spectrum. The bottom portion of each frame shows the tandem mass spectrum for each identified peptide. Red and blue colored peaks correspond to predicted b- and y-ions that were identified in the spectra.
Figure 3
Figure 3
c-Myc is expressed in the SVZ cell lineages. (A, B) c-Myc staining in SVZ (20×, coronal section); (C–E) Double labeling of c-Myc (red) and NSC marker – GFAP (C) as well as other lineage-specific markers showed c-Myc co-expressing with Mash1 (D), and DCX (E). Double-labeled cells were marked by arrows. LV: lateral ventricle; Str: striatum (12 μ coronal sections; 40× oil; scale bar = 50 μm). Anti-mitotic treatment abolished most of c-Myc expressing cells after Ara-C treatment; (F, G) Indicating c-Myc is highly expressed in progenitors and neuroblasts in SVZ.
Figure 4
Figure 4
c-Myc level is elevated in type I GBM. Western blot analysis shows elevated levels of c-Myc in independent sets of GBM1 specimens when compared to other types of GBM (groups II, III, and IV) and control tissue specimens. (A, B) Control specimens were from non-cancer donors that were regional and age matched to the MRI characterized GBM specimens. γ-tubulin was used as internal control. (C) c-Myc level is abundant in DCX-enriched population from GBM1 specimen.

References

    1. Verhaak RG, Hoadley KA, Purdom E, Wang V, Qi Y, Wilkerson MD, et al. Integrated genomic analysis identifies clinically relevant subtypes of glioblastoma characterized by abnormalities in PDGFRA IDH1, EGFR, and NF1. Cancer Cell (2010) 17:98–11010.1016/j.ccr.2009.12.020 - DOI - PMC - PubMed
    1. Phillips HS, Kharbanda S, Chen R, Forrest WF, Soriano RH, Wu TD, et al. Molecular subclasses of high-grade glioma predict prognosis, delineate a pattern of disease progression, and resemble stages in neurogenesis. Cancer Cell (2006) 9:157–7310.1016/j.ccr.2006.02.019 - DOI - PubMed
    1. Chen J, McKay RM, Parada LF. Malignant glioma: lessons from genomics, mouse models, and stem cells. Cell (2012) 149:36–4710.1016/j.cell.2012.03.009 - DOI - PMC - PubMed
    1. Singh SK, Hawkins C, Clarke ID, Squire JA, Bayani J, Hide T, et al. Identification of human brain tumour initiating cells. Nature (2004) 432:396–40110.1038/nature03128 - DOI - PubMed
    1. Ligon KL, Huillard E, Mehta S, Kesari S, Liu H, Alberta JA, et al. Olig2-regulated lineage-restricted pathway controls replication competence in neural stem cells and malignant glioma. Neuron (2007) 53:503–1710.1016/j.neuron.2007.01.009 - DOI - PMC - PubMed