. 2013 Oct;127(2):187-98.
doi: 10.1111/jnc.12373. Epub 2013 Aug 20.

Effects of VMAT2 inhibitors lobeline and GZ-793A on methamphetamine-induced changes in dopamine release, metabolism and synthesis in vivo

Affiliations

Effects of VMAT2 inhibitors lobeline and GZ-793A on methamphetamine-induced changes in dopamine release, metabolism and synthesis in vivo

Andrew C Meyer et al. J Neurochem. 2013 Oct.

Abstract

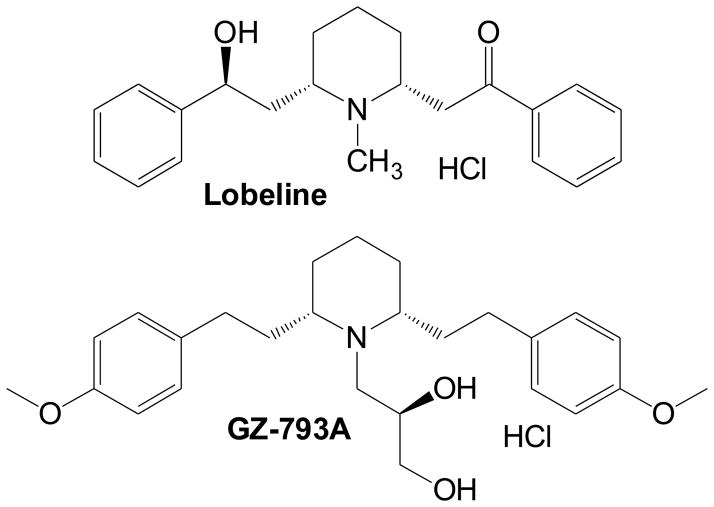
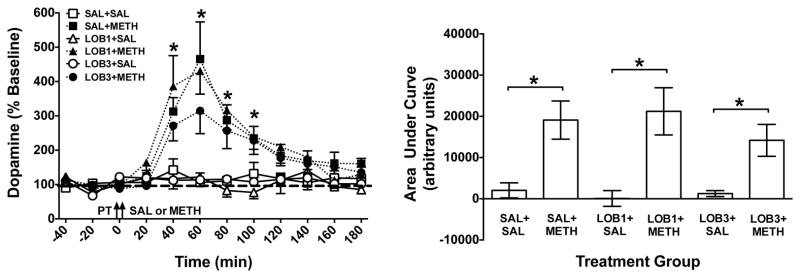
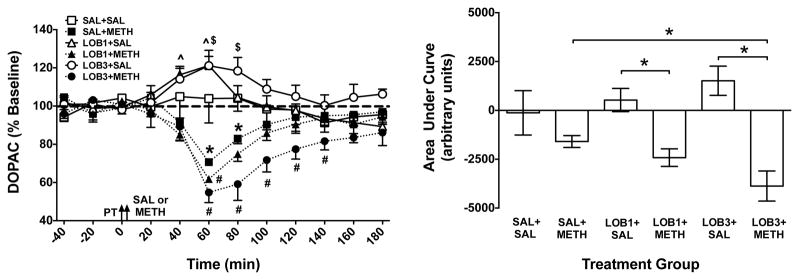
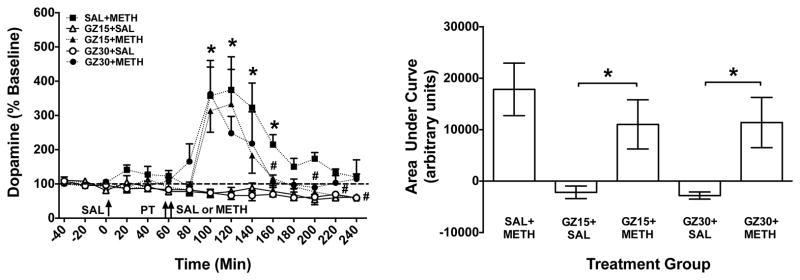
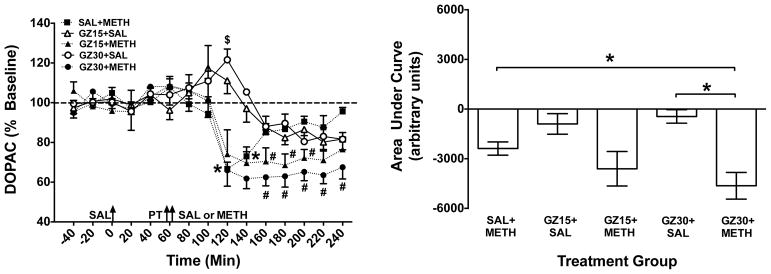
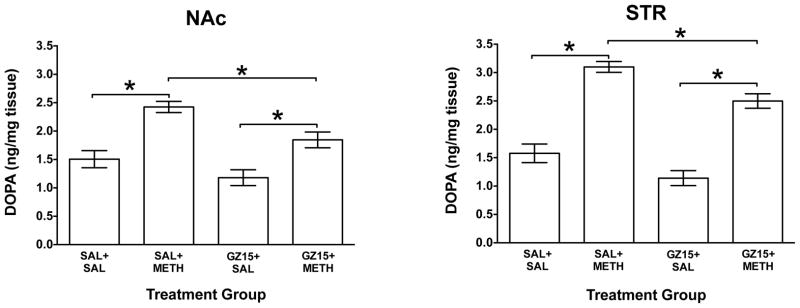
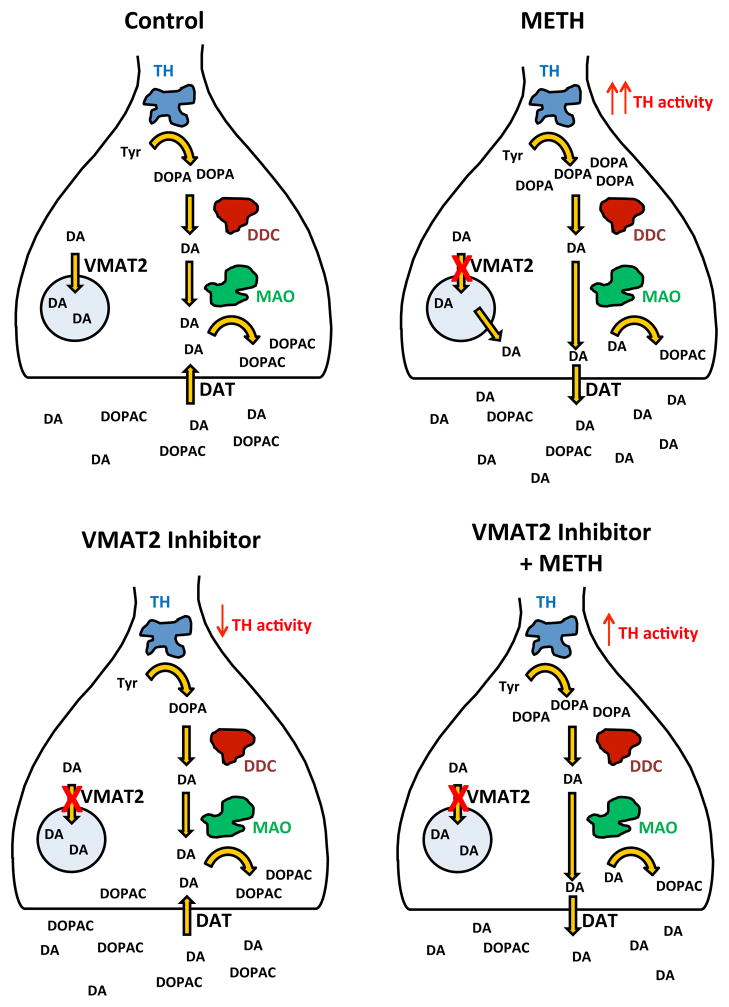
Vesicular monoamine transporter-2 (VMAT2) inhibitors reduce methamphetamine (METH) reward in rats. The current study determined the effects of VMAT2 inhibitors lobeline (LOB; 1 or 3 mg/kg) and N-(1,2R-dihydroxylpropyl)-2,6-cis-di(4-methoxyphenethyl)piperidine hydrochloride (GZ-793A; 15 or 30 mg/kg) on METH-induced (0.5 mg/kg, SC) changes in extracellular dopamine (DA) and its metabolite dihydroxyphenylacetic acid (DOPAC) in the reward-relevant nucleus accumbens (NAc) shell using in vivo microdialysis. The effect of GZ-793A (15 mg/kg) on DA synthesis in tissue also was investigated in NAc, striatum, medial prefrontal cortex and orbitofrontal cortex. In NAc shell, METH produced a time-dependent increase in extracellular DA and decrease in DOPAC. Neither LOB nor GZ-793A alone altered extracellular DA; however, both drugs increased extracellular DOPAC. In combination with METH, LOB did not alter the effects of METH on DA; however, GZ-793A, which has greater selectivity than LOB for inhibiting VMAT2, reduced the duration of the METH-induced increase in extracellular DA. Both LOB and GZ-793A enhanced the duration of the METH-induced decrease in extracellular DOPAC. METH also increased tissue DA synthesis in NAc and striatum, whereas GZ-793A decreased synthesis; no effect of METH or GZ-793A on DA synthesis was found in medial prefrontal cortex or orbitofrontal cortex. These results suggest that selective inhibition of VMAT2 produces a time-dependent decrease in DA release in NAc shell as a result of alterations in tyrosine hydroxylase activity, which may play a role in the ability of GZ-793A to decrease METH reward.

Keywords: GZ-793A; VMAT2; dopamine; lobeline; methamphetamine; microdialysis.


Figures

Figure 1
Figure 1
Chemical structures for LOB and GZ-793A.
Figure 2
Figure 2. Placement of Microdialysis Probes
Each vertical bar represents a probe placement for each animal that was included in the analysis of the microdialysis experiments. Panel A: Probe placements for the LOB microdialysis experiment. Panel B: Probe placements for the GZ-793A microdialysis experiment.
Figure 3
Figure 3. Extracellular DA Concentrations in NAc Shell Following LOB and/or METH
Left Panel: Mean (± SEM) DA concentration in dialysate as a percent of baseline for each time point following administration of saline (SAL), lobeline (LOB; 1 or 3 mg/kg) and/or methamphetamine (METH; 0.5 mg/kg). Arrows indicate time of pretreatment (PT) and treatment (SAL or METH). Thick dashed line represents baseline, expressed as 100%. *Indicates significant within-group change in DA levels in the SAL+METH group relative to baseline (p<0.05), n = 4 – 7 rats per group. Right Panel: Area under the curve (AUC) for each group. *Indicates significant difference between groups (p<0.05), n = 4 – 7 rats per group.
Figure 4
Figure 4. Extracellular DOPAC Concentrations in NAc Shell Following LOB and/or METH
Left Panel: Mean (± SEM) extracellular DOPAC concentration in dialysate as a percent of baseline for each time point following administration of saline (SAL), lobeline (LOB; 1 or 3 mg/kg) and/or methamphetamine (METH; 0.5 mg/kg). Arrows indicate time of pretreatment (PT) and treatment (SAL or METH). The thick dashed line represents baseline, expressed as 100%. *Indicates significant within-group change in DOPAC in the SAL+METH group relative to baseline (p<0.05); ^ indicates significant within-group change in DOPAC in LOB1+SAL group relative to baseline (p<0.05); $ indicates significant within-group change in DOPAC in LOB3+SAL group relative to baseline (p<0.05); and # indicates a significant between-group difference from the SAL+METH group at the same time point (p<0.05), n = 4–7 rats per group. Right Panel: Area under the curve (AUC) following treatment for each group. *Indicates significant difference between groups (p<0.05), n = 4–7 rats per group.
Figure 5
Figure 5. Extracellular DA Concentrations in NAc Shell Following GZ-793A and/or METH
Left Panel: Mean (± SEM) DOPAC concentration in dialysate as a percent of baseline for each time point following administration of saline (SAL), GZ-793A (GZ; 15 or 30 mg/kg) and/or methamphetamine (METH; 0.5 mg/kg). Arrows indicate time of injections; saline (SAL), pretreatment (PT) and treatment (SAL or METH). Thick dashed line represents the baseline, expressed as 100%. *Indicates significant within-group change in DA levels in the SAL+METH group relative to baseline (p<0.05); # Indicates significant between-group difference from SAL+METH group, with the # at 160 and 200 min representing a difference for both GZ15+METH and GZ30+METH groups and the # at 220 and 240 min representing a difference for the GZ15+METH group (p<0.05), n = 5 – 6 rats per group. Right Panel: Area under the curve (AUC) following treatment for each group. *Indicates significant difference between groups (p<0.05), n = 5 – 6 rats per group.
Figure 6
Figure 6. Extracellular DOPAC Concentrations in NAc Shell Following GZ-793A and/or METH
Left Panel: Mean (± SEM) DOPAC concentrations in dialysate as a percent of baseline for each time point following administration of saline (SAL), GZ-793A (GZ; 15 or 30 mg/kg) and/or methamphetamine (METH; 0.5 mg/kg). Arrows indicate time of injections; saline (SAL), pretreatment (PT) and treatment (SAL or METH). Thick dashed line represents the baseline, expressed as 100%. * Indicates significant within-group change in DOPAC in the SAL+METH group relative to baseline (p<0.05); $ indicates significant within-group change in DOPAC in GZ30+SAL group relative to baseline (p<0.05); and # indicates a significant between-group difference relative to the SAL+METH group at the same time point (p<0.05), n = 5 – 6 rats per group. Right Panel: Area under the curve (AUC) following treatment for each group. *Indicates significant difference between groups (p<0.05), n = 5 – 6 rats per group.
Figure 7
Figure 7. Regional Accumulation of DOPA Following GZ-793A and/or METH
Mean (± SEM) DOPA concentrations in tissue from nucleus accumbens (NAc) and striatum (STR) following administration of GZ-793A (GZ15; 15 mg/kg) and/or methamphetamine (METH; 0.5 mg/kg). *Indicates significant difference between groups (p<0.05), n = 8 ratsv per group.
Figure 8
Figure 8. Schematic Illustration Summarizing the Results
Upper Left Panel: Figure shows baseline control levels of extracellular DA, extracellular DOPAC and tissue DOPA. Upper Right Panel: Figure shows changes in extracellular DA, extracellular DOPAC and tissue DOPA following METH alone. The red X denotes blockade of VMAT2 activity due to METH serving as substrate that enters vesicle, thus releasing DA from vesicle; the red denotes enhancement of TH activity due to DA release into the extracellular space, thus removing end-product inhibition on TH. Also note that METH reverses DAT and that newly synthesized DA is most subject to this reversal. Lower Left Panel: The figure shows levels of extracellular DA, extracellular DOPAC and tissue DOPA following VMAT2 inhibitor alone. The red X denotes a direct inhibition of VMAT2, thus increasing cytosolic DA levels available for end product inhibition of TH and enhanced metabolism to DOPAC via MAO. Lower Right Panel: Figure shows METH-induced changes in extracellular DA, extracellular DOPAC and tissue DOPA following VMAT2 inhibitor and METH combination. The red X denotes blockade of VMAT2 activity, thus increasing cytosolic DA; the red denotes enhancement of TH activity due to DA release into extracellular space, thus removing end-product inhibition on TH. Note that reversal of DAT by METH normally produces enhanced DA synthesis by removal of end-product inhibition on TH; however, due to the presence of the VMAT2 inhibitor, there is continued end product inhibition and the effect of METH on DA synthesis is blunted (upper right vs. lower right panel). Thus, the decrease in TH activity leads to a reduction in METH-induced extracellular DA and also leads to a further decrease in DOPAC. Abbreviations: TH, tyrosine hydroxylase; tyr, tyrosine; DOPA, dihydroxyphenylalanine; DDC, dihydroxyphenylalanine decarboxylase; DA, dopamine; DOPAC, dihydroxyphenylacetic acid; MAO, monoamine oxidase; DAT, dopamine transporter; VMAT2, vesicular monoamine transporter 2.

References

    1. Alvers KM, Beckmann JS, Zheng G, Crooks PA, Dwoskin LP, Bardo MT. The effect of VMAT2 inhibitor GZ-793A on the reinstatement of methamphetamine-seeking in rats. Psychopharmacology (Berl) 2012;224:255–262. - PMC - PubMed
    1. Beckmann JS, Denehy ED, Zheng G, Crooks PA, Dwoskin LP, Bardo MT. The effect of novel VMAT2 inhibitor, GZ-793A, on methamphetamine reward in rats. Psychopharmacology. 2012;220:395–403. - PMC - PubMed
    1. Benwell ME, Balfour DJ. The influence of lobeline on nucleus accumbens dopamine and locomotor responses to nicotine in nicotine-pretreated rats. Br J Pharmacol. 1998;125:1115–1119. - PMC - PubMed
    1. Besson M, David V, Baudonnat M, Cazala P, Guilloux JP, Reperant C, Cloez-Tayarani I, Changeux JP, Gardier AM, Granon S. Alpha7-nicotinic receptors modulate nicotine-induced reinforcement and extracellular dopamine outflow in the mesolimbic system in mice. Psychopharmacology (Berl) 2012;220:1–14. - PubMed
    1. Brown JM, Hanson GR, Fleckenstein AE. Methamphetamine rapidly decreases vesicular dopamine uptake. J Neurochem. 2000;74:2221–2223. - PubMed

Publication types

MeSH terms

Substances