

Ibutilide increases the variability and complexity of atrial fibrillation electrograms: antiarrhythmic insights using signal analyses
- PMID: 23875908
- PMCID: PMC3809098
- DOI: 10.1111/pace.12224
Ibutilide increases the variability and complexity of atrial fibrillation electrograms: antiarrhythmic insights using signal analyses
Abstract
Introduction: Intravenous ibutilide is used to convert atrial fibrillation (AF) to sinus rhythm (SR) due to its Class III antiarrhythmic mechanisms. However, the effects of ibutilide on local electrograms (EGMs) during AF have not been elucidated.
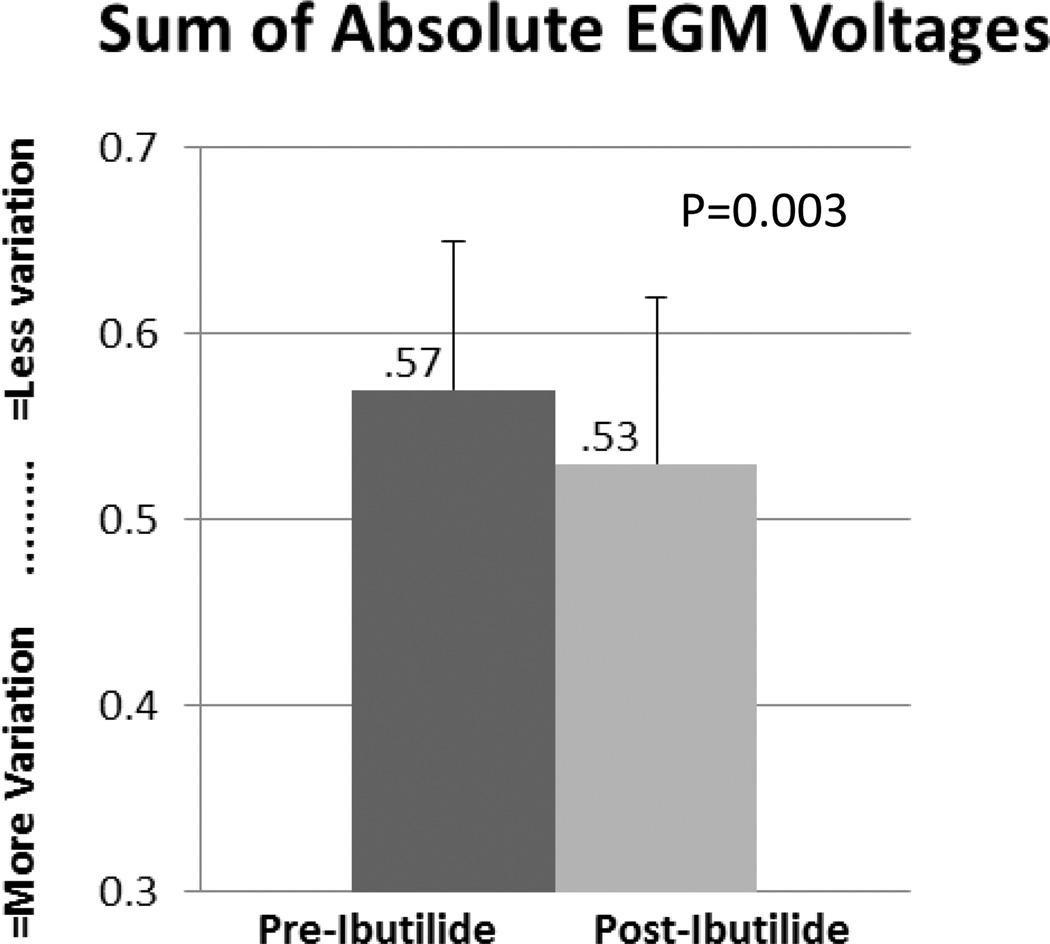
Methods and results: We used EGM analysis techniques to characterize how ibutilide administration changes the frequency, morphology, and repeatability of AF EGM signals, thereby providing insight into ibutilide's antiarrhythmic mechanism of action. AF recordings were collected from 21 patients with AF, both before and after ibutilide administration. The effects of ibutilide on the following AF EGM parameters were assessed: (1) dominant frequency (DF), (2) variations in EGM amplitude and overall morphology, (3) repetition of EGM patterns, and (4) complexity of the AF frequency spectra. When comparing pre- versus post-ibutilide administration EGMs, DF decreased from 5.45 Hz to 4.02 Hz (P < 0.0001). There was an increase in the variability of both AF EGM amplitudes (P = 0.003) and overall AF EGM morphologies (P = 0.003). AF EGM pattern repetitiveness decreased (P = 0.01), and the AF frequency spectral profile manifested greater complexity (P = 0.02).
Conclusions: Novel EGM signal analysis techniques reveal that ibutilide administration causes increased complexity in the atrial electrical activation pattern with decreasing rate. These findings may be explained by the progressive destabilization of higher frequency, more homogeneous primary drivers of AF over the course of ibutilide administration, and/or less uniform propagation of atrial activation, until AF maintenance becomes more difficult and either transforms to atrial tachycardia or terminates to SR.
Keywords: atrial fibrillation; dominant frequency; electrogram analysis; ibutilide; linear prediction.
©2013, The Authors. Journal compilation ©2013 Wiley Periodicals, Inc.
Figures


Similar articles
-
Atrial electrophysiological effects of ibutilide infusion in humans.Pacing Clin Electrophysiol. 2000 May;23(5):832-6. doi: 10.1111/j.1540-8159.2000.tb00851.x. Pacing Clin Electrophysiol. 2000. PMID: 10833702
-
Antiarrhythmic actions of intravenous ibutilide compared with procainamide during human atrial flutter and fibrillation: electrophysiological determinants of enhanced conversion efficacy.Circulation. 1997 Dec 16;96(12):4298-306. doi: 10.1161/01.cir.96.12.4298. Circulation. 1997. PMID: 9416896 Clinical Trial.
-
High-density mapping of pulmonary veins and left atrium during ibutilide administration in a canine model of sustained atrial fibrillation.Am J Physiol Heart Circ Physiol. 2005 Dec;289(6):H2704-13. doi: 10.1152/ajpheart.00537.2005. Epub 2005 Jul 29. Am J Physiol Heart Circ Physiol. 2005. PMID: 16055519
-
Efficacy of ibutilide for termination of atrial fibrillation and flutter.Am J Cardiol. 1996 Oct 17;78(8A):42-5. doi: 10.1016/s0002-9149(96)00565-6. Am J Cardiol. 1996. PMID: 8903275 Review.
-
Old and new antiarrhythmic drugs for converting and maintaining sinus rhythm in atrial fibrillation: comparative efficacy and results of trials.Am J Cardiol. 2003 Mar 20;91(6A):15D-26D. doi: 10.1016/s0002-9149(02)03375-1. Am J Cardiol. 2003. PMID: 12670638 Review.
Cited by
-
Low-Voltage Zones as the Atrial Fibrillation Substrates: Relationship With Initiation, Perpetuation, and Termination.Front Cardiovasc Med. 2021 Aug 2;8:705510. doi: 10.3389/fcvm.2021.705510. eCollection 2021. Front Cardiovasc Med. 2021. PMID: 34409078 Free PMC article.
-
Increased body mass index, age, and left atrial size are associated with altered intracardiac atrial electrograms in persistent atrial fibrillation patients.J Interv Card Electrophysiol. 2021 Dec;62(3):569-577. doi: 10.1007/s10840-020-00933-5. Epub 2021 Jan 12. J Interv Card Electrophysiol. 2021. PMID: 33432475
-
Atrial Tachycardias After Atrial Fibrillation Ablation Manifest Different Waveform Characteristics: Implications for Characterizing Tachycardias.J Cardiovasc Electrophysiol. 2015 Nov;26(11):1187-1195. doi: 10.1111/jce.12770. Epub 2015 Sep 13. J Cardiovasc Electrophysiol. 2015. PMID: 26228873 Free PMC article.
-
Atrial electrogram discordance during baseline vs reinduced atrial fibrillation: Potential ramifications for ablation procedures.Heart Rhythm. 2015 Jul;12(7):1448-55. doi: 10.1016/j.hrthm.2015.03.044. Epub 2015 Mar 26. Heart Rhythm. 2015. PMID: 25818256 Free PMC article.
References
-
- Roberts-Thomson KC, Kistler PM, Sanders P, Morton JB, Haqqani HM, Stevenson I, Vohra JK, et al. Fractionated atrial electrograms during sinus rhythm: Relationship to age voltage, and conduction velocity. Heart Rhythm. 2009;6:587–591. - PubMed
-
- Narayan SM, Wright M, Derval N, Jadidi A, Forclaz A, Nault I, Miyazaki S, et al. Classifying fractionated electrograms in human atrial fibrillation using monophasic action potentials and activation mapping: Evidence for localized drivers, rate acceleration, and nonlocal signal etiologies. Heart Rhythm. 2011;8:244–253. - PMC - PubMed
Publication types
MeSH terms
Substances
Grants and funding
LinkOut - more resources
Full Text Sources
Other Literature Sources
Medical
Research Materials
Miscellaneous
