. 2013:4:2189.
doi: 10.1038/ncomms3189.

Identification of ROCK1 kinase as a critical regulator of Beclin1-mediated autophagy during metabolic stress

Affiliations

Identification of ROCK1 kinase as a critical regulator of Beclin1-mediated autophagy during metabolic stress

Aditi U Gurkar et al. Nat Commun. 2013.

Abstract

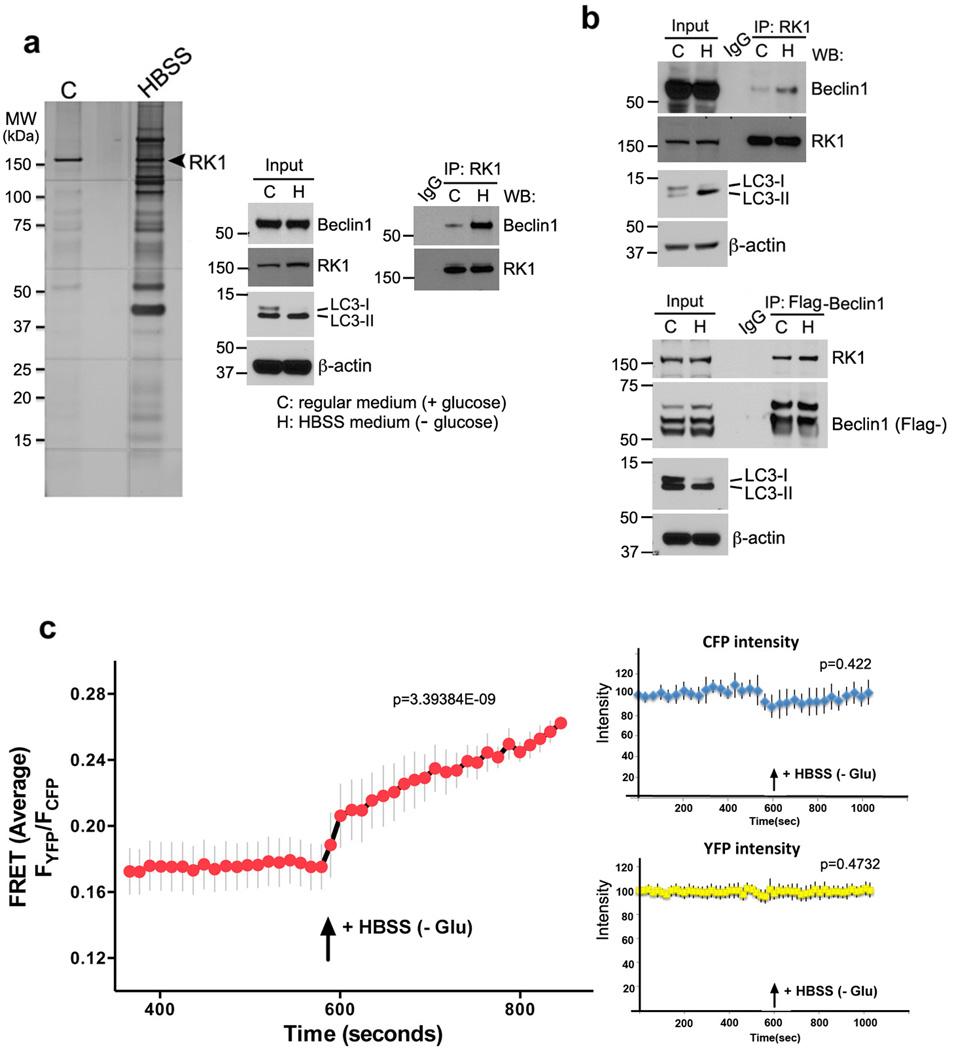
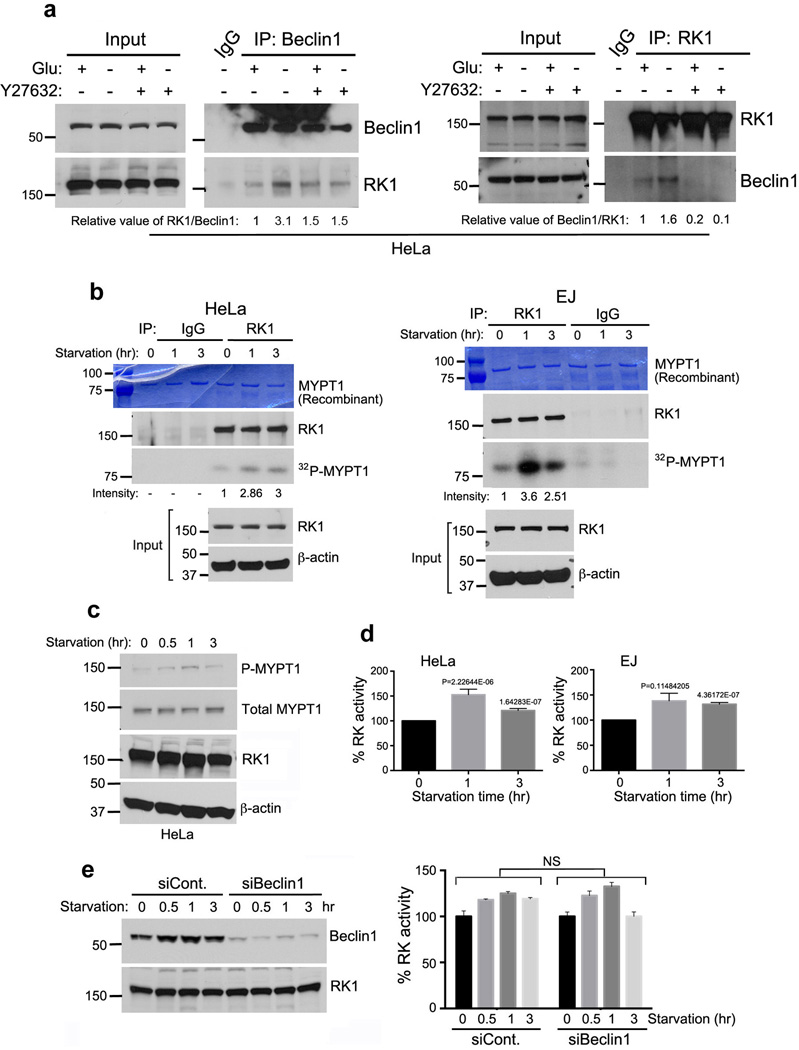
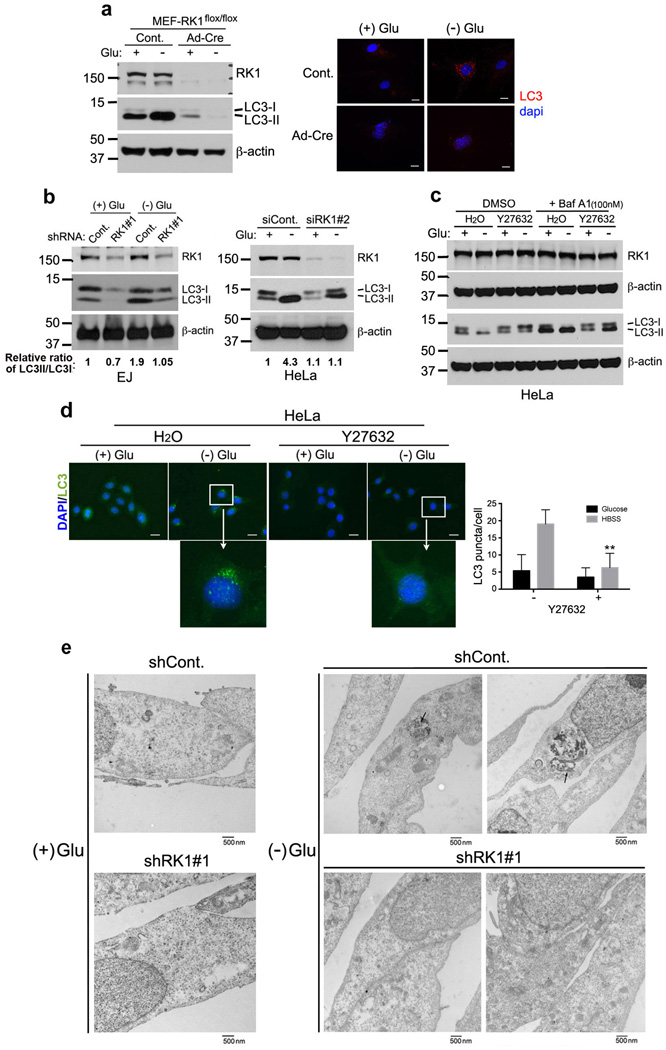
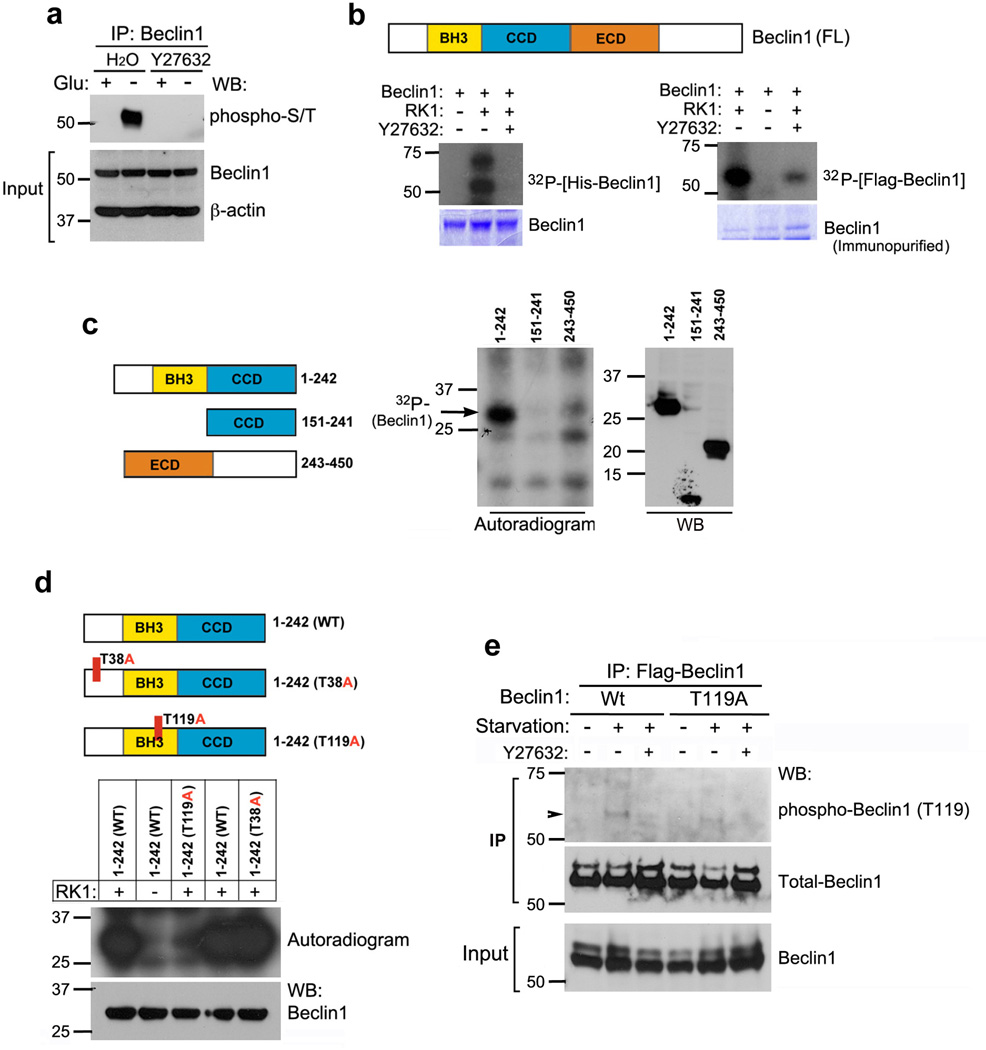
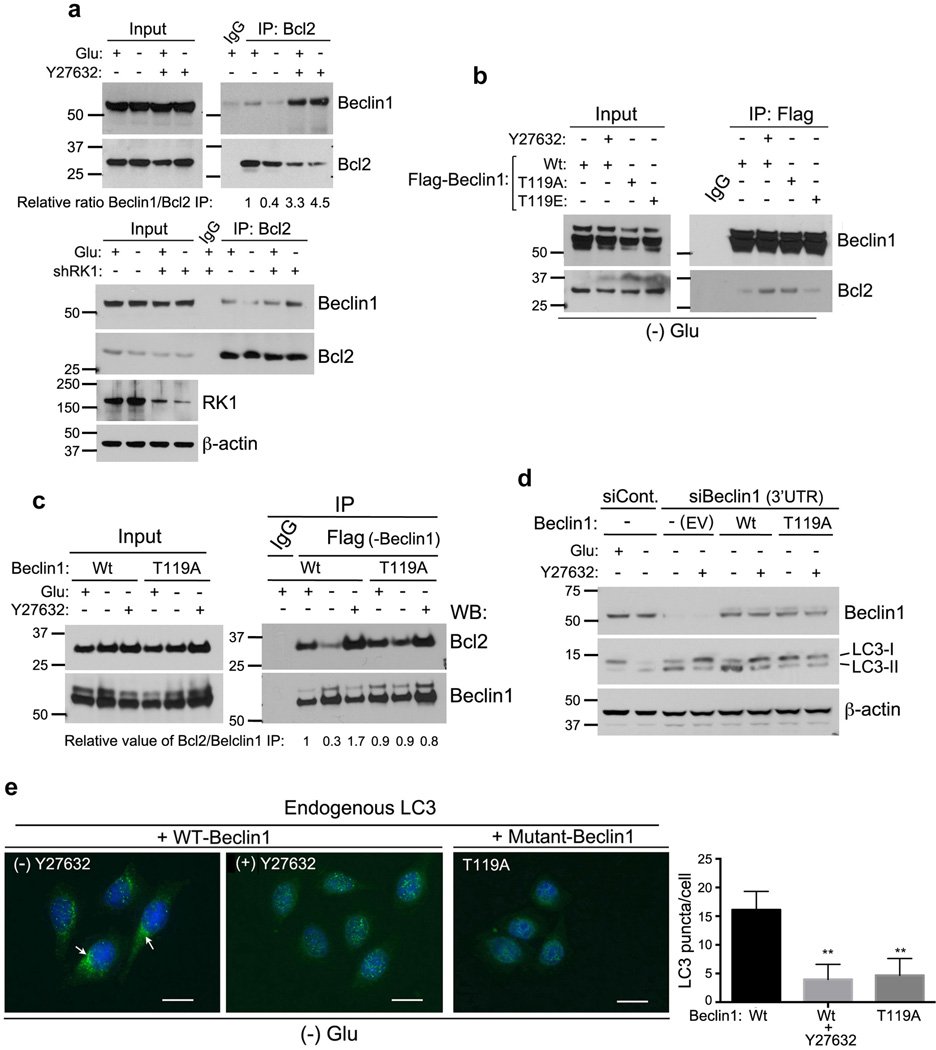
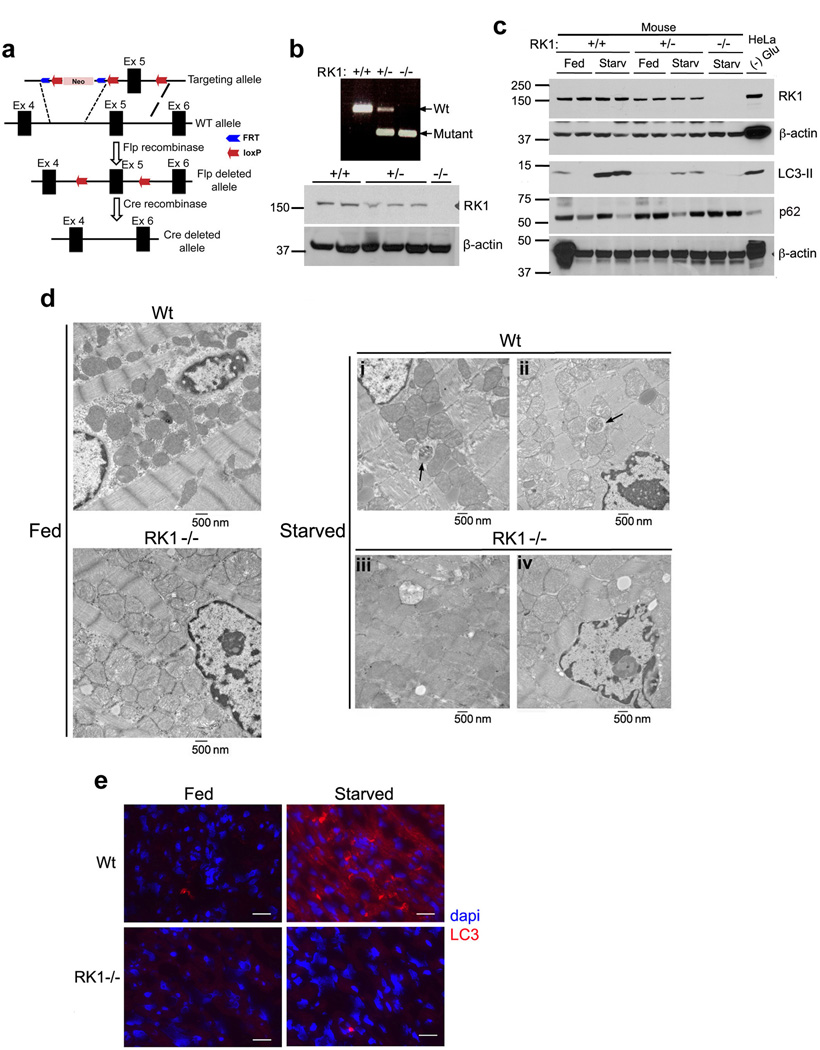
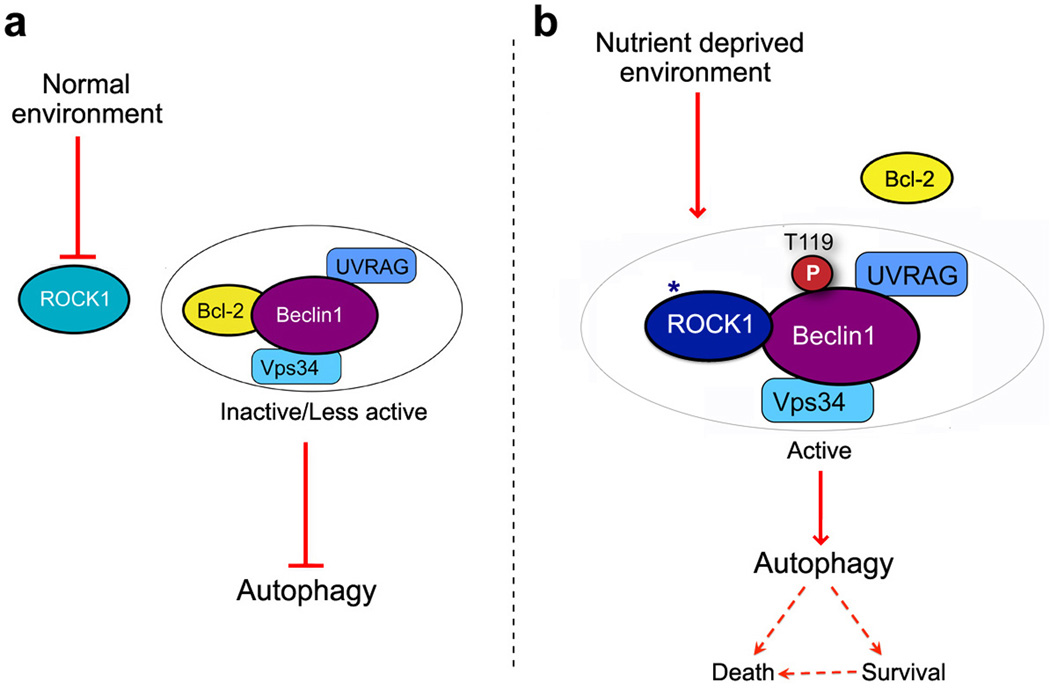
The Ser/Thr Rho kinase 1 (ROCK1) is known to have major roles in a wide range of cellular activities, including those involved in tumour metastasis and apoptosis. Here we identify an indispensable function of ROCK1 in metabolic stress-induced autophagy. Applying a proteomics approach, we characterize Beclin1, a proximal component of the phosphoinositide 3-kinase class III lipid-kinase complex that induces autophagy, as an interacting partner of ROCK1. Upon nutrient deprivation, activated ROCK1 promotes autophagy by binding and phosphorylating Beclin1 at Thr119. This results in the specific dissociation of the Beclin1-Bcl-2 complex without affecting the Beclin1-UVRAG interaction. Conversely, inhibition of ROCK1 activity increases Beclin1-Bcl-2 association, thus reducing nutritional stress-mediated autophagy. Genetic knockout of ROCK1 function in mice also leads to impaired autophagy as evidenced by reduced autophagosome formation. These results show that ROCK1 acts as a prominent upstream regulator of Beclin1-mediated autophagy and maintains a homeostatic balance between apoptosis and autophagy.


Figures

Figure 1
Figure 1. Functional interaction of Beclin1 with ROCK1 upon metabolic stress
(a) Identification of Beclin1 as a substrate of ROCK1 via affinity purification. Left panel: HeLa cells growing in control (C: nutrient-rich media) or starved in HBSS (H) for 4 h were lysed and subjected to immunoprecipitation with ROCK1 cross-linked beads. Proteins bound were eluted and detected by SDS-PAGE, followed by silver staining which presents precipitated proteins identified by LC-MS/MS. Right panel: HeLa cells grown in control media or HBSS (4 h) were harvested, whole cell lysates prepared and immunoprecipitated with ROCK1 cross-linked beads. The resulting immune-complexes were divided into two and subjected to SDS-PAGE and analyzed for Beclin1 (MES buffer) and ROCK1 (MOPS buffer). Inputs and IP were analyzed by western blotting. HBSS treated cell extracts were used for IgG immunoprecipitation controls. Whole cell lysates (10%) were run for inputs. Total cell lysates were re-run and analyzed for LC3 and β-actin. (b) Co-immunoprecipitation was performed with 293T whole cell extracts using ROCK1-cross linked agarose, and the resulting IP was blotted with indicated antibodies. 293T cells transfected with Flag-Beclin1 for 36 h, cultured in control media or starved (4 h), were immunoprecipitated with anti-Flag beads. Inputs and immune-complexes were resolved and detected. Total cell lysates were re-run and examined for LC3 and β-actin expression. (c) Interaction of YFP-ROCK1 and CFP-Beclin1 was examined by using live cell spinning disk microscopy and FRET in live cells. Graph represents FRET Average ratio changes (YFP-ROCK1/CFP-Beclin1) upon starvation. Data represents mean ± s.e.m; n=6. Three different experiments were performed. For the control, the right top graph represents CFP intensity over time (corrected for photobleach), and the right bottom right represents YFP intensity (corrected for photobleach). In both control FRET experiments, no significant change was observed in fluorescence, in the presence or absence of HBSS medium.
Figure 2
Figure 2. ROCK1 is activated upon metabolic stress
(a) Inhibition of ROCK1 activity ablates the interaction between Beclin1 and ROCK1. HeLa cells were untreated (H2O) or treated with 10 µM ROCK1 inhibitor, Y27632, for 8 h and then cultured in control media (+) or HBSS (-) for 4 h. Cells were harvested, lysed and immunoprecipitated with Beclin1 (left panel) or ROCK1 (right panel) antibody. Left panel- Immune-complexes were divided into two (ROCK1-MOPS buffer and Beclin1-MES buffer) and probed for ROCK1 and Beclin1. Relative values of ROCK1 versus Beclin1 are shown. (b) An increase in ROCK1-mediated phosphorylation of MYPT1 upon starvation. HeLa and EJ cells were starved in HBSS for indicated time-points and endogenous ROCK1 was immunoprecipitated. An in vitro kinase assay was performed using MYPT1 as substrate and immune-complexed ROCK1. Proteins were resolved and visualized with Coomassie (top), western blot (middle) and autoradiography (bottom). Inputs were examined for ROCK1 and β-actin. (c) HeLa cells incubated in HBSS were harvested and endogenous phosphorylation of MYPT1 was determined by western blotting. The same blot was then washed in TBST for 30 min, blocked in 5% milk and analyzed for total MYPT1 as a control. Extracts from this experiment were re-run on 7.5% gel and analyzed for ROCK1 and β-actin. (d) ROCK activity is increased upon starvation. Cell lines (HeLa and EJ) grown in control (+Glu) or starved with HBSS for 1 and 3 h were lysed, extracts normalized and ROCK kinase activity was measured by ELISA. Graphs represent ROCK activity in starved cells plotted as percent of ROCK1 activity in control (glucose-rich) cells. Data was obtained from triplicates performed at the same time (mean±s.d.). p-value was calculated using Student’s t-test. (e) ROCK1 activity is not dependent on Beclin1. siControl (siCont.) and siBeclin1 knockdown cells were incubated in starvation media (HBSS) for indicated time. Resulting cell extracts were used to confirm Beclin1 knockdown and ROCK1 expression (left panel). Cell extracts from the same experiment were used for ELISA measuring ROCK activity (right panel). Graph represents mean±s.d. of duplicate samples read at the same time (Student t-test: NS=not significant).
Figure 3
Figure 3. ROCK1 activity is essential for metabolic stress-induced autophagy
(a) The effect of ROCK1 depletion on autophagy marker, LC3II. MEF ROCK1flox/flox cells were generated and treated with Con or Ad-Cre for 72h. Cells were then incubated in nutrient rich (+Glucose) or HBSS media for 2h. Cell extracts were resolved by SDS-PAGE and ROCK1 knockout was confirmed by western blotting (left panel). The same blot was used for LC3 and β-actin expression. Cells from the same experiment were fixed with chilled acetone and immunofluroscence was performed against endogenous LC3 (red). Blue represents nuclear dapi staining. (b) EJ cells (left) with a stable knockdown using shCont. or shROCK1#1 were incubated in control (+ glucose) or nutrient-free (HBSS) medium (− glucose) for 24 h and lysed. Lysates were subjected to western blotting with antibodies indicated. HeLa cells (right) with a transient knockdown using siCont. and siROCK1#2 for 30 h were further incubated in control or HBSS media for 8 h. Whole cell extracts were prepared, resolved by SDS-PAGE and analyzed for ROCK1, LC3 and β-actin. Relative ratios of LC3II/LC3I are shown. (c) HeLa cells were treated with H2O or 10 µM ROCK1 inhibitor, Y27632, for 8 h. Cells were then cultured in high glucose (0 h) or starved for in HBSS nutrient-free media for 6h. 1h prior to harvest, cells were incubated in DMSO (control) or 0.1 µM bafilomycin-A1. Whole cell lysates were resolved by SDS-PAGE and analyzed by western blotting with indicated antibodies. (d) HeLa cells incubated with H2O or 10 µM Y27632 for 8 h were washed with PBS and cultured in control (+ Glu) or HBSS media (− Glu) for an additional 8 h. Cells were fixed in acetone and immunofluorescence was performed against endogenous LC3 antibody (green). Scale = 20 µm. Graph represents % of LC3 punctae/cell (mean±SD), n=25 cells; (Student t-test) **, p= 0.00041 (e) Transmission electron micrographs of EJ cells with stable shCont. or shROCK1#1 knockdown, cultured in control or HBSS medium for 16 h. Arrow bars indicate autophagic vacuoles. Scale = 500 nm.
Figure 4
Figure 4. Metabolic stress induces Beclin1 phosphorylation by ROCK1
(a) Inhibition of ROCK1 kinase activity prevents metabolic stress-mediated phosphorylation of Beclin1. HeLa cells left untreated or treated with a ROCK1 inhibitor, Y27632 (10 µM) were starved of glucose (4 h) as indicated, and endogenous Beclin1 was immunoprecipitated and blotted against phospho-Ser/Thr antibody. Whole cell lysates were run as inputs for Beclin1 and β-actin. (b) Phosphorylation of Beclin1 by ROCK1. Recombinant ROCK1 was used for in vitro kinase assay in the presence or absence of Y27632, using recombinant His-Beclin1 (left) or Flag-Beclin1 immunopurified from transfected HeLa cells (right). Proteins were resolved by SDS-PAGE; phosphorylated protein was visualized with autoradiography, and Beclin1 by Coomassie staining. (c) Identification of ROCK1-mediated phosphorylation domains in Beclin1. The indicated Flag-Beclin1 fragments were purified from HeLa cells and used as substrates for in vitro ROCK1 kinase assay.32P-autoradiogram (center) analyzed phosphorylation and western blotting (right) determined protein levels. Schematic representation of Beclin1 domain structure and deletion constructs are shown (left). (d) Identification of the phosphorylation site on Beclin1. Representation of point mutations in the different domains of Beclin1 are shown (left). In vitro kinase assay using Flag-Beclin1 WT and mutants (T38A and T119A), immunoprecipitated from transfected HeLa cells, as substrate and recombinant ROCK1 was performed. Phosphorylation was detected by32P-autoradiogram, and Flag-Beclin1 levels were examined by western blotting. (e) Flag-Beclin1 Wt or T119A transfected HeLa cells were incubated in glucose-rich or nutrient free (HBSS) media, in the presence or absence of ROCK1 inhibitor Y27632. Total cell extracts were used for immunoprecipitation using Flag agarose. Eluted protein was analyzed by western blotting against phospho-T119 (Beclin) antibody and Beclin1. Input for Beclin1 was run on 7.5% gel and immunoblotted.
Figure 5
Figure 5. ROCK1 phosphorylation of Beclin1 at T119 promotes Bcl-2 dissociation
(a) Inhibiting ROCK1 activity increases the association between Beclin1 and Bcl-2. HeLa cells untreated or treated with 10 µM Y27632 (top panel) were cultured in control or glucose free (4 h) medium, lysed and cell extracts prepared. Endogenous Bcl-2 was immunoprecipitated with cross-linked Bcl-2 agarose and resulting eluted immune-complexes were resolved by SDS-PAGE and blotted against indicated antibodies. EJ shCont. and shROCK1#1 cells (bottom panel) were grown in control or starvation media for 4 h and Bcl-2 IP was performed as above. Inputs were re-run to confirm ROCK1 knockdown. (b) HeLa cells were transfected with full-length constructs of Flag-Beclin WT, Flag-Beclin T119A or Flag-Beclin T119E. Flag-Beclin WT cells were then treated with Y27632 for 8 h. Post-transfection and treatment with Y27632, cells were starved in HBSS medium for 4 h, after which cells were harvested and whole cell lysates prepared. Immunoprecipitation with Flag-agarose was performed for 2 h and proteins bound to beads were eluted and used for western blotting. (c) Flag-Beclin1 Wt or T119A transfected HeLa cells were incubated in glucose-rich or nutrient free (HBSS) media, in the presence or absence of ROCK1 inhibitor Y27632. Total cell extracts were used for immunoprecipitation using Flag agarose. Eluted protein was analyzed by western blotting against Bcl-2 and Beclin1. Inputs and IP were run on separate gels and same exposure is shown. (d) HeLa cells with a transient knockdown using siCont. and siBeclin1–3’UTR for 30 h were further left untreated or treated with 10µM Y27632. Cells were then incubated in control or HBSS media for 8 h. Whole cell extracts were prepared, resolved by SDS-PAGE and analyzed for Beclin1, LC3 and β-actin. (e) Endogenous LC3 staining in WT- or T119A-Beclin1 transfected cells. HeLa cells transfected with Flag-Beclin WT (±Y27632) and T119A were cultured in HBSS media for 6 h, fixed with cold acetone and endogenous LC3 immunofluorescence was performed. Representative images are shown; Scale = 20 µm. Arrows indicate punctate LC3 staining. Graph represents (mean±SD), n=25, LC3 puncta/cell.
Figure 6
Figure 6. Disruption of ROCK1 leads to impaired autophagy in vivo
(a) Genomic structure of ROCK1 (exon 4–6 only) with targeted allele, Flp deleted allele and Cre deleted allele. (b) PCR assay using tail genomic DNA from three different genotypes, separated on 0.7% agarose gel (top). Western blot analysis of ROCK1 expression in the heart tissue from three different genotypes using anti-ROCK1 antibody (bottom). β-actin was used for protein loading control in each lane. (c) Mice were fed or starved for 16 h, and heart samples were prepared in lysis buffer. Resulting proteins were resolved by SDS-PAGE and blotted against ROCK1, LC3, autophagy marker p62 and β-actin. (d) ROCK1 deficient hearts or control hearts from animals fed or starved for 16 h were subjected to electron microscopy to identify autophagosome structures. Arrows indicate autophagic vacuoles. Scale bar = 500 nm (e) Hearts from fed and starved ROCK1 WT and KO mice were sectioned, fixed in acetone and immunofluorescence assay was performed against endogenous LC3. Data are representative of 2 independent experiments from each genotype.
Figure 7
Figure 7. A working model of ROCK1-mediated autophagy during nutrient stress
(a) Normal environment with sufficient glucose and nutrients suppresses ROCK1 activity. Bcl-2 thus associates with Beclin1 core complex (Vps34 and UVRAG) and keeps autophagy in check. (b) When the cellular environment is deprived of nutrients, ROCK1 kinase is stimulated. ROCK1 binds and phosphorylates Beclin1 at T119 and disrupts Beclin1-Bcl-2 interaction. Dissociation of Bcl-2 triggers Beclin1 core complex to induce autophagy and maintain a balance between cell survival and apoptosis.

References

    1. Ishizaki T, et al. The small GTP-binding protein Rho binds to and activates a 160 kDa Ser/Thr protein kinase homologous to myotonic dystrophy kinase. Embo J. 1996;15:1885–1893. - PMC - PubMed
    1. Riento K, Ridley AJ. Rocks: multifunctional kinases in cell behaviour. Nat Rev Mol Cell Biol. 2003;4:446–456. - PubMed
    1. Li Z, et al. Regulation of PTEN by Rho small GTPases. Nat Cell Biol. 2005;7:399–404. - PubMed
    1. Lee DH, et al. Targeted disruption of ROCK1 causes insulin resistance in vivo. J Biol Chem. 2009;284:11776–11780. - PMC - PubMed
    1. Ongusaha PP, et al. Identification of ROCK1 as an upstream activator of the JIP-3 to JNK signaling axis in response to UVB damage. Sci Signal. 2008;1:ra14. - PMC - PubMed

Publication types

MeSH terms