. 2013 Aug;23(8):1025-42.
doi: 10.1038/cr.2013.98. Epub 2013 Jul 23.

Viral degradasome hijacks mitochondria to suppress innate immunity

Affiliations

Viral degradasome hijacks mitochondria to suppress innate immunity

Ramansu Goswami et al. Cell Res. 2013 Aug.

Abstract

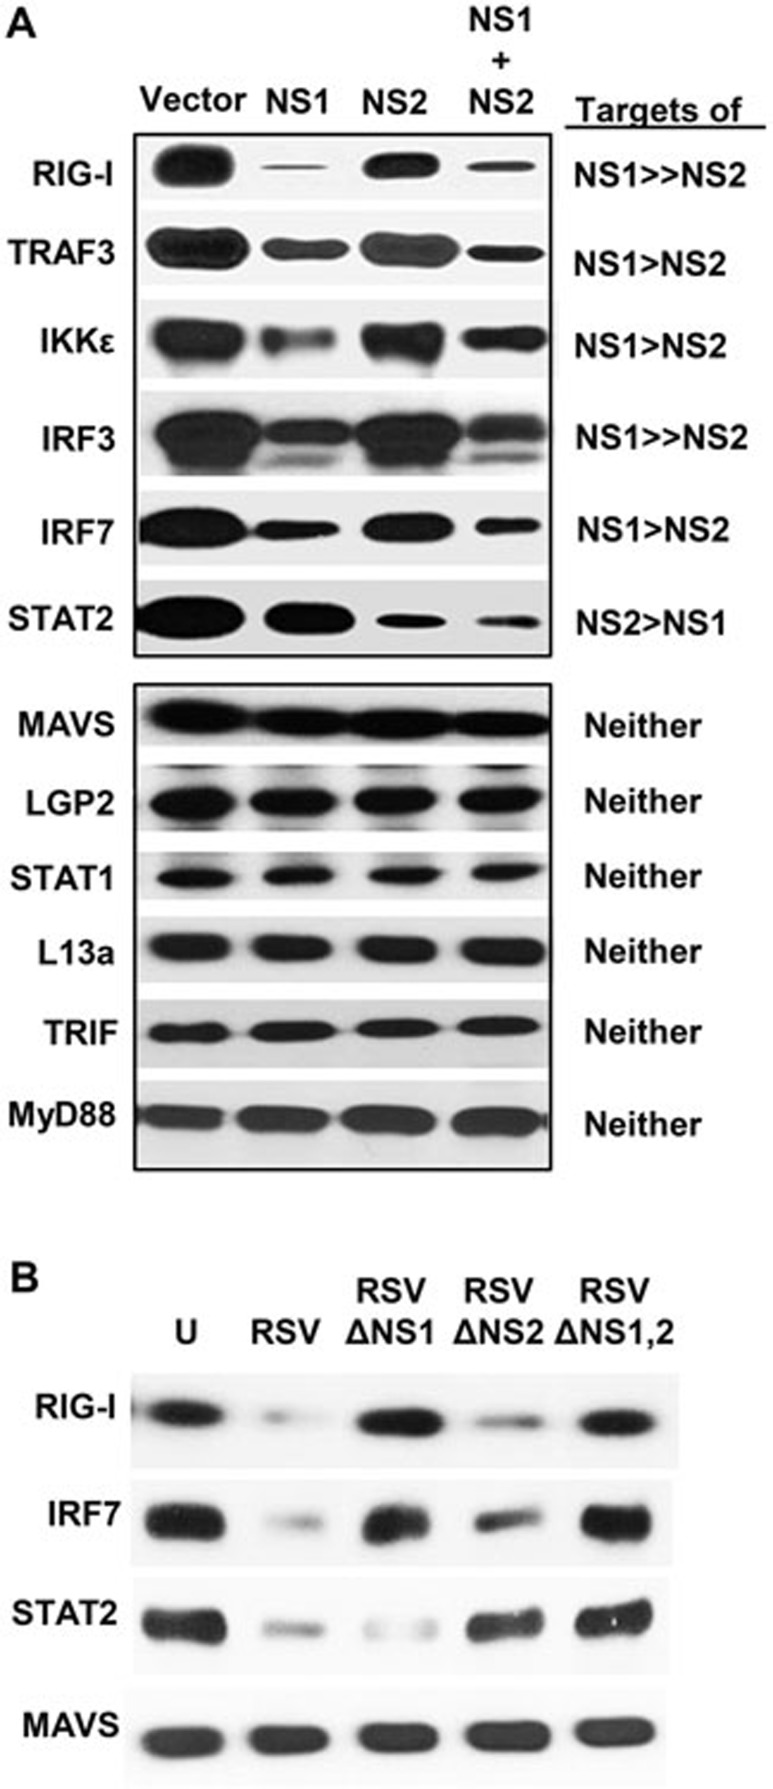
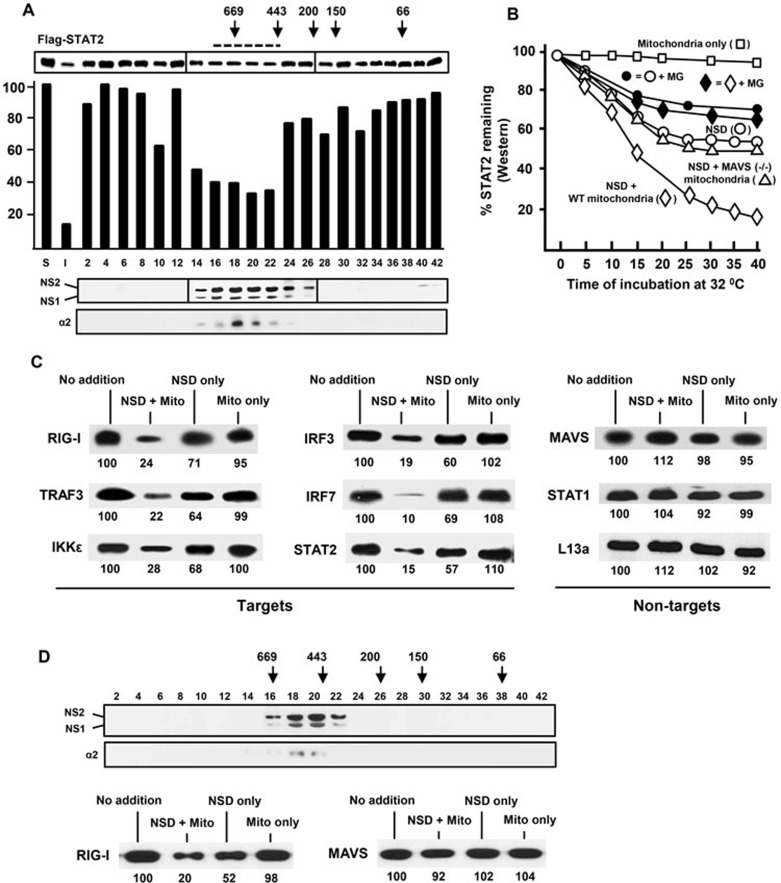
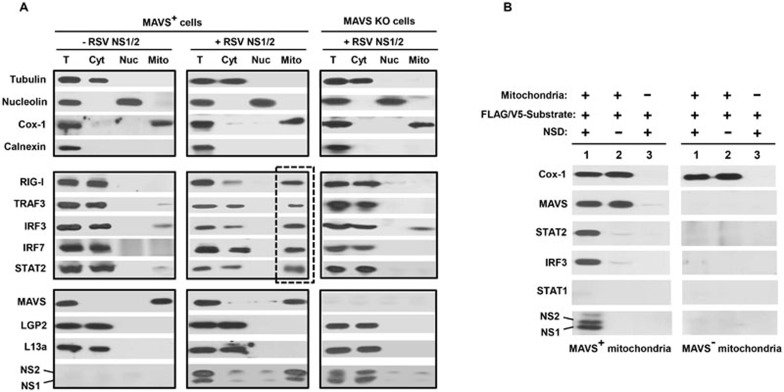
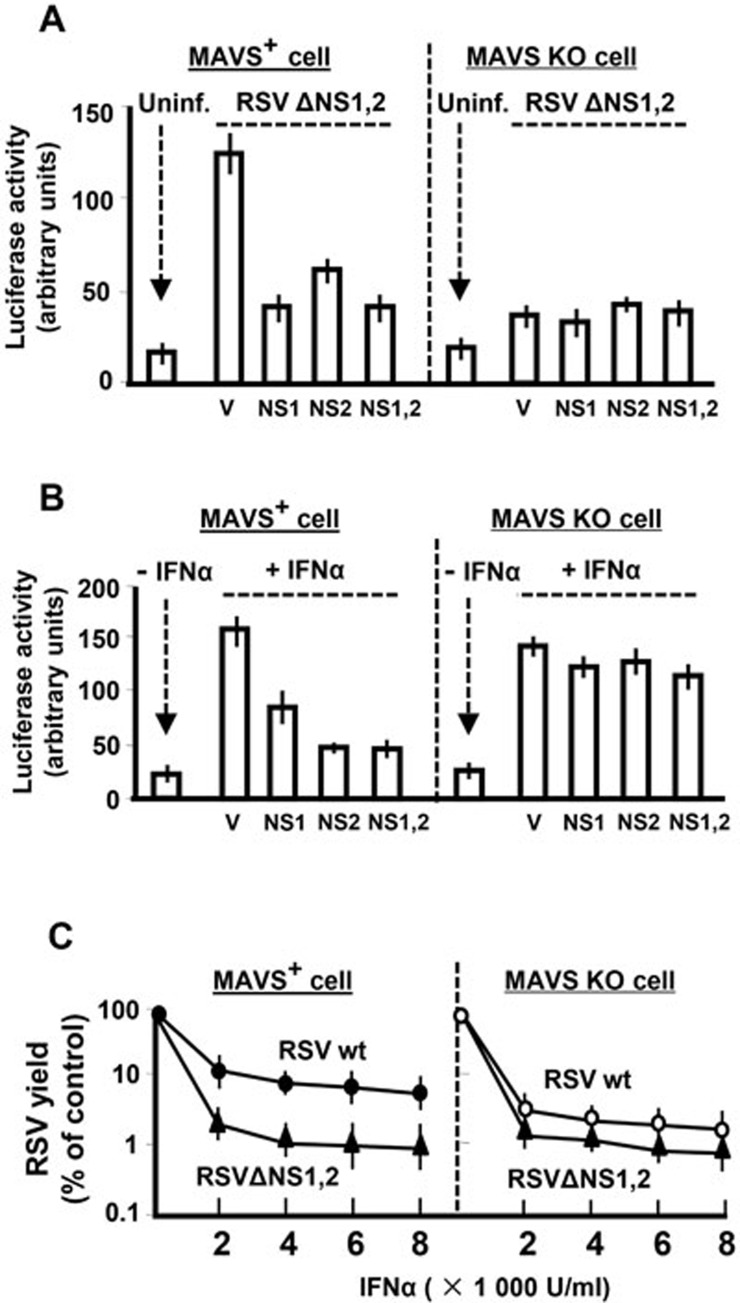
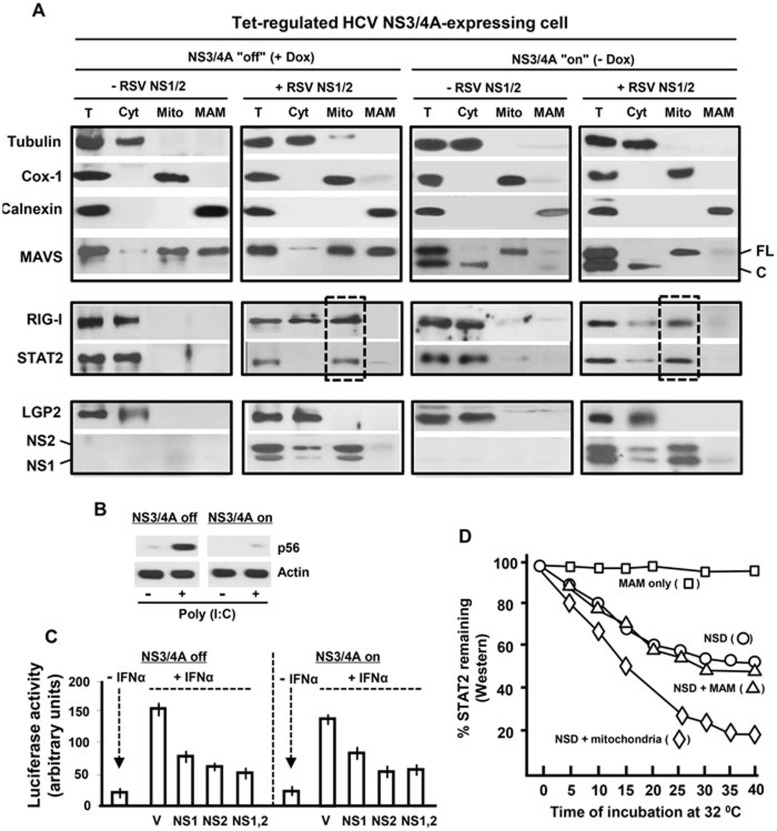
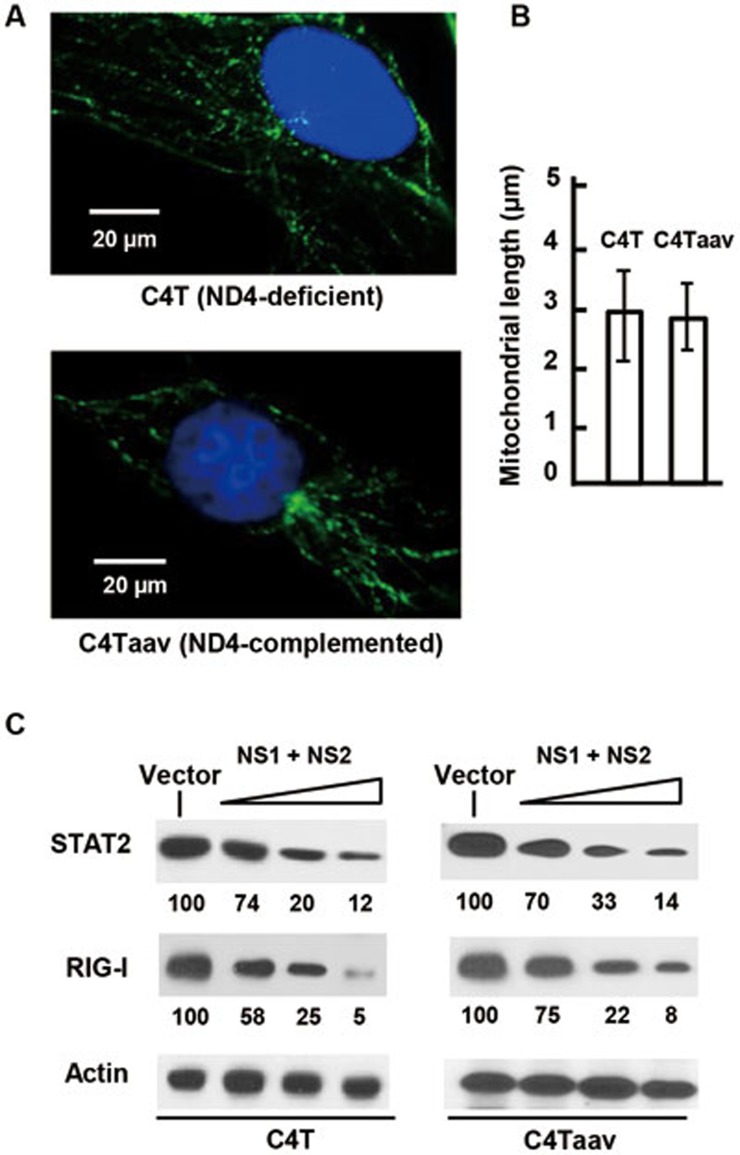
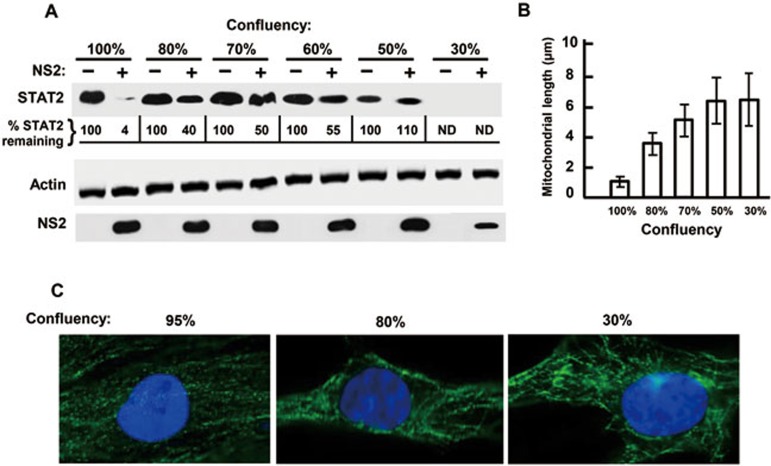
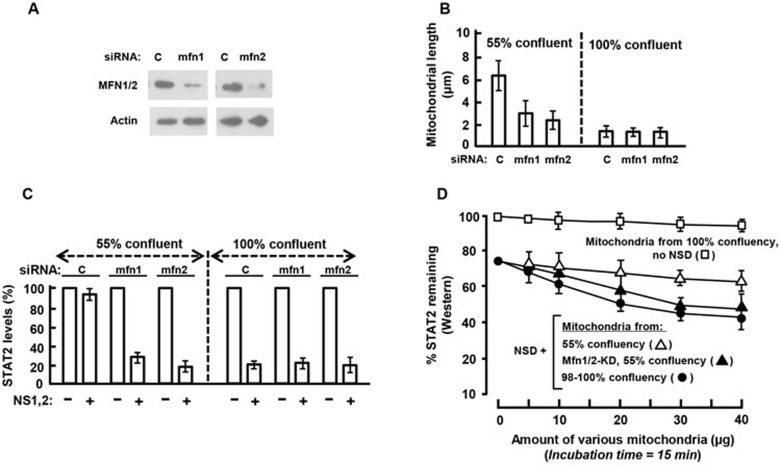
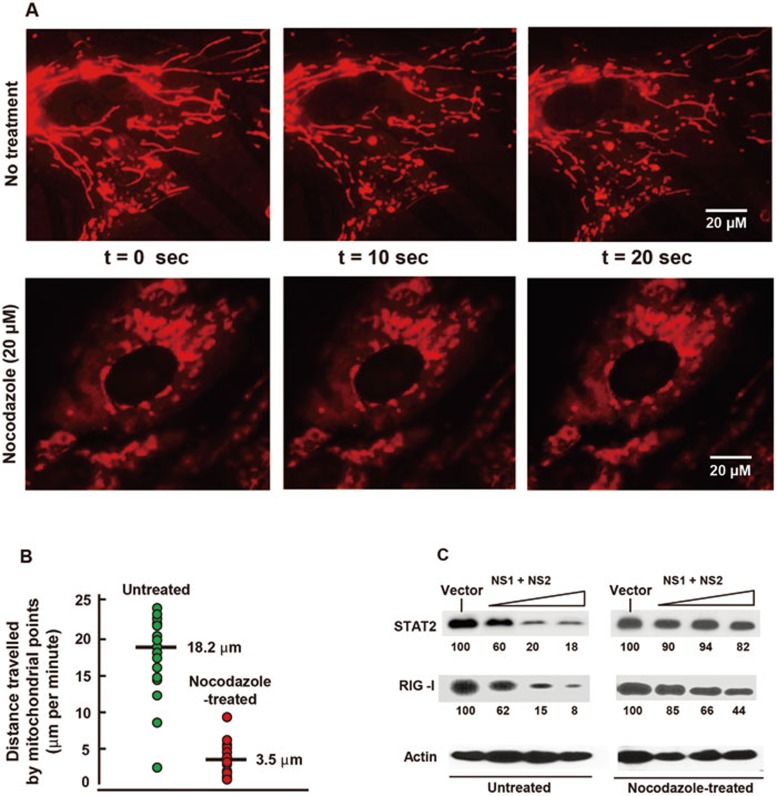
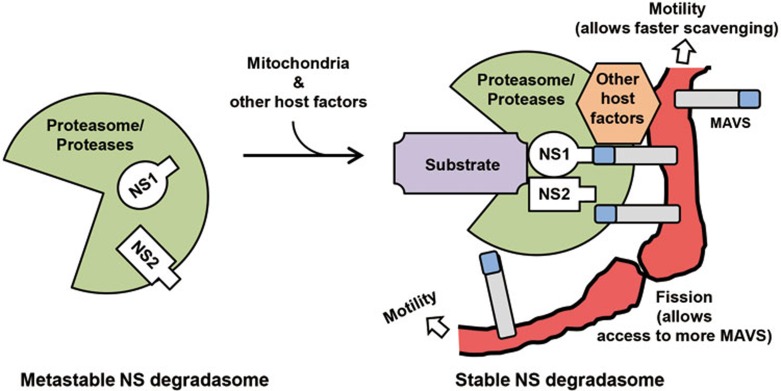
The balance between the innate immunity of the host and the ability of a pathogen to evade it strongly influences pathogenesis and virulence. The two nonstructural (NS) proteins, NS1 and NS2, of respiratory syncytial virus (RSV) are critically required for RSV virulence. Together, they strongly suppress the type I interferon (IFN)-mediated innate immunity of the host cells by degrading or inhibiting multiple cellular factors required for either IFN induction or response pathways, including RIG-I, IRF3, IRF7, TBK1 and STAT2. Here, we provide evidence for the existence of a large and heterogeneous degradative complex assembled by the NS proteins, which we named "NS-degradasome" (NSD). The NSD is roughly ∼300-750 kD in size, and its degradative activity was enhanced by the addition of purified mitochondria in vitro. Inside the cell, the majority of the NS proteins and the substrates of the NSD translocated to the mitochondria upon RSV infection. Genetic and pharmacological evidence shows that optimal suppression of innate immunity requires mitochondrial MAVS and mitochondrial motility. Together, we propose a novel paradigm in which the mitochondria, known to be important for the innate immune activation of the host, are also important for viral suppression of the innate immunity.


Figures

Figure 1
Figure 1
Degradation of various innate immune proteins by NS1 and NS2 overexpression. (A) The experiment was performed as described previously. A549 cells in 24-well plates were transfected with 0.6 μg of the indicated recombinant plasmids of various targets (shown on left) and 0.6 μg of either the vector (pCAGGS), or pCAGGS-NS1 or pCAGGS-NS2, or both. At 24 h post transfection, total proteins were analyzed by immunoblotting with one of these primary antibodies: V5 (IRF3), HA (MAVS, L13a), LGP2, and FLAG for all the rest. The relative degradation degree of each target by NS1 or NS2 is indicated on the right. (B) Degradation of representative targets upon the infection of WT or NS-deleted RSV. The A549 cells were infected with WT RSV or various NS-deleted RSV strains at an m.o.i. of 3, and the total cell extracts were subjected to immunoblotting as in A. U = uninfected cells.
Figure 2
Figure 2
Isolation and analysis of NSD. (A) Size-fractionation of NSD by Superdex chromatography. The column was pre-calibrated with the following marker proteins: thyroglobulin 669 kD; apoferritin 443 kD, β-amylase 200 kD, alcohol dehydrogenase 150 kD, BSA 66 kD; their elution positions are marked with arrows. Various fractions were analyzed by immunoblotting for FLAG-tagged NS1 and NS2. The bar graph represents the degradative activity of the fractions towards STAT2, plotted for the remaining amounts of STAT2 after the in vitro NSD degradation reaction that was performed for 20 min at 32 °C. The un-numbered bars at the extreme left (S, I) represent the following: “S”, no-NSD control reaction, taken as 100, and other bars were plotted as its percentage; “I”, reaction used 2 μl of the input extracts (pre-Superdex) instead of the fractions. The fractions pooled as “NSD” (#16-22) are indicated by the horizontal broken line. The 20S core proteasomal subunit α2 was detected by immunoblotting using B-4 antibody. (B) Enhanced degradative activity of NSD by mitochondrial supplementation. Where mentioned, mitochondria were prepared from MAVS KO (−/−) mouse embryonic fibroblasts (MEFs). Each reaction was sampled at 5 min intervals during incubation, starting at 5 min after the addition of the pooled NSD fractions obtained from A. The amounts of residual FLAG-STAT2 were quantified by immunoblotting. The NSD-only reaction (○) was performed as in A; addition of WT mitochondria (◊) enhanced NSD activity, whereas MAVS-deficient mitochondria (Δ) did not. The control, “no-NSD” reaction supplemented with just mitochondria (□) showed little STAT2 degradation. Parallel reactions (indicated by the corresponding filled symbols, ♦, •) contained MG132 (MG, 20 μM). (C) NSD substrate profile. A number of recombinant IFN signaling-related proteins overexpressed in the A549 cells were immunoprecipitated and used as substrates in “NSD + mitochondria” reaction. All reactions were incubated at 32 °C for 20 min. No addition = immunoprecipitated substrate only; NSD only = no mitochondria; Mito only = no NSD. Non-targets (right panel) are proteins whose expression was not affected by the ectopic expression of NS proteins. (D) NSD in RSV-infected cells. The A549 cells were infected with RSV at an m.o.i. of 3, and were lysed and analyzed 18 h post infection as in A. The NS proteins were detected by immunoblotting with an antibody against the C-terminal 11-mer peptide of NS2, which in fact reacts with both NS1 and NS2, likely due to their C-terminal homology (F/YDLNP). Proteasomal α2 subunit expression was analyzed as in A. The numbers under the blots in C and D are densitometric intensities of the bands, relative to the “no addition” lane set as 100.
Figure 3
Figure 3
MAVS plays a key role in NSD-mitochondria association. (A) Intracellular (ex vivo) complex of NSD, its substrates and mitochondria. WT or MAVS KO cells were transfected with various NS targets (middle row panels) or non-targets (bottom row panels) together with NS1 and NS2 plasmids when indicated. Cells were then grown in the presence of 50 μM MG132. The top panel shows the relative purity of each subcellular fraction (T = total lysates; Cyt = cytosol; Nuc = nucleus; Mito = mitochondria) using fraction/organelle-specific markers: tubulin for cytosol, nucleolin for nucleus and Cox-1 for mitochondria. The lack of calnexin in the mitochondrial fraction excludes the presence of MAM, peroxisomes and ER and indicates its relative purity. Transfection of NS promotes the appearance of all examined NS targets in the mitochondrial fraction (box with broken line) in WT (MAVS+) cells, not in MAVS KO cells. MAVS expression was detected in the mitochondrial fraction; in contrast, LGP2 and L13a are never found in the mitochondria, regardless of NS overexpression (bottom row). NS proteins (lowest row) were largely detected in the mitochondrial fraction. A small, basal level of IRF3 is found associated with mitochondria in the absence of NS, likely reflecting its natural affinity for mitochondrial Bax. (B) Intracellular (in vitro) complex of NSD, its substrates and mitochondria. Mitochondria purified from WT and MAVS KO MEFs were employed in reconstituted NSD reactions as described in Figure 2B in the presence of 20 μM MG132. Following incubation for 10 min at 32 °C, the mitochondria were pelleted by centrifugation at 10 000× g for 10 min at 4 °C, and the pellets were analyzed by SDS-PAGE immunoblotting. Only the complete reactions (lane 1) containing all three components (NSD, mitochondria and substrate) allowed the association of substrates with mitochondria. STAT1, a non-substrate, did not associate. Cox-1 served as the mitochondrial marker.
Figure 4
Figure 4
MAVS is required for optimal IFN suppression by NS protein. IFN induction and IFN response were quantified by the appropriate Luc reporter assays, and RSV growth was measured by plaque assay in Hep-2 cells as previously described,. NS1 and NS2 plasmids have also been described before, and V is the empty vector control. WT and MAVS KO MEFs were infected with NS1/2-deleted RSV. Where indicated, NS1 and/or NS2 proteins were overexpressed. (A) IFN induction. IFN gene activation was evaluated by the luciferase assays using constructs containing IFNβ gene promoter. (B) IFN response. The ability of NS1/2 to suppress the host cell response to recombinant IFNα was tested by using the ISGF54-Luc reporter assays, and suppression was considerably reduced in MAVS KO cells. (C) RSV growth. Monolayers of WT and MAVS KO MEFs were infected at 1 m.o.i. in the presence of increasing amounts of recombinant IFNα as shown, and infectious progeny virus, liberated after 24 h, was plaque assayed by serial dilution.
Figure 5
Figure 5
NS function and mitochondrial NSD assembly in cells with degraded MAM-MAVS. HCV NS3/4A-expressing cells were grown as described in Materials and Methods, and the expression of NS3/4A, which leads to MAM-MAVS cleavage, was induced by replacing Dox-containing media with Dox-free media. Induction of NS3/4A expression was confirmed by immunoblotting (data not shown). (A) Immunoblotting analysis of cell fractions was carried out as in Figure 3. The full-length (70 kD) and cleaved bands of MAVS are indicated by FL and C, respectively. (B) Cells in 12-well plates were transfected with 20 μg of poly(I:C) per well, and 10 h later, the total cell extracts were immunoblotted for p56 using specific antibody. Actin served as a loading control. (C) IFN-activated reporter assay was performed in cells with or without NS3/4 expression. (D) In vitro degradative activity of NSD towards STAT2, with or without supplementation of mitochondria or MAM (purified as in A), was tested as in Figure 2B.
Figure 6
Figure 6
Lack of a requirement of mitochondrial ATP synthesis in NSD function. (A) Images of both C4T and its NADH oxidase-restored isogenic cell lines stained with mitotracker are shown, and (B) average mitochondrial length was measured. (C) These cell lines were transfected with FLAG-STAT2 or FLAG-RIG-I plasmids together with increasing amounts of NS1 and NS2 plasmids (0.2, 0.4, 0.6 μg of each per well in a 24-well plate; or with 0.8 μg of no-NS vector) as indicated. Cell lysates were subjected to immunoblotting. Actin served as loading control. The STAT2 and RIG-I bands were densitometrically scanned, normalized against the actin band intensity and the resultant numbers are shown relative to the vector-only (no NS) band.
Figure 7
Figure 7
Higher cell confluency correlates with better NSD function. An estimated volume of A549 cell suspension was seeded to achieve roughly 60% confluency upon seeding, and decreased percentages of this amount (e.g., 80%, 70% etc as shown) were seeded in other wells. Next morning, when the first well reached full confluency, the confluency of the other wells was confirmed by microscopy. (A) NSD function assay. Once a series of cell confluency was achieved, all wells were transfected with FLAG-STAT2 and FLAG-NS2 plasmids; 24 h later, cell lysates were harvested and analyzed by immunoblotting as in Figure 1. Intensities of the band of remaining STAT2 were quantified and shown as percentage of the no-NS lane for each confluency. ND = band intensity was too faint to be determined. (B, C) Mitochondrial length. Mitochondria in live cells at different confluency were stained with Mitotracker and their average length was measured.
Figure 8
Figure 8
Shortening of mitochondria by Mfn knockdown facilitates NSD activity. (A) Mfn knockdown efficiency. Mfn1 and Mfn2 expression was silenced by using ON-TARGETplus siRNAs as shown by immunoblotting using an antibody recognizing both Mfn1 and Mfn2. (B) Mitochondrial length measurement. Lengths of stained mitochondria in live cells were determined in cells at the indicated confluency. (C) NSD function assay. Degradative activity of transfected NS1/NS2 towards STAT2 was assayed in normal and Mfn-deficient cells, and the remaining STAT2 levels were determined as described in Figure 7A. (D) In vitro demonstration of higher efficiency of shorter mitochondria in facilitating NSD activity. Mitochondria were purified from the following A549 cells: 98% - 100% confluency (●); 55% confluency (Δ); Mfn1/2 knockdown in 55% confluent monolayer (▴). Varying amounts of these mitochondria were employed in NSD reactions with fixed amounts of immune-purified FLAG-STAT2 and NSD, as described in Figure 2B, but the reaction was incubated for 15 min only. In reactions with lower amounts of mitochondria, the total volume was made up with the mitochondria storage buffer. As before, mitochondria alone (□) had little or no degradative activity.
Figure 9
Figure 9
Motile mitochondria facilitate NSD function. (A) Inhibition of mitochondrial movement by nocodazole treatment. Live imaging of mitotracker-stained mitochondria in the A549 cells was performed starting from 4 h after the addition of nocodazole (20 μM) or control solvent. Three frames at 10 s intervals are shown. (B) Quantification of mitochondrial movement. The movement was measured and the representative data from 15 mitochondrial spots are plotted. (C) NSD functional assay. This was performed in A549 cells transfected with the indicated plasmids. Nocodazole (20 μM) was added 5 h after plasmid transfection and the same medium was maintained until the cells were harvested for immunoblotting 20 h later. There was no obvious cytopathy in the treated cells. The intensities of STAT2 and RIG-I protein bands were normalized against those of actin and expressed relative to the vector-only (no NS) band.
Figure 10
Figure 10
A working model for mitochondria-assembled NSD. The core NSD, as purified by gel filtration, is shown on left (green), in which the subunits may be only loosely attached. NSD is stabilized by recruitment to MAVS on motile mitochondria, perhaps allowing recruitment of other host factors, such as chaperones and ubiquitination pathway proteins. Both NS proteins may have the capability to interact with MAVS, if in proper spatial juxtaposition. We propose that mitochondrial motility allows rapid scavenging in the cytosol to collect and assemble all the subunits of the complex, and that mitochondrial fission provides a larger mitochondrial surface area, allowing more efficient use of a greater number of MAVS and other membrane structures if needed, free of space constraints.

Similar articles

Cited by

References

    1. Kawai T, Takahashi K, Sato S, et al. IPS-1, an adaptor triggering RIG-I- and Mda5-mediated type I interferon induction. Nat Immunol. 2005;6:981–988. - PubMed
    1. Meylan E, Curran J, Hofmann K, et al. Cardif is an adaptor protein in the RIG-I antiviral pathway and is targeted by hepatitis C virus. Nature. 2005;437:1167–1172. - PubMed
    1. Seth RB, Sun L, Ea CK, Chen ZJ. Identification and characterization of MAVS, a mitochondrial antiviral signaling protein that activates NF-kappaB and IRF3. Cell. 2005;122:669–682. - PubMed
    1. Xu LG, Wang YY, Han KJ, et al. VISA is an adapter protein required for virus-triggered IFN-beta signaling. Mol Cell. 2005;19:727–740. - PubMed
    1. Belgnaoui SM, Paz S, Hiscott J. Orchestrating the interferon antiviral response through the mitochondrial antiviral signaling (MAVS) adapter. Curr Opin Immunol. 2011;23:564–572. - PubMed

Publication types

MeSH terms

LinkOut - more resources