

In vivo photoacoustic lifetime imaging of tumor hypoxia in small animals
- PMID: 23877772
- PMCID: PMC3717163
- DOI: 10.1117/1.JBO.18.7.076019
In vivo photoacoustic lifetime imaging of tumor hypoxia in small animals
Abstract
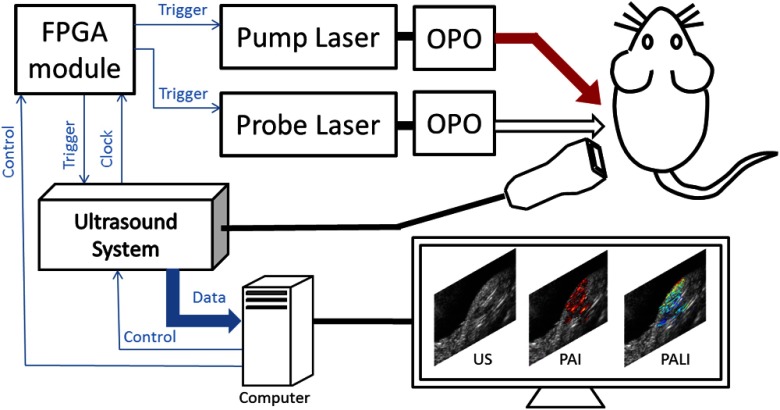
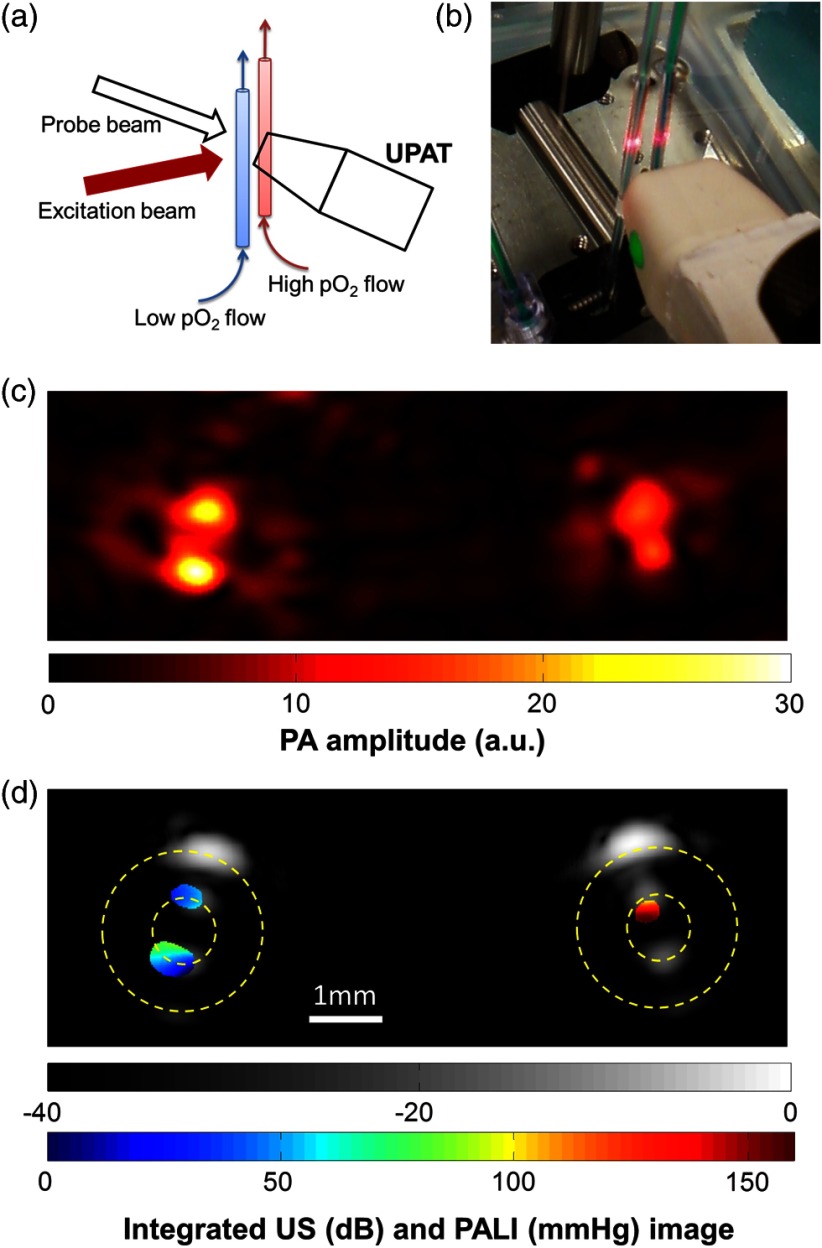
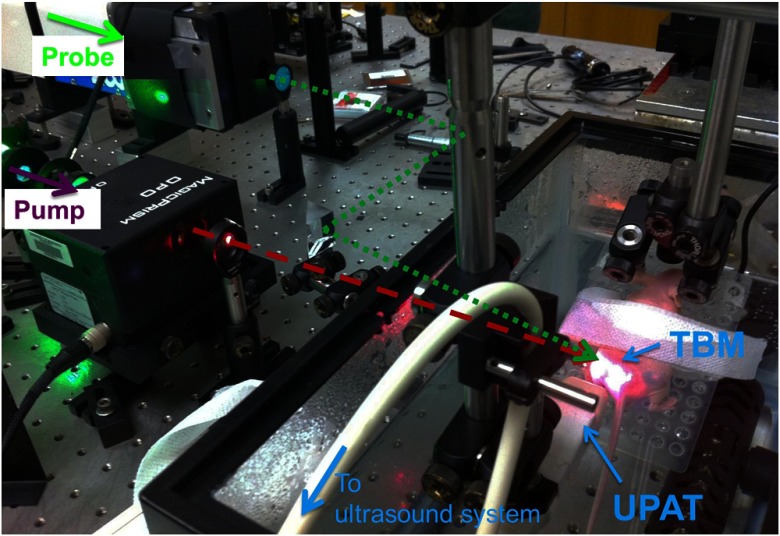
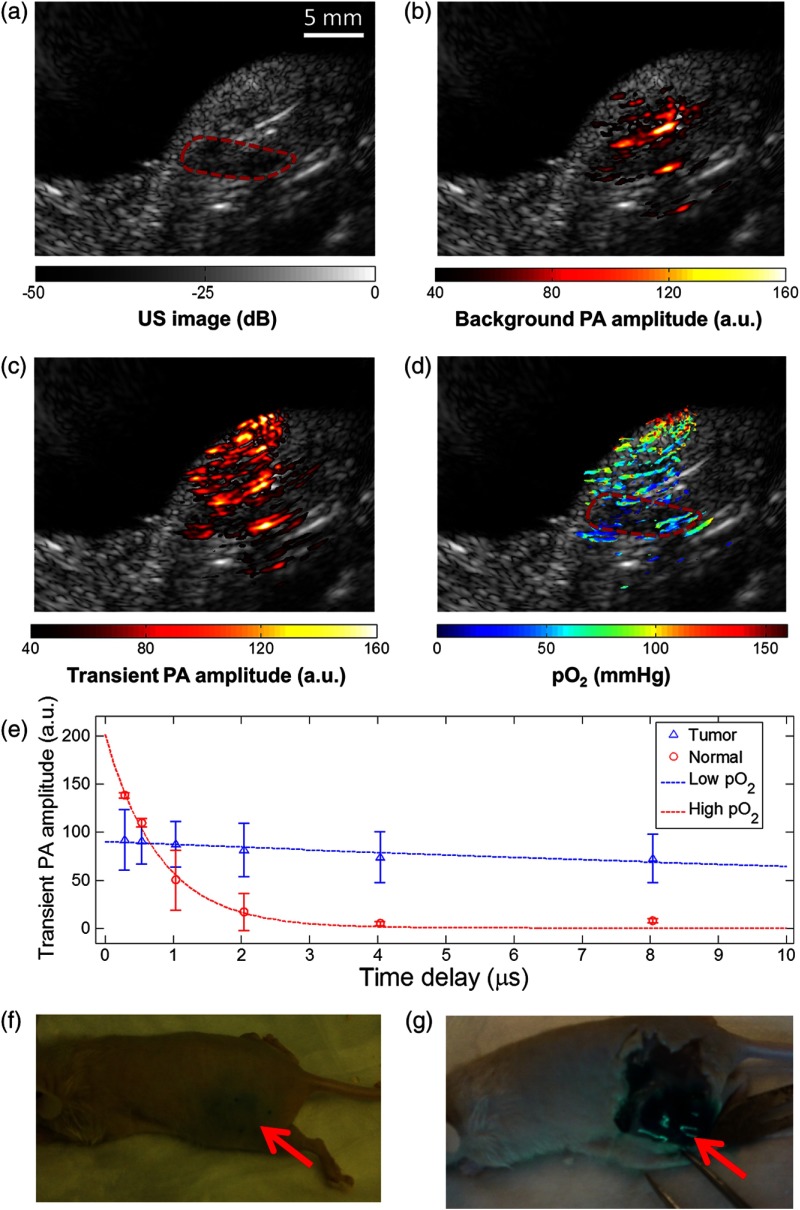
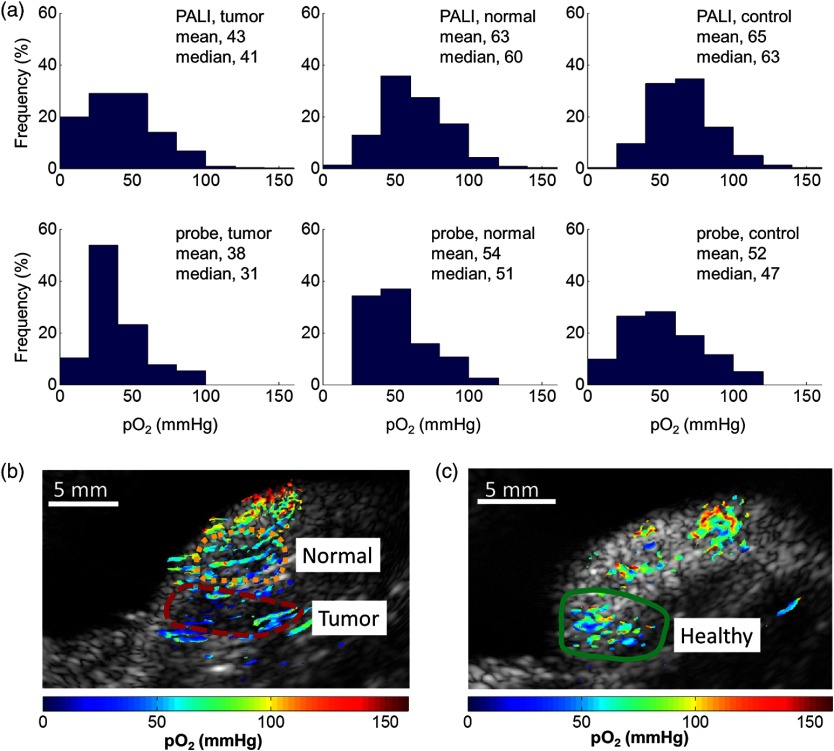
Tumor hypoxia is an important factor in assessment of both cancer progression and cancer treatment efficacy. This has driven a substantial effort toward development of imaging modalities that can directly measure oxygen distribution and therefore hypoxia in tissue. Although several approaches to measure hypoxia exist, direct measurement of tissue oxygen through an imaging approach is still an unmet need. To address this, we present a new approach based on in vivo application of photoacoustic lifetime imaging (PALI) to map the distribution of oxygen partial pressure (pO2) in tissue. This method utilizes methylene blue, a dye widely used in clinical applications, as an oxygen-sensitive imaging agent. PALI measurement of oxygen relies upon pO2-dependent excitation lifetime of the dye. A multimodal imaging system was designed and built to achieve ultrasound (US), photoacoustic, and PALI imaging within the same system. Nude mice bearing LNCaP xenograft hindlimb tumors were used as the target tissue. Hypoxic regions were identified within the tumor in a combined US/PALI image. Finally, the statistical distributions of pO2 in tumor, normal, and control tissues were compared with measurements by a needle-mounted oxygen probe. A statistically significant drop in mean pO2 was consistently detected by both methods in tumors.
Figures
Similar articles
-
Photoacoustic lifetime imaging for direct in vivo tissue oxygen monitoring.J Biomed Opt. 2015 Mar;20(3):036004. doi: 10.1117/1.JBO.20.3.036004. J Biomed Opt. 2015. PMID: 25748857 Free PMC article.
-
Photoacoustic Lifetime Imaging of Hypoxia.Methods Mol Biol. 2024;2755:141-147. doi: 10.1007/978-1-0716-3633-6_10. Methods Mol Biol. 2024. PMID: 38319575
-
Development of a mathematical model to estimate intra-tumor oxygen concentrations through multi-parametric imaging.Biomed Eng Online. 2016 Oct 12;15(1):114. doi: 10.1186/s12938-016-0235-5. Biomed Eng Online. 2016. PMID: 27733170 Free PMC article.
-
Photoacoustic imaging for investigating tumor hypoxia: a strategic assessment.Theranostics. 2023 May 29;13(10):3346-3367. doi: 10.7150/thno.84253. eCollection 2023. Theranostics. 2023. PMID: 37351178 Free PMC article. Review.
-
Molecular Photoacoustic Contrast Agents: Design Principles & Applications.Photochem Photobiol. 2018 Nov;94(6):1175-1209. doi: 10.1111/php.12967. Epub 2018 Aug 20. Photochem Photobiol. 2018. PMID: 29953628 Free PMC article. Review.
Cited by
-
Photoacoustic lifetime imaging for direct in vivo tissue oxygen monitoring.J Biomed Opt. 2015 Mar;20(3):036004. doi: 10.1117/1.JBO.20.3.036004. J Biomed Opt. 2015. PMID: 25748857 Free PMC article.
-
Intermittent hypoxia-induced changes in tumor-associated macrophages and tumor malignancy in a mouse model of sleep apnea.Am J Respir Crit Care Med. 2014 Mar 1;189(5):593-601. doi: 10.1164/rccm.201310-1830OC. Am J Respir Crit Care Med. 2014. PMID: 24471484 Free PMC article.
-
Photoacoustic tomography of blood oxygenation: A mini review.Photoacoustics. 2018 May 31;10:65-73. doi: 10.1016/j.pacs.2018.05.001. eCollection 2018 Jun. Photoacoustics. 2018. PMID: 29988848 Free PMC article. Review.
-
Optimizing photoacoustic image reconstruction using cross-platform parallel computation.Vis Comput Ind Biomed Art. 2018 Sep 5;1(1):2. doi: 10.1186/s42492-018-0002-5. eCollection 2018 Dec. Vis Comput Ind Biomed Art. 2018. PMID: 32226922 Free PMC article.
-
Acoustic and photoacoustic molecular imaging of cancer.J Nucl Med. 2013 Nov;54(11):1851-4. doi: 10.2967/jnumed.112.115568. J Nucl Med. 2013. PMID: 24187042 Free PMC article. Review.
References
Publication types
MeSH terms
Substances
Grants and funding
LinkOut - more resources
Full Text Sources
Other Literature Sources
