Review
. 2013 Nov;99(11):846-59.
doi: 10.1002/bip.22361.

ATP-driven molecular chaperone machines

Affiliations
Review

ATP-driven molecular chaperone machines

Daniel K Clare et al. Biopolymers. 2013 Nov.

Abstract

This review is focused on the mechanisms by which ATP binding and hydrolysis drive chaperone machines assisting protein folding and unfolding. A survey of the key, general chaperone systems Hsp70 and Hsp90, and the unfoldase Hsp100 is followed by a focus on the Hsp60 chaperonin machine which is understood in most detail. Cryo-electron microscopy analysis of the E. coli Hsp60 GroEL reveals intermediate conformations in the ATPase cycle and in substrate folding. These structures suggest a mechanism by which GroEL can forcefully unfold and then encapsulate substrates for subsequent folding in isolation from all other binding surfaces.

Keywords: ATP driven; Cryo-EM; GroEL; chaperones; machines.


Figures

FIGURE 1
FIGURE 1
The Hsp70/Hsp40 chaperones. Structures of Hsp70 in the open, domain docked (a) and closed (b) conformations (PDB ID: 4B9Q and 2KHO). The nucleotide binding domains are shown in red (nucleotide is shown in gray), the substrate binding domains in blue and the C-terminal lid in cyan. (c) Structure of the C-terminal dimer of the peptide binding fragment of Hsp40 (blue) with three copies of the MEEVD peptide of Hsp70 bound to it (magenta) (PDB ID: 3AGY). Structure of the J-domain of Hsp40 (red) (PDB ID: 2O37). The black-dotted line shown in c and d indicates the connectivity of Hsp40 domains. All figures have been made with UCSF Chimera.
FIGURE 2
FIGURE 2
Conformations of Hsp90. The open (a), partially closed (b), and closed (c) conformations of the Hsp90 dimer (PDB ID: 2IOQ, 2O1U, and 2CG9). The N-terminal domains are shown in red, the middle domains in cyan and the C-terminal domains are shown in blue. Bound nucleotides are in gray.
FIGURE 3
FIGURE 3
The Hsp100 chaperones. Monomer structures of ClpA (a), ClpB (b), and the HslUV chaperone protease complex (c) (PDB ID: 1KSF, 1QVR, and 1KYI). The nucleotide binding domains of ClpA and ClpB are shown in blue and cyan with the N-terminal domains shown in red, and bound nucleotides in gray. The coil-coiled insertion of ClpB, important for its disaggregation function, is shown in magenta. The chaperone HslU is shown in orange with the central ring protease HslV shown in green. The cryo-EM reconstructions of Hsp104-ATP and ClpB-ATP are shown in (d) and (e) (EM Databank ID: EMD-1600 and EMD-1244). The two AAA+ domains are labeled in both reconstructions but the N-terminal domain is only visible in the Hsp104 map.
FIGURE 4
FIGURE 4
Structures of apo-GroEL and GroEL–GroES–ADP.AlF3. Side (a,d) and top views (b,e) of unliganded GroEL and GroEL–GroES–ADP.AlF3 complexes (PDB ID: 1OEL and 1SVT). Asymmetric units are shown in rainbow colors. Single subunits, viewed from inside the folding chamber, with helices H (red), I (orange), M (green), and D (magenta) for GroEL (c) and GroEL–GroES–ADP.AlF3 (f). Nucleotide is in gray. Helix D has been suggested to transmit the nucleotide binding state of one ring to the opposite ring. Helices H and I bind the GroES mobile loop and unfolded substrate proteins. Helix M contains D398, which is important for ATP hydrolysis.
FIGURE 5
FIGURE 5
ATP induced conformational changes in GroEL. Two subunits, viewed from inside the folding chamber, of apo-GroEL, GroEL–Rs1, GroEL–Rs2, GroEL–Rs-open, and GroEL–GroES–ADP.AlF3 complexes (EM Databank and PDB ID: EMD-1997/1OEL, EMD-1998/4AAQ, EMD-1999/4AAR, EMD-2000/4AAS, and 1SVT. Helices H (red), I (orange), and M (green) are highlighted as well as the residues involved in the intersubunit salt bridges (red and blue space fill).
FIGURE 6
FIGURE 6
Structural basis for the priming of GroEL for GroES release. Slice through the centre of GroEL–GroES–ATP and ADP complexes with the intersubunit β-sheet shown in green and red for the equatorial domains in the trans ring (ring opposite GroES) (EM Databank and PDB ID: EMD-1180/2C7C and EMD-1181/2C7D). Black double-headed arrows at the equatorial domain of GroEL–GroES–ADP highlight the intersubunit β-sheet expansion.
FIGURE 7
FIGURE 7
Structures of GroEL complexes with non-native MDH and gp23. Cryo-EM maps and fits for GroEL–MDH (left-hand two columns) and GroEL–gp23 (right-hand two columns) shown from the top, side, and bottom (EM Databank ID for GroEL–gp23 complexes: EMD-1544 and EMD-1545). GroEL density is shown as a white transparent surface with the substrate density shown as cyan. Helices H and I are shown as red and orange with the rest of the coordinates shown in blue. Two structures of GroEL–MDH are shown, from an ensemble of five structures that were determined by classification of a heterogeneous data set. The same approach was used for the GroEL–gp23 complexes.
FIGURE 8
FIGURE 8
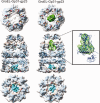
Structures of GroEL–gp31-ADP.ALF3 complexes with folding gp23. Cryo-EM maps and fits of the GroEL–Gp31–ADP.ALF3 complex with substrate protein gp23 bound in the open trans ring (left-hand column; EMD-1547) and in the folding chamber and open trans ring (right-hand column; EMD-1548). The GroEL–gp31 cryo-EM densities are shown as white transparent surfaces. gp23 densities in the open trans ring are shown in cyan and the gp23 in the folding chamber in green. Atomic coordinates are colored as in Figure 7. The inset on the right shows the gp23 density with the coordinates of the closely related capsid protein gp24 (blue) (PDB ID: 1YUE) placed in the density. The gp23 density in the trans ring occupies a similar position to that seen in the GroEL–gp23 complexes.
FIGURE 9
FIGURE 9
Multiple conformations of a Group 2 chaperonin. Cryo-EM maps of the Group 2 chaperonin from Methanococcus maripaludis in the open (top row), partially closed (middle row) and closed conformation shown in side view, cut away side view and top view (EM Databank and PDB ID: EMD-1396, EMD-1397, and EMD-1398/1A6D). The cryo-EM densities are shown as a white transparent surface with the Group 2 equivalents of helices H, I, and M from Group 1 shown in red, orange, and green, respectively. The final column shows two adjacent subunits, viewed from inside the folding chamber, for each of the conformations.

Similar articles

Cited by

References

    1. Hartl FU, Hayer-Hartl M. Science. 2002;295:1852–1858. - PubMed
    1. Fenton WA, Horwich AL. Q Rev Biophys. 2003;36:229–256. - PubMed
    1. Bukau B, Weissman J, Horwich AL. Cell. 2006;125:443–451. - PubMed
    1. Hartl FU, Hayer-Hartl M. Nat Struct Mol Biol. 2009;16:574–581. - PubMed
    1. Hartl FU, Bracher A, Hayer-Hartl M. Nature. 2011;475:324–332. - PubMed

MeSH terms

LinkOut - more resources