

Dynamic contrast enhanced MRI parameters and tumor cellularity in a rat model of cerebral glioma at 7 T
- PMID: 23878070
- PMCID: PMC3870046
- DOI: 10.1002/mrm.24873
Dynamic contrast enhanced MRI parameters and tumor cellularity in a rat model of cerebral glioma at 7 T
Abstract
Purpose: To test the hypothesis that a noninvasive dynamic contrast enhanced MRI (DCE-MRI) derived interstitial volume fraction (ve ) and/or distribution volume (VD ) were correlated with tumor cellularity in cerebral tumor.
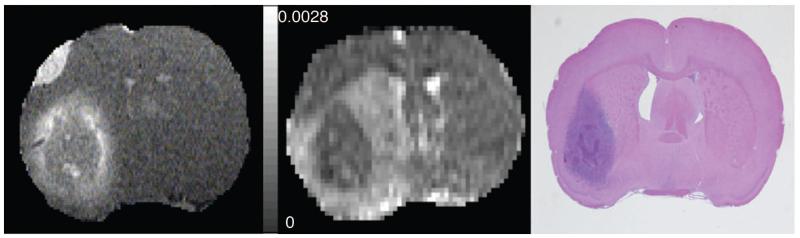
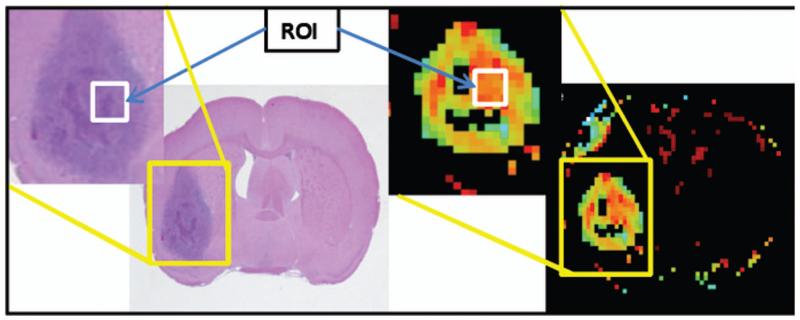
Methods: T1 -weighted DCE-MRI studies were performed in 18 athymic rats implanted with U251 xenografts. After DCE-MRI, sectioned brain tissues were stained with Hematoxylin and Eosin for cell counting. Using a Standard Model analysis and Logan graphical plot, DCE-MRI image sets during and after the injection of a gadolinium contrast agent were used to estimate the parameters plasma volume (vp ), forward transfer constant (K(trans) ), ve , and VD .
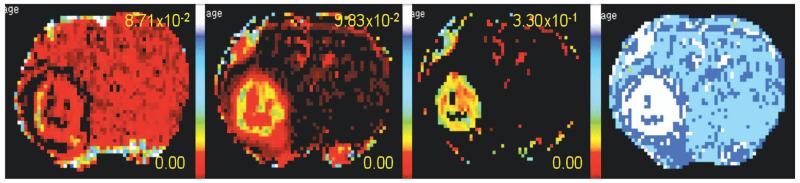
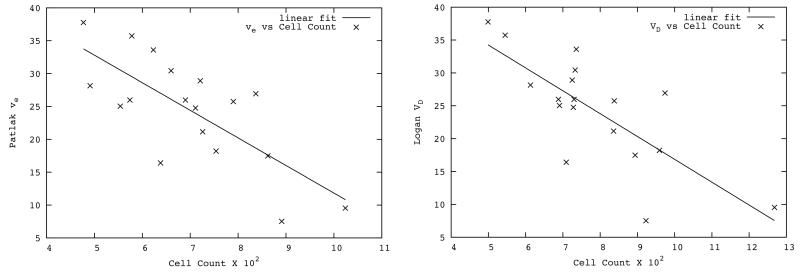
Results: Parameter values in regions where the standard model was selected as the best model were: (mean ± S.D.): vp = (0.81 ± 0.40)%, K(trans) = (2.09 ± 0.65) × 10(-2) min(-1) , ve = (6.65 ± 1.86)%, and VD = (7.21 ± 1.98)%. The Logan-estimated VD was strongly correlated with the standard model's vp + ve (r = 0.91, P < 0.001). The parameters, ve and/or VD , were significantly correlated with tumor cellularity (r ≥ -0.75, P < 0.001 for both).
Conclusion: These data suggest that tumor cellularity can be estimated noninvasively by DCE-MRI, thus supporting its utility in assessing tumor pathophysiology.
Keywords: DCE-MRI; Logan plot; distribution volume; dual-echo gradient-echo sequence; interstitial volume; longitudinal relaxation rate; tumor cellularity.
Copyright © 2013 Wiley Periodicals, Inc.
Figures

References
-
- Hylton N. Dynamic contrast-enhanced magnetic resonance imaging as an imaging biomarker. J Clin Oncol. 2006;24(20):3293–3298. - PubMed
-
- Patlak CS, Blasberg RG, Fenstermacher JD. Graphical evaluation of blood-to-brain transfer constants from multiple-time uptake data. Journal of Cerebral Blood Flow and Metabolism. 1983;3:1–7. - PubMed
-
- Patlak C, Blasberg R. Graphical Evaluation of blood to brain transfer constants from multiple time up take data. Generalizations. Journal of Cerebral Blood Flow and Metabolism. 1985;5:584–590. - PubMed
-
- Tofts PS, Brix G, Buckley DL, Evelhoch JL, Henderson E, Knopp MV, Larsson HB, Lee TY, Mayr NA, Parker GJ, Port RE, Taylor J, Weisskoff RM. Estimating kinetic parameters from dynamic contrast-enhanced T(1)-weighted MRI of a diffusable tracer: standardized quantities and symbols. J Magn Reson Imaging. 1999;10(3):223–232. - PubMed
-
- Ewing JR, Brown SL, Lu M, Panda S, Ding G, Knight RA, Cao Y, Jiang Q, Nagaraja TN, Churchman JL, Fenstermacher JD. Model selection in magnetic resonance imaging measurements of vascular permeability: Gadomer in a 9L model of rat cerebral tumor. J Cereb Blood Flow Metab. 2006;26(3):310–320. - PubMed
Publication types
MeSH terms
Substances
Grants and funding
LinkOut - more resources
Full Text Sources
Other Literature Sources
Medical
Miscellaneous
