. 2013 Nov;23(11):1951-60.
doi: 10.1101/gr.155994.113. Epub 2013 Jul 22.

Honey bee protein atlas at organ-level resolution

Affiliations

Honey bee protein atlas at organ-level resolution

Queenie W T Chan et al. Genome Res. 2013 Nov.

Abstract

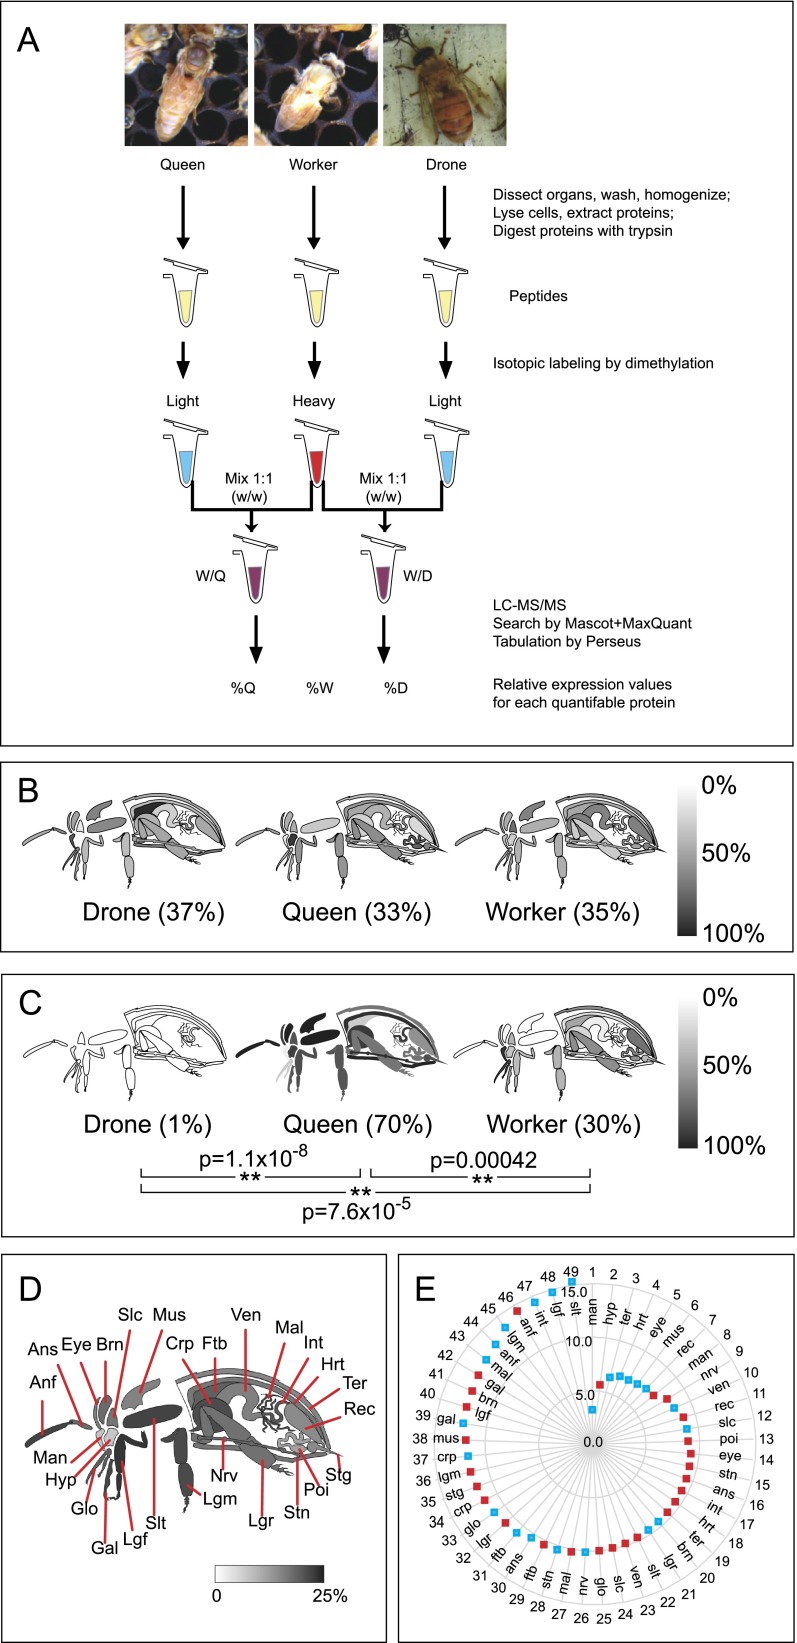
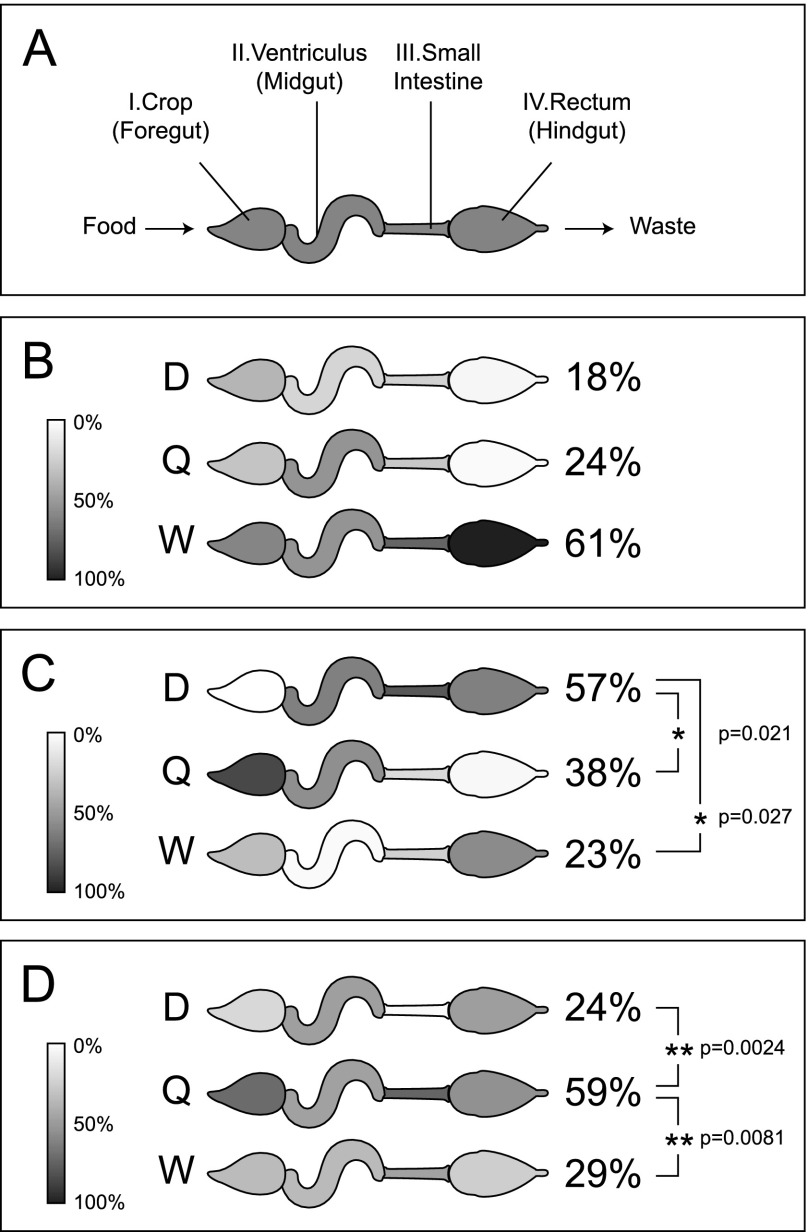
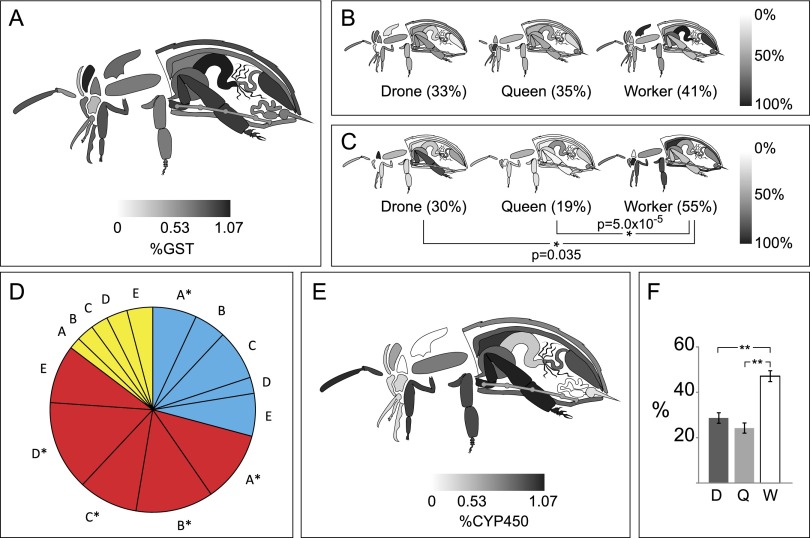
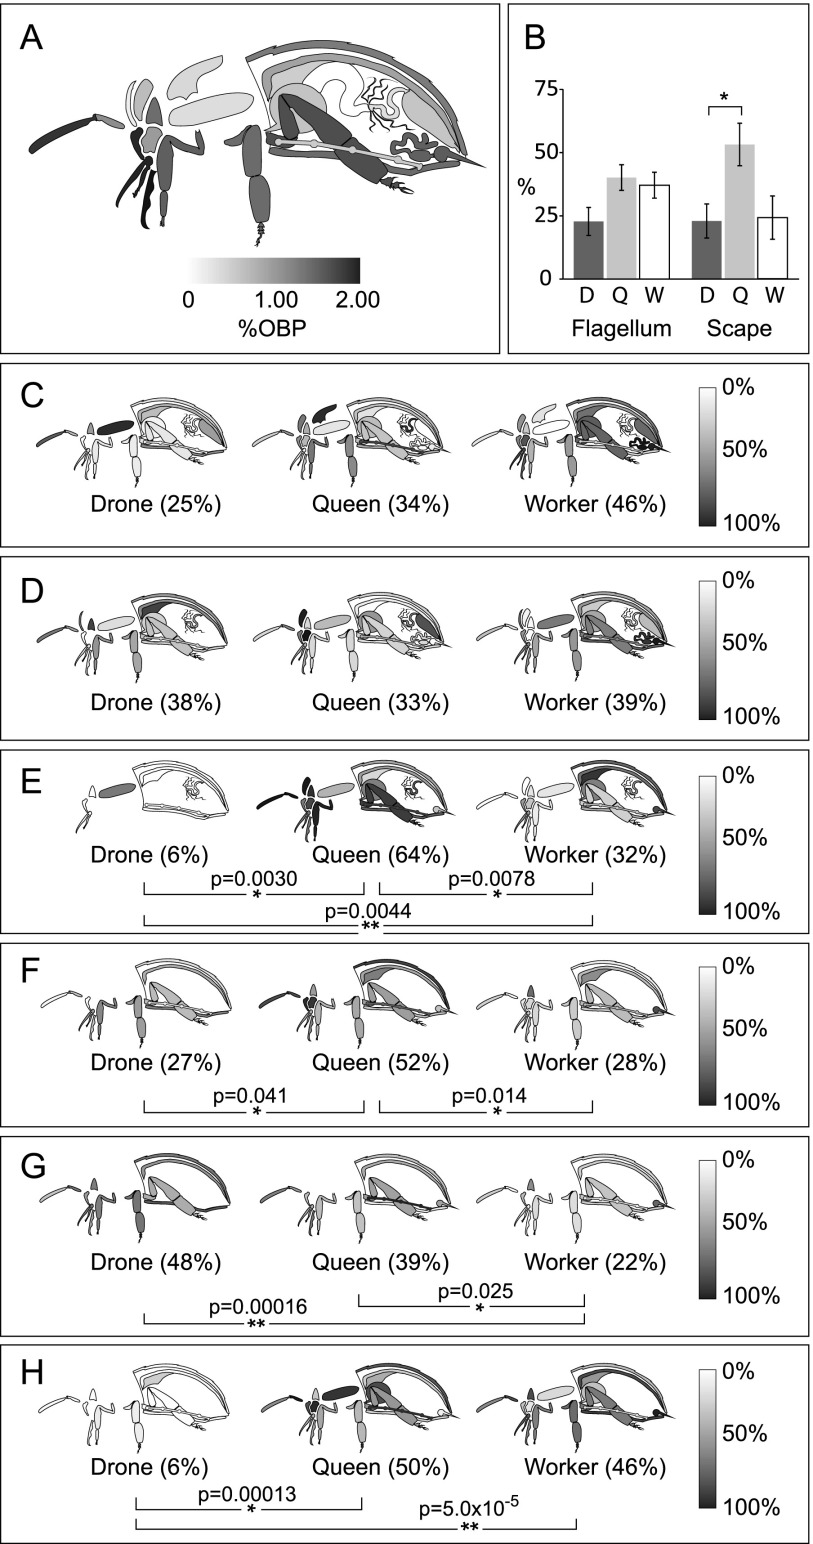
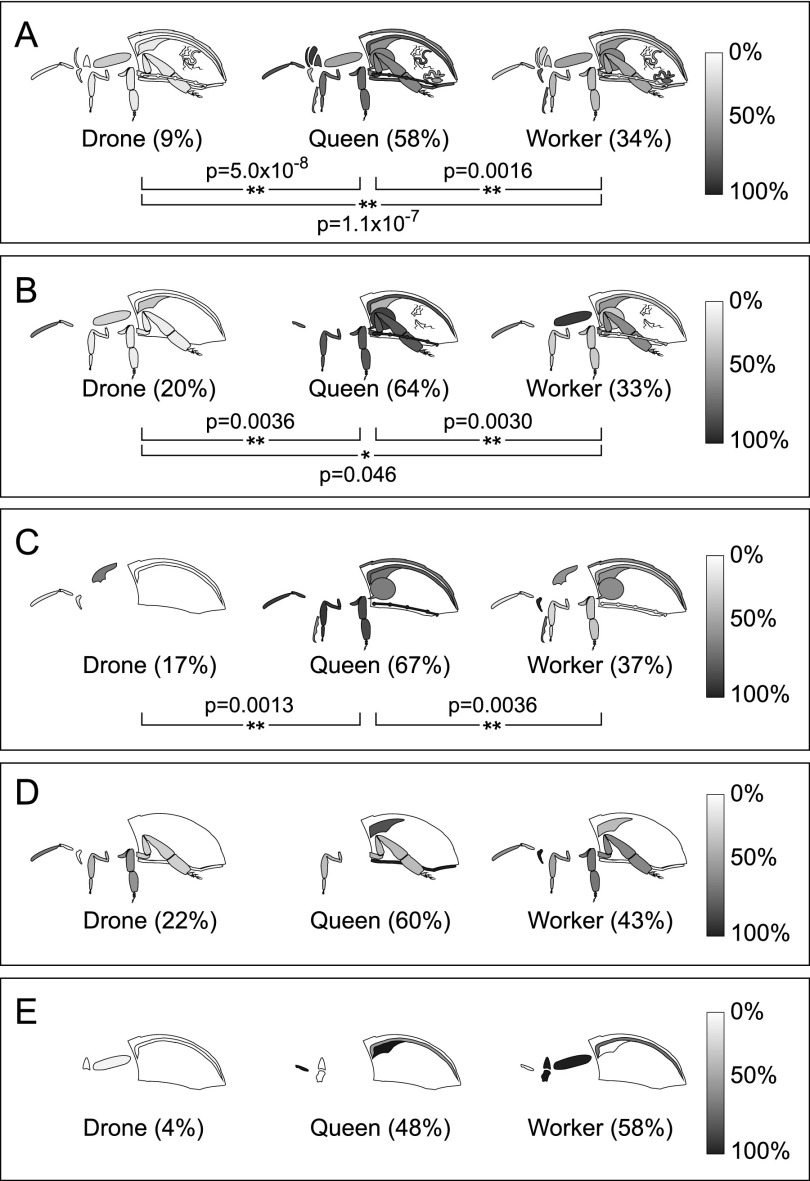
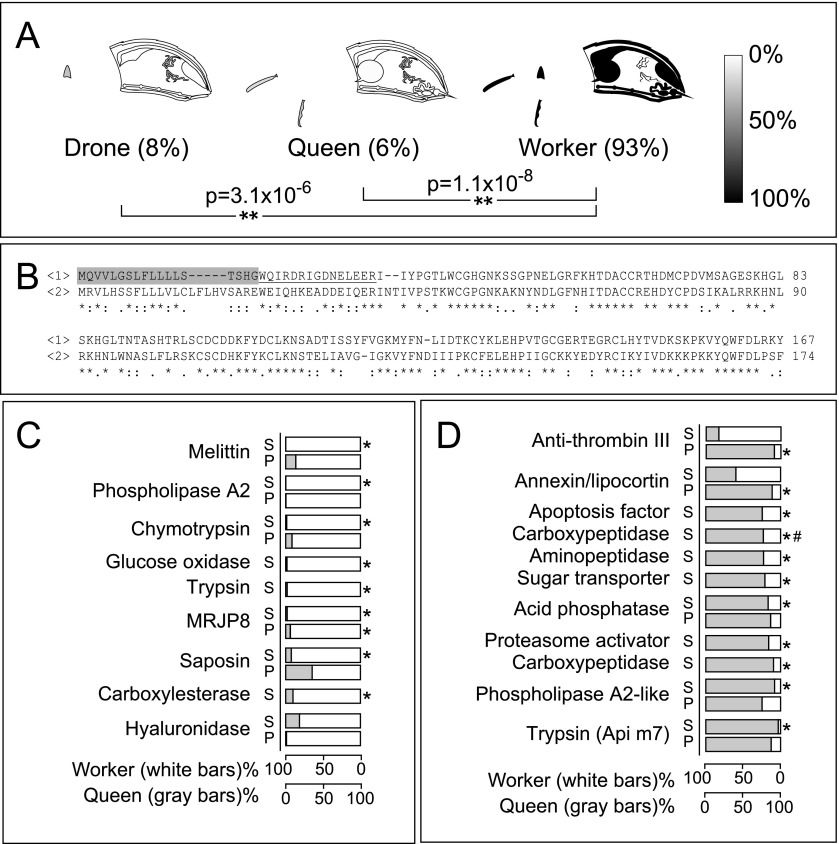
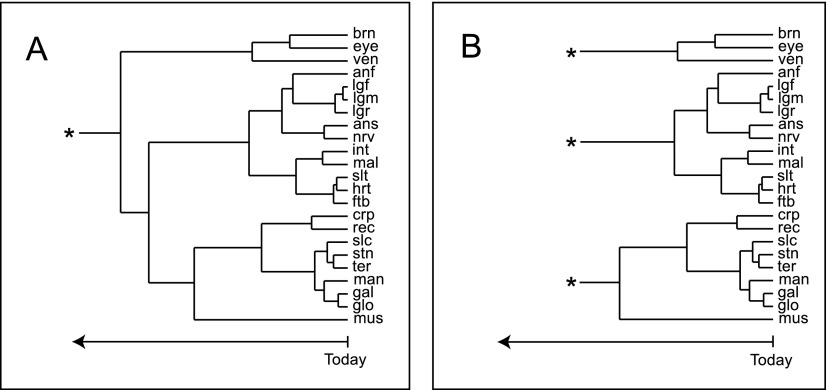
Genome sequencing has provided us with gene lists but cannot tell us where and how their encoded products work together to support life. Complex organisms rely on differential expression of subsets of genes/proteins in organs and tissues, and, in concert, evolved to their present state as they function together to improve an organism's overall reproductive fitness. Proteomics studies of individual organs help us understand their basic functions, but this reductionist approach misses the larger context of the whole organism. This problem could be circumvented if all the organs in an organism were comprehensively studied by the same methodology and analyzed together. Using honey bees (Apis mellifera L.) as a model system, we report here an initial whole proteome of a complex organism, measuring 29 different organ/tissue types among the three honey bee castes: queen, drone, and worker. The data reveal that, e.g., workers have a heightened capacity to deal with environmental toxins and queens have a far more robust pheromone detection system than their nestmates. The data also suggest that workers altruistically sacrifice not only their own reproductive capacity but also their immune potential in favor of their queen. Finally, organ-level resolution of protein expression offers a systematic insight into how organs may have developed.


Figures

Figure 1.
Figure 1.
An overview of the Honey Bee Protein Atlas. (A) Sample handling flowchart. Worker proteins from each organ served as a reference against which queen and drone organs were compared. The relative abundance of actin (B) and vitellogenin (C) in the organs of each caste are shown on a grayscale. The absence of an organ indicates that either the organ does not exist (e.g., stinger in drones) or the protein was not detected there. Whole-body averages are shown in parentheses; (**) P < 0.01. (D) A diagrammatic representation of each tissue, and the percentage of quantified proteins in queens and/or drones whose expression level is significantly different from the worker at P < 0.05. Individual percentage differences in queen–worker (red squares) and drone–worker (blue squares) comparisons for the tissues are shown as a radar graph (0% at the origin up to 15%) in E, arranged from the least different (wheel position 1) to most different (wheel position 49) tissue. (anf) flagellum (antenna); (ans) scape (antenna); (brn) brain; (crp) crop (forgut); (ftb) fat body; (gal) galea (mouthpart); (glo) glossa (mouthpart); (hrt) heart; (hyp) hypopharngeal gland (queen and worker only); (int) intestine; (lgf) front leg; (lgm) middle leg; (lgr) rear leg; (mal) Malpighian tubules; (man) mandibular gland; (mus) thorax muscle; (nrv) nerve; (poi) poison sac (queen and worker only); (rec) rectum; (slc) post-cerebral salivary gland; (slt) thoracic salivary gland; (stg) sting (queen and worker only); (stn) sternite; (ter) tergite; (ven) ventriculus (midgut).
Figure 2.
Figure 2.
Caste-dependent differences in major digestive system enzymes. (A) The abdominal sections of the digestive tract. Relative expression values of major enzymes for digestion of mono- and polysaccharides (B), proteins (C), and lipid transport (D) are shown on a grayscale. Averages among the four organs are shown in parentheses; (*) P < 0.05, (**) P < 0.01.
Figure 3.
Figure 3.
Caste and organ distribution of detoxification enzymes. (A) GST proteins as a fraction of all quantified proteins across castes. (B) Peroxiredoxin (gi:328787790) and (C) catalase expression levels. Whole-body averages are shown in parentheses; (*) P < 0.05, (**) P < 0.01. (D) In the Malpighian tubules, MDRPs were collectively highly expressed in queens (red) compared with drones (blue) and workers (yellow). The size of each slice is determined by the relative proportion of a given protein in each caste; (*) P < 0.05 compared with the worker. A (gi:328789595), B (gi:328787148), C (gi:328784175), D (gi:328791429), E (gi:328777607). (E) P450 proteins as a fraction of all proteins across castes, and (F) among the P450s, a caste breakdown of their average P450 expression (±SEM, n = 85).
Figure 4.
Figure 4.
Caste and organ distribution of OBPs. (A) OBPs as a fraction of all quantified proteins across castes. (B) The percent expression of all quantified OBPs in each caste, averaged across the flagellum (the long distal portion of the antenna, n = 16) and the scape (the short proximal portion, n = 11) (±SEM). The relative abundance of OBP14 (C), CSP3 (D), OBP3 (E), OBP17 (F), OBP18 (G), and OBP21 (H) in the organs of each caste is shown on a grayscale. Whole-body averages are shown in parentheses; (*) P < 0.05, (**) P < 0.01.
Figure 5.
Figure 5.
Caste and organ distribution of immunity proteins. (A) PPO, (B) PGRP-S3, and (C) GNBP 1-2 expression is significantly higher in queens compared with the other castes. Overall expression levels of the antimicrobial peptides hymenoptaecin (D) and defensin (E) are not different (P > 0.1), except that drones express far less defensin than queens or workers. Relative levels across each organ shown on a grayscale. Whole-body averages are shown in parentheses; (*) P < 0.05, (**) P < 0.01.
Figure 6.
Figure 6.
Proteome of the poison and sting apparatus: select proteins. (A) Relative abundance of phospholipase A2 (gi:58585172) in the organs of each caste is shown on a grayscale, and the whole-body average is shown in parentheses. Worker expression is significantly different from the others; (**) P < 0.01). (B) Multiple sequence alignment of <1> phospholipase A2 and <2> phospholipase A2-like (gi:110758297). The signal peptide (gray) and propeptide (underlined) are as given in Kuchler et al. (1989). Select proteins that tend to be more highly expressed in (C) workers (white bars) and (D) queens (gray bars) in the poison sac (P) and stinger (S) are shown; (*) P < 0.05, (#) the protease also found in the digestive tract.
Figure 7.
Figure 7.
Evidenced-based insight into organ differentiation and specialization within castes. Dendrograms generated from the top 500 most common proteins among the tested tissues propose two models of organogenesis: (A) a common, single ancestral organ, or (B) multiple organogenesis events. The time scale and its linearity are uncertain but likely go back to the appearance of early bilaterans.

References

    1. Chan QW, Foster LJ 2008. Changes in protein expression during honey bee larval development. Genome Biol 9: R156. - PMC - PubMed
    1. Chan QW, Melathopoulos AP, Pernal SF, Foster LJ 2009. The innate immune and systemic response in honey bees to a bacterial pathogen, Paenibacillus larvae. BMC Genomics 10: 387. - PMC - PubMed
    1. Chan QW, Mutti NS, Foster LJ, Kocher SD, Amdam GV, Wolschin F 2011a. The worker honeybee fat body proteome is extensively remodeled preceding a major life-history transition. PLoS ONE 6: e24794. - PMC - PubMed
    1. Chan QW, Parker R, Sun Z, Deutsch EW, Foster LJ 2011b. A honey bee (Apis mellifera L.) PeptideAtlas crossing castes and tissues. BMC Genomics 12: 290. - PMC - PubMed
    1. Cox J, Mann M 2008. MaxQuant enables high peptide identification rates, individualized p.p.b.-range mass accuracies and proteome-wide protein quantification. Nat Biotechnol 26: 1367–1372 - PubMed

Publication types

LinkOut - more resources