Clinical Trial
. 2013 Aug 6;110(32):13073-8.
doi: 10.1073/pnas.1311861110. Epub 2013 Jul 22.

Dietary gluten triggers concomitant activation of CD4+ and CD8+ αβ T cells and γδ T cells in celiac disease

Affiliations
Clinical Trial

Dietary gluten triggers concomitant activation of CD4+ and CD8+ αβ T cells and γδ T cells in celiac disease

Arnold Han et al. Proc Natl Acad Sci U S A. .

Abstract

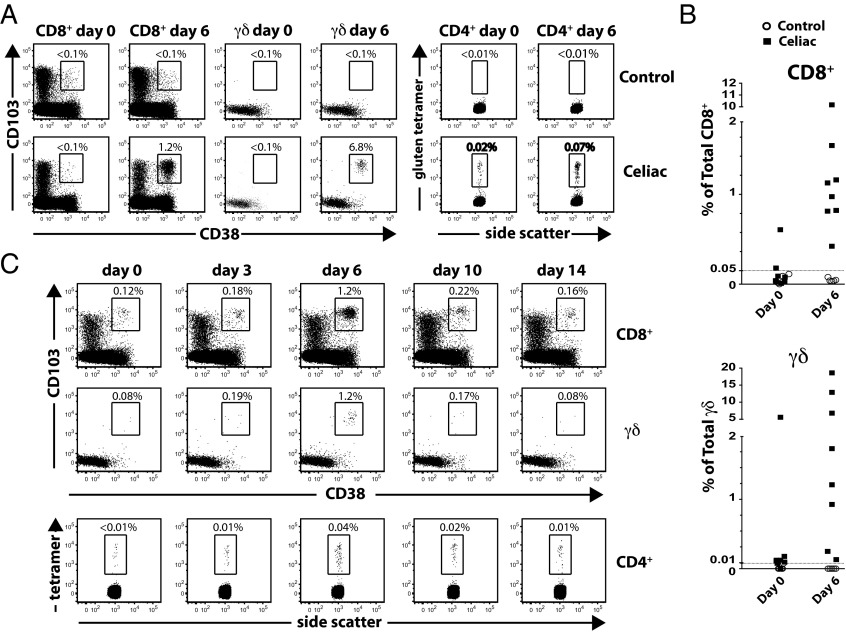
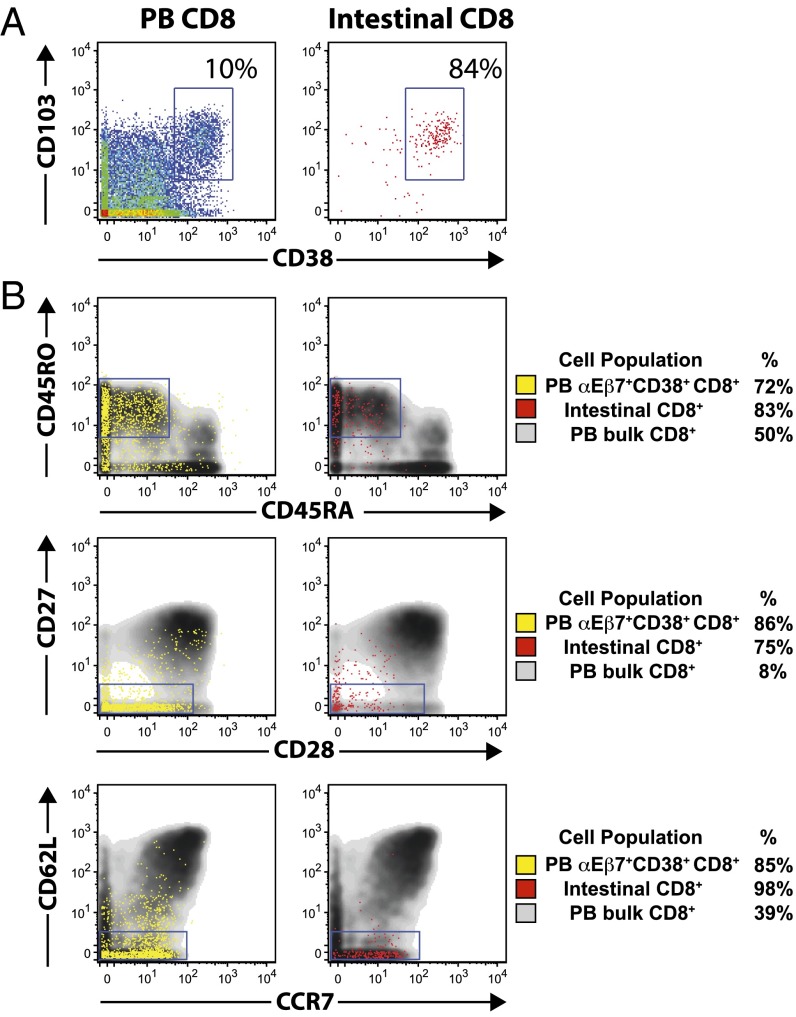
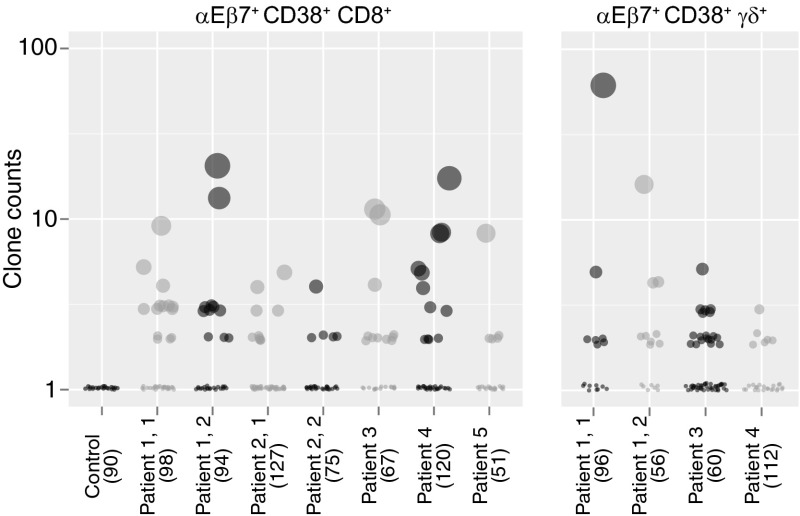
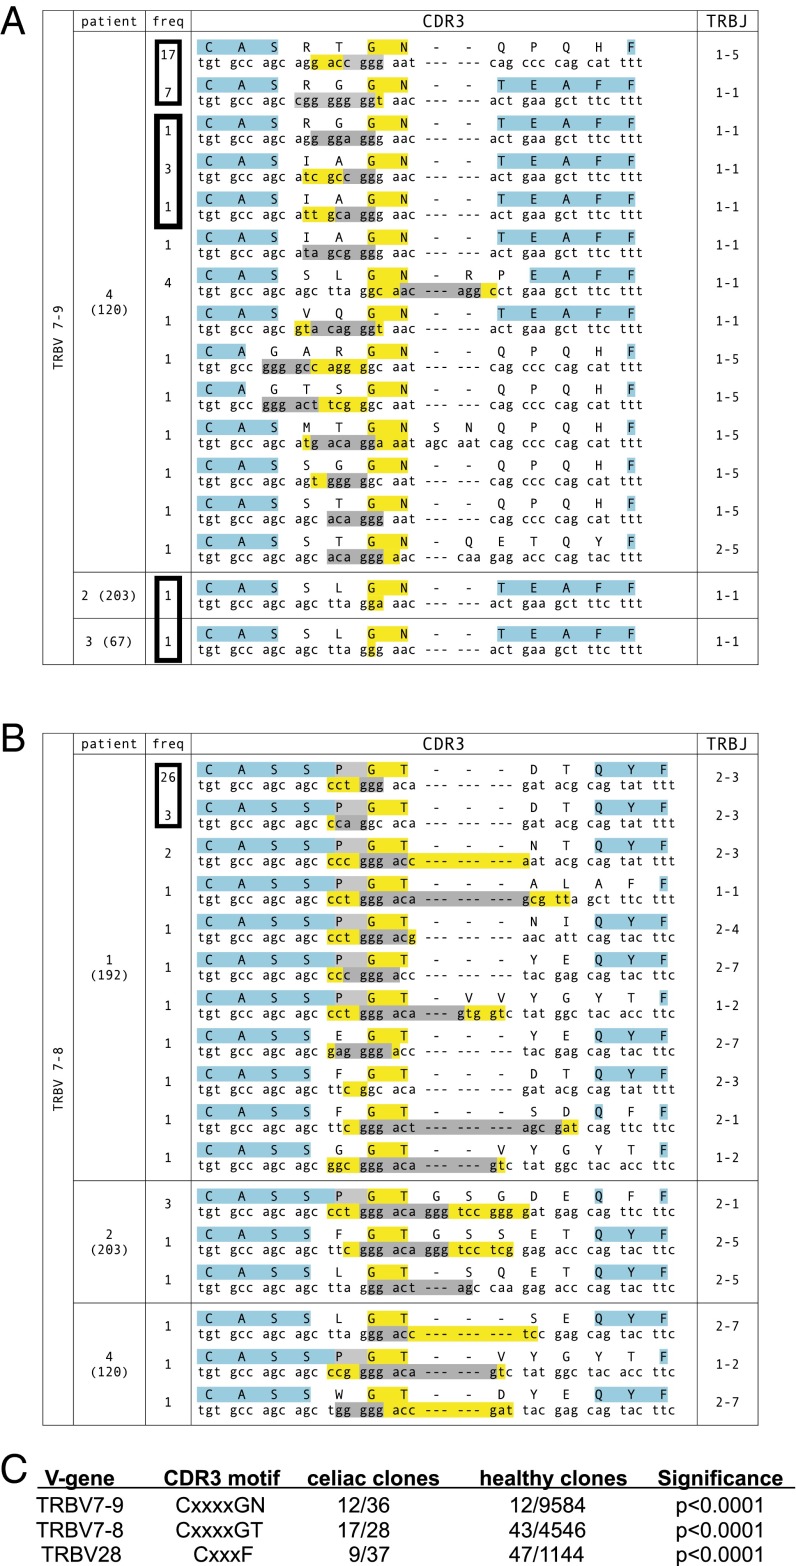
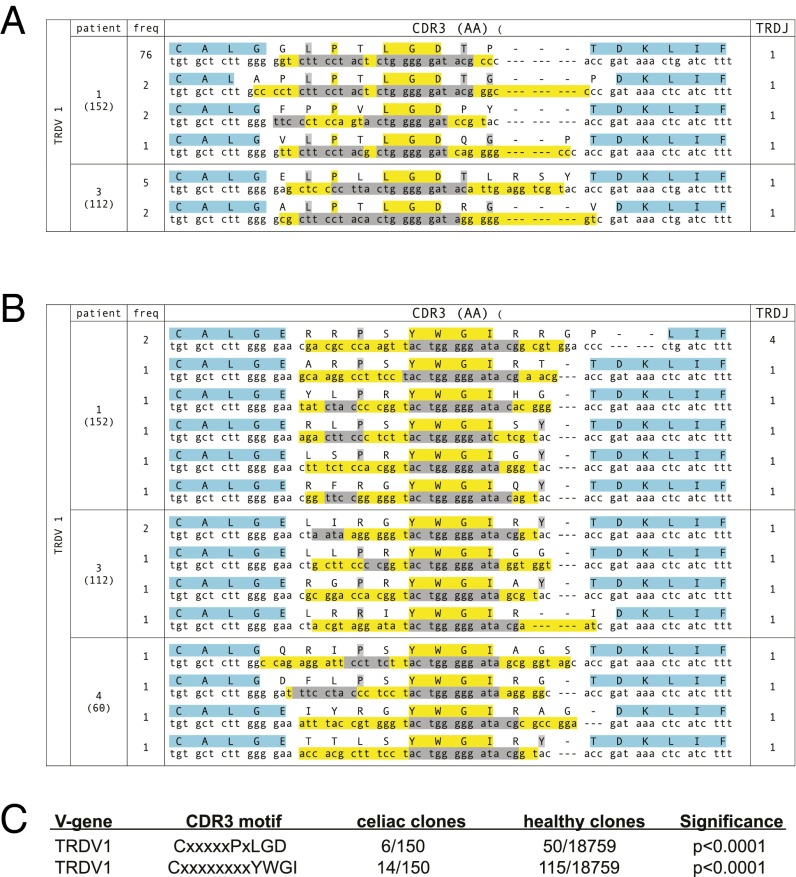
Celiac disease is an intestinal autoimmune disease driven by dietary gluten and gluten-specific CD4(+) T-cell responses. In celiac patients on a gluten-free diet, exposure to gluten induces the appearance of gluten-specific CD4(+) T cells with gut-homing potential in the peripheral blood. Here we show that gluten exposure also induces the appearance of activated, gut-homing CD8(+) αβ and γδ T cells in the peripheral blood. Single-cell T-cell receptor sequence analysis indicates that both of these cell populations have highly focused T-cell receptor repertoires, indicating that their induction is antigen-driven. These results reveal a previously unappreciated role of antigen in the induction of CD8(+) αβ and γδ T cells in celiac disease and demonstrate a coordinated response by all three of the major types of T cells. More broadly, these responses may parallel adaptive immune responses to viral pathogens and other systemic autoimmune diseases.

Keywords: autoimmunity; mucosal immunity.


Conflict of interest statement

The authors declare no conflict of interest.

Figures

Fig. 1.
Fig. 1.
Induction of activated, gut-homing CD8+ αβ and γδ T cells in peripheral blood of celiac patients following oral gluten challenge. (A) Representative FACS analysis of CD8+ αβ and γδ T-cell (Left) and CD4+ T-cell (Right) response to oral gluten challenge in CD vs. nonceliac control. Expansion of CD103+ (αE integrin), CD38+, and gluten tetramer+ CD4+ T-cell populations is seen on day 6 in CD. Most CD38+CD103+ cells also express β7 integrin; only CD103 staining is depicted here. (B) Relative frequency of αEβ7+CD38+CD8+ T cells as a percentage of total CD8+ cells (Top) and relative frequency of αEβ7+CD38+ γδ cells as a percentage of total γδ T cells (Bottom). (C) Time course showing relative percentage of CD38+CD103+CD8+ (Top), CD38+CD103+ γδ (Middle), and gluten tetramer+ CD4+ (Bottom) in the same patient at the indicated time points following oral gluten challenge. Parallel recruitment of CD38+CD103+ and gluten tetramer+ cells peaks on day 6 before returning to baseline.
Fig. 2.
Fig. 2.
Peripheral blood αEβ7+CD38+CD8+ T cells induced by oral gluten challenge express surface markers of effector memory cells and resemble intestinal epithelial CD8+ T lymphocytes from celiac mucosal biopsies. (A) CyTOF analysis of total peripheral blood (PB) CD8+ from a gluten-challenged individual (Left) and total intestinal CD8+ T cells from a celiac patient with active disease (Right) with respect to CD103 and CD38 expression. (B) CyTOF analyses of peripheral blood αEβ7CD38+CD8+ T cells (yellow) and total intestinal CD8+ T cells (red) are overlaid on total peripheral blood CD8+ T cells. Peripheral blood αEβ7+CD38+CD8+ and celiac intestinal CD8+ cells are predominantly CD38+CD45RO+CD45RACD27CD28lowCD62LCCR7, consistent with an effector memory phenotype.
Fig. 3.
Fig. 3.
Single-cell TCR sequencing of peripheral blood αEβ7+CD38+CD8+ and αEβ7+CD38+ γδ T cells reveals clonal expansion upon gluten challenge in celiac disease. αEβ7+CD38+CD8+ TCRs were sequenced in five separate patients following gluten challenge, two of whom underwent rechallenge. αEβ7+CD38+ γδ TCRs were sequenced in three patients, one of whom underwent rechallenge. Each individual dot represents a distinct TCR clone. The size of dots and the position along the y axis, plotted on a log scale, indicate the relative frequency of a particular clone. The total number of clones sequenced in each patient is indicated in parentheses.
Fig. 4.
Fig. 4.
Convergent αEβ7+CD38+CD8+TCRβ CDR3 motifs are found among clones within the same celiac patient and across different patients following gluten challenge. (A and B) Convergent motifs CxxxxGN (A) and CxxxxGT (B) are seen in TCRβ clones using TRBV7-9 and TRBV7-8, respectively. The frequency of each clone is indicated and the total number of T cells sequenced in the patient is indicated in parentheses. The protein sequence with the corresponding DNA sequence is shown. Within the protein sequence, yellow indicates absolutely conserved amino acids, gray indicates relatively conserved (≥50%) amino acids, and blue indicates conserved amino acids that are encoded within the V or J genes. Within the DNA sequence, nucleotides in yellow are formed through N or P addition, whereas nucleotides in gray are encoded by D genes. Boxes around frequency numbers highlight distinct clones sharing identical protein sequences. (C) Convergences of motifs seen in TCRβ clones using TRBV7-9, TRBV7-8, and TRBV28 are statistically significant compared with reference control TCRβ sequences.
Fig. 5.
Fig. 5.
Convergent αEβ7+CD38+TCRδ CDR3 motifs are found among clones within the same celiac patient and across different patients following gluten challenge. (A and B) Convergent motifs CxxxxxPxLGD (A) and CxxxxxxxxYWGI (B) are seen in TCRδ clones using TRBV1. The frequency of each clone is indicated and the total number of T cells sequenced in the patient is indicated in parentheses. The protein sequence with the corresponding DNA sequence is shown. Within the protein sequence, yellow indicates absolutely conserved amino acids, gray indicates relatively conserved (≥50%) amino acids, and blue indicates conserved amino acids that are encoded within the V or J genes. Within the DNA sequence, nucleotides in yellow are formed through N or P addition, whereas nucleotides in gray are encoded by D genes. (C) Convergences of motifs seen in TCRδ clones using TRBV1 are statistically significant compared with reference control TCRδ sequences.

References

    1. Fallang LE, et al. Differences in the risk of celiac disease associated with HLA-DQ2.5 or HLA-DQ2.2 are related to sustained gluten antigen presentation. Nat Immunol. 2009;10(10):1096–1101. - PubMed
    1. Sollid LM, Qiao SW, Anderson RP, Gianfrani C, Koning F. Nomenclature and listing of celiac disease relevant gluten T-cell epitopes restricted by HLA-DQ molecules. Immunogenetics. 2012;64(6):455–460. - PMC - PubMed
    1. Lundin KE, et al. Gliadin-specific, HLA-DQ(alpha 1*0501,beta 1*0201) restricted T cells isolated from the small intestinal mucosa of celiac disease patients. J Exp Med. 1993;178(1):187–196. - PMC - PubMed
    1. Brottveit M, et al. Assessing possible celiac disease by an HLA-DQ2-gliadin tetramer test. Am J Gastroenterol. 2011;106(7):1318–1324. - PubMed
    1. Ráki M, et al. Tetramer visualization of gut-homing gluten-specific T cells in the peripheral blood of celiac disease patients. Proc Natl Acad Sci USA. 2007;104(8):2831–2836. - PMC - PubMed

Publication types

MeSH terms

Substances