. 2013 Aug 6;110(32):13014-9.
doi: 10.1073/pnas.1307170110. Epub 2013 Jul 22.

Higd-1a interacts with Opa1 and is required for the morphological and functional integrity of mitochondria

Affiliations

Higd-1a interacts with Opa1 and is required for the morphological and functional integrity of mitochondria

Hyun-Jung An et al. Proc Natl Acad Sci U S A. .

Abstract

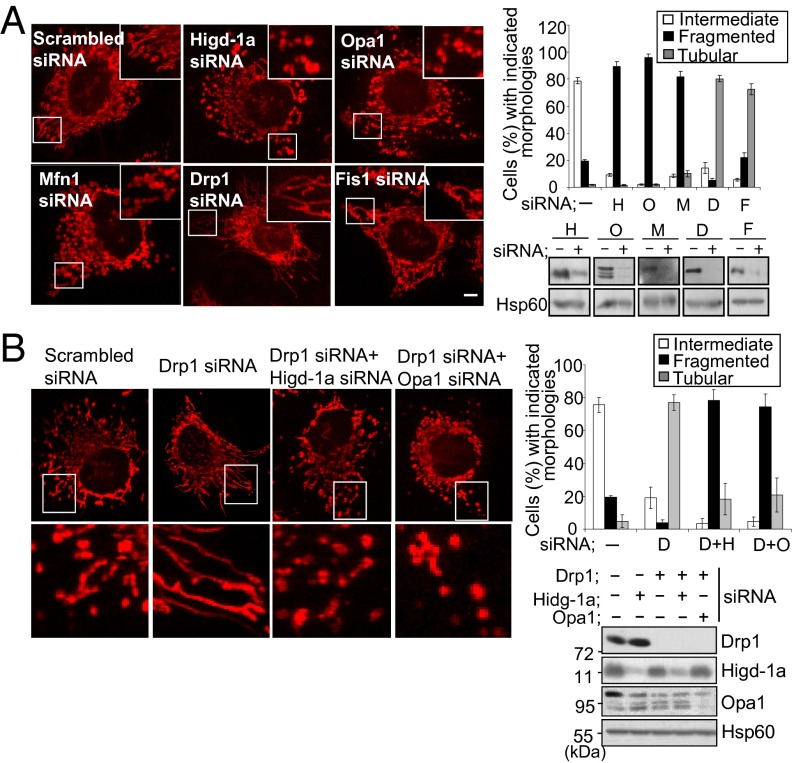
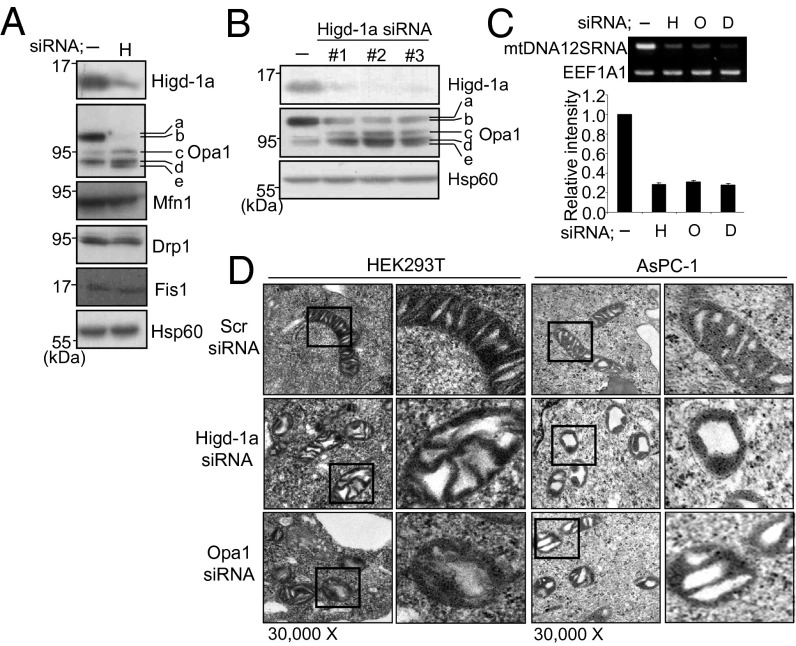
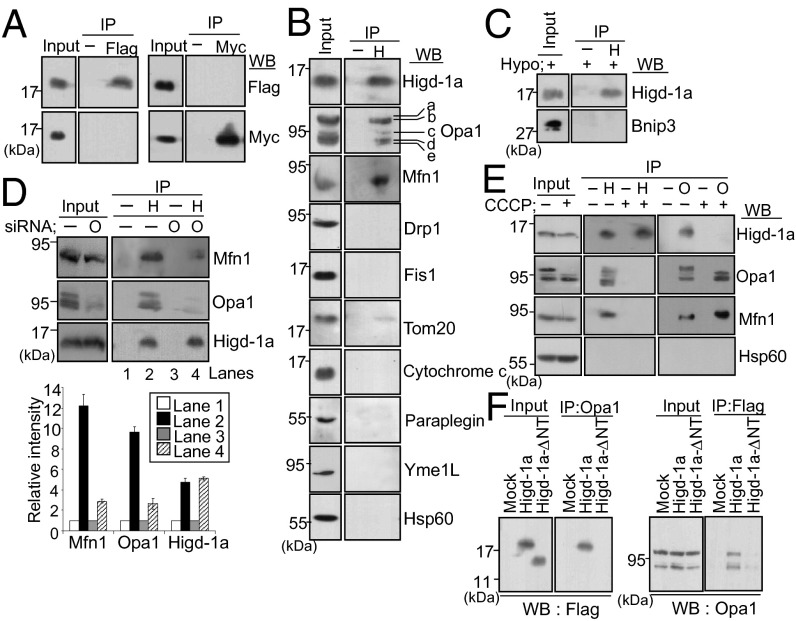
The activity and morphology of mitochondria are maintained by dynamic fusion and fission processes regulated by a group of proteins residing in, or attached to, their inner and outer membranes. Hypoxia-induced gene domain protein-1a (Higd-1a)/HIMP1-a/HIG1, a mitochondrial inner membrane protein, plays a role in cell survival under hypoxic conditions. In the present study, we showed that Higd-1a depletion resulted in mitochondrial fission, depletion of mtDNA, disorganization of cristae, and growth retardation. We demonstrated that Higd-1a functions by specifically binding to Optic atrophy 1 (Opa1), a key element in fusion of the inner membrane. In the absence of Higd-1a, Opa1 was cleaved, resulting in the loss of its long isoforms and accumulation of small soluble forms. The small forms of Opa1 do not interact with Higd-1a, suggesting that a part of Opa1 in or proximal to the membrane is required for that interaction. Opa1 cleavage, mitochondrial fission, and cell death induced by dissipation of the mitochondrial membrane potential were significantly inhibited by ectopic expression of Higd-1a. Furthermore, growth inhibition due to Higd-1a depletion could be overcome by overexpression of a noncleavable form of Opa1. Collectively, our observations demonstrate that Higd-1a inhibits Opa1 cleavage and is required for mitochondrial fusion by virtue of its interaction with Opa1.


Conflict of interest statement

The authors declare no conflict of interest.

Figures

Fig. 1.
Fig. 1.
Depletion of Higd-1a induces mitochondrial fragmentation. (A) HeLa cells were transfected with scrambled (-), Higd-1a (H), Opa1 (O), Mfn1 (M), Drp1 (D), and Fis1 (F) siRNAs for 3 d. To visualize mitochondria, cells were stained with MitoTracker Red, fixed, and mounted for microscopy. Images were captured with a confocal microscope (Left). Insets are enlargements of the boxed areas. (Scale bar: 10 μm.) In each case, >200 cells in several fields were counted to determine the percentages of the cell populations with tubular (highly interconnected), intermediate, and fragmented mitochondria (Right). Cells were immunoblotted after 3 d of transfection with the indicated siRNAs, using antibodies against the corresponding proteins. Hsp60 was used as an internal standard. Data are representative of more than three independent experiments. (B) Cells were transfected with scrambled siRNA (-) and siRNAs for Drp1 (D), Drp1 plus Higd-1a (D+H), and Drp1 plus Opa1 (D+O) for 3 d. The cells were stained and counted as described in A. Lower shows enlargements of the boxed areas (Left). Cells were immunoblotted with antibodies as indicated.
Fig. 2.
Fig. 2.
Higd-1a is needed for maintaining the L isoform of Opa1, mitochondrial morphology, and mtDNA. (A) Expression of Higd-1a, Opa1, Mfn1, Drp1, Fis1, and Hsp60 proteins in HEK293T cells was analyzed by immunoblotting after 3 d of transfection with scrambled (-) or Higd-1a siRNAs (H). Higd-1a, Opa1, Mfn1, Fis1, and Hsp60 were analyzed by using extracts of mitochondrial fractions and Drp1 using total cell extracts. Five isoforms of Opa1 are labeled a–e (9). (B) Depletion of Higd-1a and changes of Opa-1 isoforms were examined by transfection with three different Higd-1a siRNA oligonucleotides. Hsp60 protein levels are shown as a loading control. -, scrambled siRNA. (C) HEK293T cells were transiently transfected with scrambled (-), Higd-1a (H), Opa1 (O), or Drp1 (D) siRNAs and cultured for 3 d. Total DNA was analyzed by PCR for the 12S ribosomal RNA small subunit mitochondrial gene (Upper) and by quantitative real-time PCR (Lower). As a nuclear DNA control, the Elongation translation factor 1 gene (EEF1A1) was used. (D) HEK293T or AsPc-1 cells were transfected with siRNAs of scrambled (Scr), Higd-1a or Opa1 for 3 d and fixed. Thin sections of cells were visualized by transmission electron microscopy. Right for each cell line shows an enlargement of the boxed area. (Magnification: 30,000x.)
Fig. 3.
Fig. 3.
Silencing of Higd-1a expression inhibits cell proliferation. HEK293T and HeLa cells were transiently transfected with scrambled (-) or Higd-1a (H) siRNAs. (A) Total cell extracts were immunoblotted with anti–Higd-1a polyclonal antibody. β-Actin was used as a loading control. (B) Total viable cells were counted by Trypan blue exclusion at the indicated times after transfection. (C) Images of representative cell culture dishes stained with crystal violet were obtained 2 wk after transfection. (D) Flow cytometry cell cycle analysis of HeLa cells 4 d after transfection. (E) Three days after transfection, BrdU was added for an additional 24 h and BrdU incorporation was analyzed by flow cytometry. (F) Annexin V/propidium iodide staining was performed 4 d after transfection. The percentages of annexin V and propidium iodide negative cells (viable cells) were quantified by flow cytometry. (G) Three days after transfection, HeLa cells were stained with rhodamine-123 and relative fluorescence intensity was analyzed by flow cytometry to measure mitochondrial membrane potential. As a positive control for membrane potential changes, cells were treated with 10 μM CCCP for 30 min. Results shown are representative of three independent experiments. Data are means ± SE. **P < 0.01 and ***P < 0.001.
Fig. 4.
Fig. 4.
Higd-1a interacts with Opa1, and the N-terminal tail of Higd-1a participates in binding. (A) HEK293T cells were transfected with Higd-1a–myc and Higd-1a–Flag vectors for 2 d. Total cell lysates were immunoprecipitated (IP), with anti-Flag or anti-myc antibodies, and immunoblotted (WB). The amount of input loaded was approximately 5% of the lysate used for immunoprecipitation. (B) Endogenous Higd-1a was immunoprecipitated from the mitochondrial lysate with anti–Higd-1a antibody and immunoblotted with the indicated antibodies. For Drp1 immunoblotting, the total lysate was used. (C) HEK293T cells were incubated under hypoxia (0.1% O2) for 24 h. Mitochondrial lysates were immunoprecipitated with anti–Higd-1a and immunoblotted with anti–Higd-1a or anti-BNIP3 antibodies. (D) HEK293T cells were transfected with scrambled (-) or Opa1 (O) siRNA for 3 d. Mitochondrial lysates were immunoprecipitated with (H) or without (-) anti–Higd-1a and immunoblotted with the indicated antibodies (Upper). The relative intensities of the Western blot bands of lanes 1–4 in the autoradiogram were analyzed with TINA 2.0 (Lower). Data represent the mean ± SE of three independent experiments. (E) HEK293T cells were incubated with or without 10 µM CCCP for 30 min. Mitochondrial lysates were immunoprecipitated (IP) with anti–Higd-1a (H) or anti-Opa1 (O) antibodies and immunoblotted (WB) with the indicated antibodies. (F) HEK293T cells were transiently transfected with mock, Higd-1a–Flag or Higd-1a–ΔNT-Flag vectors. Forty-eight hours after transfection, total cell lysates were immunoprecipitated (IP) with anti-Opa1 (Left) or anti-Flag (Right) and immunoblotted (WB) with anti-Flag or anti-Opa1 antibodies, respectively.
Fig. 5.
Fig. 5.
Higd-1a overexpression delays cleavage of the Opa1 L isomer. (A and B) HEK293T cells were transfected with mock or Higd-1a–Flag vector for 2 d and incubated under hypoxia (0.1% O2) (A) or with 10 µM CCCP (B) for the indicated times. Total cell lysates were subjected to Western blotting by using anti-Opa1 or anti-Flag antibodies. Hsp60 protein levels are shown as loading controls. (C) HeLa cells were transfected with Higd-1a–Flag or Higd-1a–ΔNT-Flag vectors for 3 d and treated with 10 µM CCCP for 15 min. Cells were visualized under a confocal fluorescence microscope after staining with MitoTracker (red) and FITC-tagged anti-Flag (green). Merged confocal fluorescence images are shown in Right, and enlargements of boxed areas a-d are shown in Left Bottom. (Scale bar: 10 µm.) Approximately 100 FITC-negative (FITC) and 100 FITC-positive (FITC+) cells were counted, and the percentages of each having more than 50% tubular, less than 50% tubular, and fragmented mitochondria were calculated (Right). (D) HEK293T cells were transfected with mock or Higd-1a–Flag vectors for 2 d and treated with 10–50 µM CCCP for 1 h. Twenty-four hours after CCCP washout, total viable cells were counted by Trypan blue exclusion. (E) The Opa1 isoform 1 and its Opa1-ΔS1 mutant were overexpressed in HEK293T with or without Higd-1a siRNA for 4 d, and cell growth was assessed by 3-(4,5-dimthylthiazol-2-yl)-2,5-diphenyltetrazolium bromide assay (Left). Expression of Opa1 and Opa1-ΔS1 proteins in cells not harboring Higd-1a siRNA was verified by Western blotting (Right). Results shown are representative of three independent experiments. Data are mean ± SE; ***P < 0.001.

References

    1. Hoppins S, Lackner L, Nunnari J. The machines that divide and fuse mitochondria. Annu Rev Biochem. 2007;76:751–780. - PubMed
    1. Santel A, Fuller MT. Control of mitochondrial morphology by a human mitofusin. J Cell Sci. 2001;114(Pt 5):867–874. - PubMed
    1. Rojo M, Legros F, Chateau D, Lombès A. Membrane topology and mitochondrial targeting of mitofusins, ubiquitous mammalian homologs of the transmembrane GTPase Fzo. J Cell Sci. 2002;115(Pt 8):1663–1674. - PubMed
    1. Koshiba T, et al. Structural basis of mitochondrial tethering by mitofusin complexes. Science. 2004;305(5685):858–862. - PubMed
    1. Olichon A, et al. The human dynamin-related protein OPA1 is anchored to the mitochondrial inner membrane facing the inter-membrane space. FEBS Lett. 2002;523(1-3):171–176. - PubMed

Publication types

MeSH terms