. 2013 Jul 22;202(2):231-40.
doi: 10.1083/jcb.201301090.

Inhibition of Cdc42 during mitotic exit is required for cytokinesis

Affiliations

Inhibition of Cdc42 during mitotic exit is required for cytokinesis

Benjamin D Atkins et al. J Cell Biol. .

Abstract

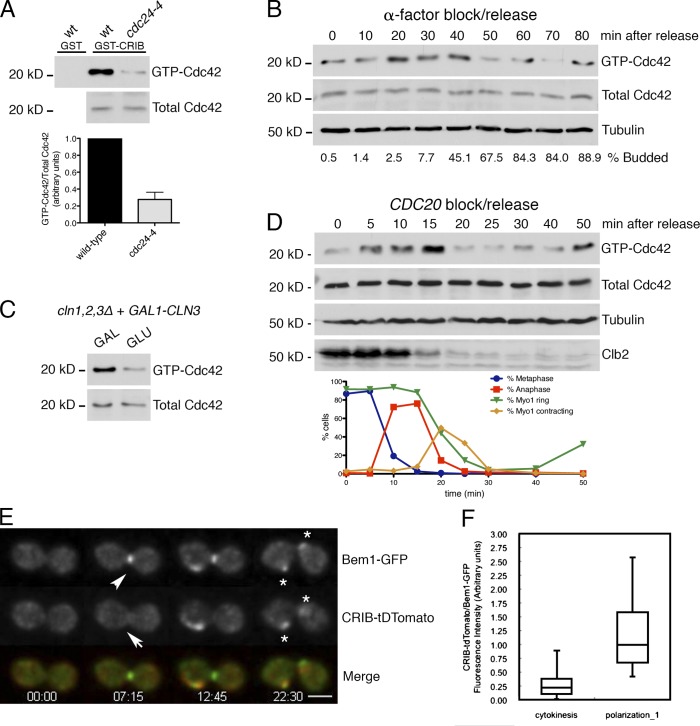
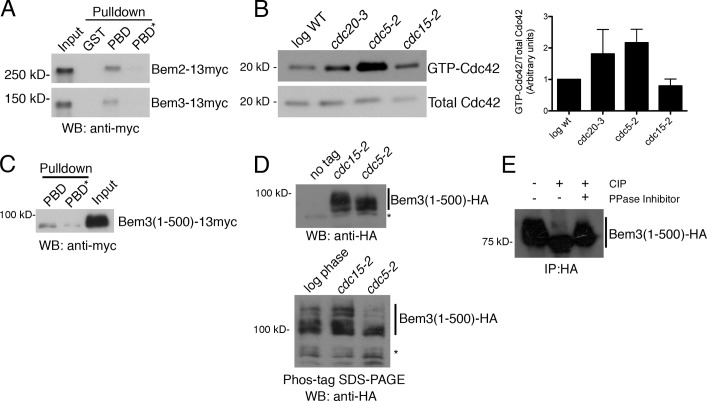
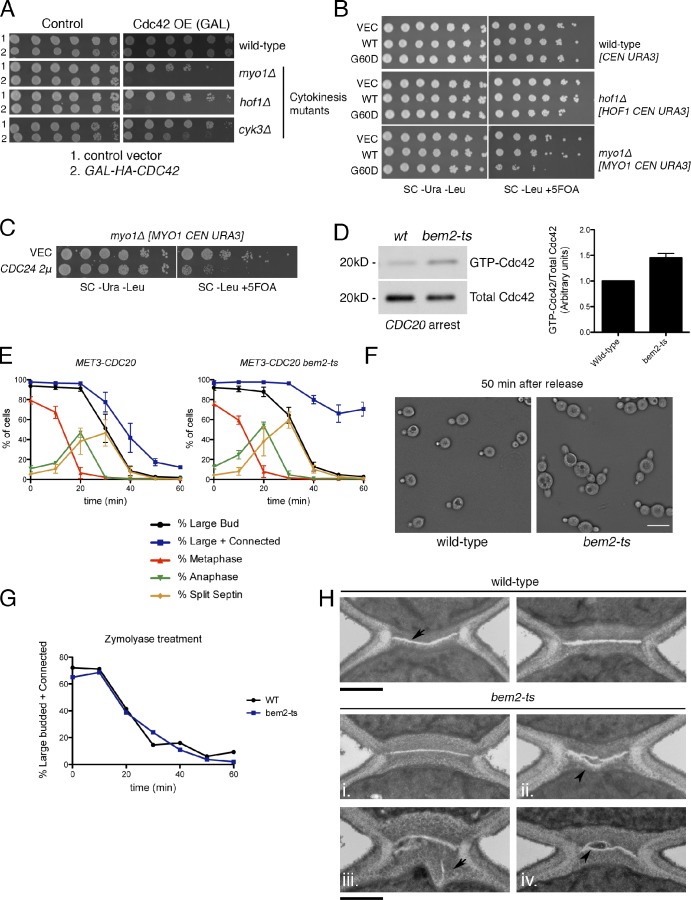
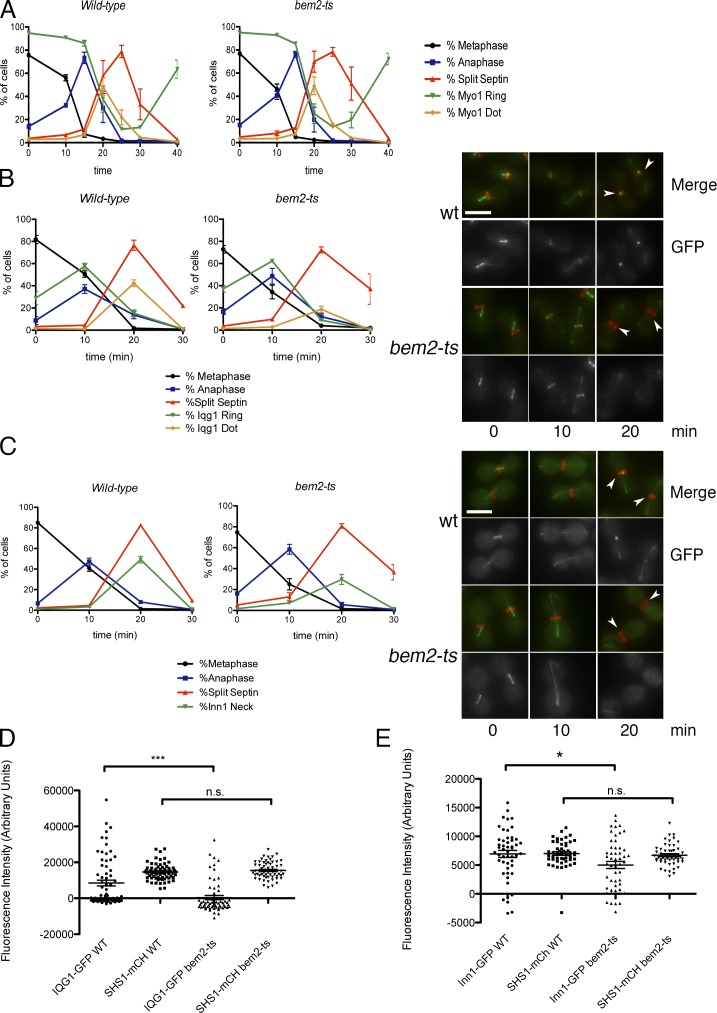
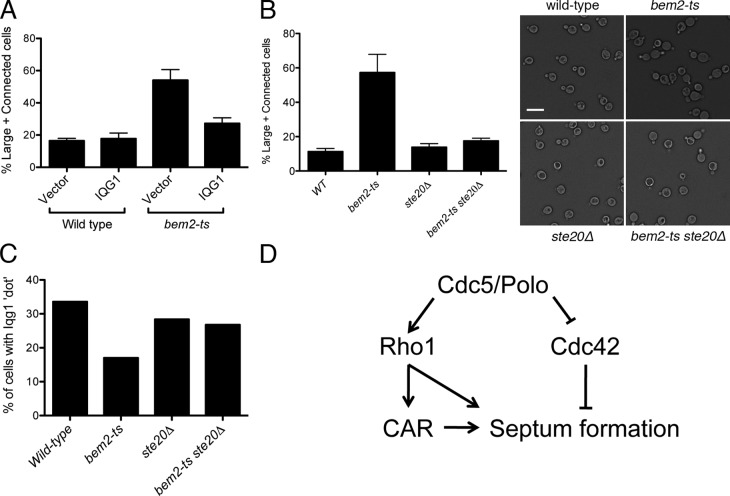
The role of Cdc42 and its regulation during cytokinesis is not well understood. Using biochemical and imaging approaches in budding yeast, we demonstrate that Cdc42 activation peaks during the G1/S transition and during anaphase but drops during mitotic exit and cytokinesis. Cdc5/Polo kinase is an important upstream cell cycle regulator that suppresses Cdc42 activity. Failure to down-regulate Cdc42 during mitotic exit impairs the normal localization of key cytokinesis regulators-Iqg1 and Inn1-at the division site, and results in an abnormal septum. The effects of Cdc42 hyperactivation are largely mediated by the Cdc42 effector p21-activated kinase Ste20. Inhibition of Cdc42 and related Rho guanosine triphosphatases may be a general feature of cytokinesis in eukaryotes.


Figures

Figure 1.
Figure 1.
Cdc42 activity peaks at G1/S and anaphase and is suppressed during cytokinesis. (A) Wild-type (wt) and cdc24-4 ts cells were shifted to 37°C for 2.5 h, and lysates were assayed for GTP-Cdc42 levels by GST-CRIB binding. Graph shows means ± SEM from three experiments, P < 0.01 by unpaired two-tailed t test. (B) bar1Δ cells were released from an α-factor block, and GTP-Cdc42 was measured at the indicated time points. (C) cln1,2,3Δ GAL1-CLN3 cells were split into media containing either galactose (GAL) or glucose (GLU), in which CLN3 expression is repressed. The example is representative of three experiments. (D) GALL-CDC20 GFP-TUB1 MYO1-GFP cells were arrested at metaphase and released. Samples were processed to measure GTP-Cdc42 activation and for microscopy to determine cell cycle stage. The example is representative of three experiments. (E) Time-lapse imaging of a CRIB-tdTomato BEM1-GFP cell undergoing mitotic exit. Image 00:00 (minutes and seconds) is 1 h after release from hydroxyurea. Bar, 5 µm. During cytokinesis, little CRIB-tdTomato (arrow) localizes to the bud neck relative to Bem1-GFP (arrowhead); both localize to the subsequent bud sites (asterisks). (F) Quantification of CRIB-tdTomato/Bem1-GFP intensity ratio during cytokinesis and polarization. Lines are medians, top and bottom edges indicate 25th and 75th quartiles, and whiskers are the highest and lowest measurements.
Figure 2.
Figure 2.
Cdc5/Polo kinase suppresses Cdc42 activation. (A) Lysates from the indicated strains were incubated with GST, GST-PBD, or a control “pincer” mutant PBD* (Elia et al., 2003). Bound GAPs were detected by Western blotting. (B) Log phase wild-type (WT), cdc20-3, cdc5-2, and cdc15-2 cells were shifted to 37°C for 3 h and processed for Cdc42 activation. The example is representative of three experiments. Graph shows means ± SEM. The difference between cdc5-2 and cdc15-2 was statistically significant (P < 0.05 by unpaired two-tailed t test). (C) Lysate from a Bem3(1–500)-13myc cdc15-2 strain (arrested 2.5 h at 35°C) was incubated with purified PBD or PBD* as in A. (D) The indicated strains were arrested as in C; shown is a Western blot to detect altered mobility of Bem3(1–500)-3HA. (bottom) Phos-tag SDS-PAGE was used for increased resolution of phosphorylated bands. Asterisks mark nonspecific bands. (E) Bem3(1–500)-3HA was immunoprecipitated from cdc15-2 cell lysates arrested in telophase as in C and incubated with calf intestinal phosphatase (CIP) and/or phosphatase (PPase) inhibitors. IP, immunoprecipitation; WB, Western blot.
Figure 3.
Figure 3.
Active Cdc42 interferes with cytokinesis and cell separation. (A) Cells transformed with vector (VEC) or GAL1-HA-CDC42 plasmids were spotted in fivefold dilutions on the indicated media (3 d at 25°C). OE, overexpression; GAL, galactose. (B) Expression of cdc42G60D from the CDC42 promoter on a CEN plasmid (one to three copies per cell) is toxic to myo1Δ cells. Cells were grown on the indicated media (3 d at 25°C). Synthetic lethality is detected on 5-fluoroorotic acid (5FOA) media as a counterselection for the indicated URA3-containing plasmids. (C) myo1Δ cells transformed with control or CDC24 2μ plasmids were grown on plates as in B. SC, synthetic complete. (D) Wild-type (wt) and bem2-ts cells were arrested in metaphase by CDC20 depletion, shifted to the restrictive temperature (37°C at 1.5 h), and processed for Cdc42 activation. Graph shows means ± SEM from three experiments. (E) Cells were arrested in metaphase, shifted to 37°C for 1 h, and released at 37°C. The percentage of cells with the indicated morphology is plotted as means ± SEM from three experiments. Connected indicates two adjacent cell bodies showing evidence of rebudding or repolarization. (F) Bright-field image of cells 50 min after release. Bar, 15 µm. (G) Cells from E were treated with zymolyase to digest the cell wall, and the percentage of large-budded or connected cells was scored. (H) Wild-type cells have a PS (arrow) sandwiched by secondary septa; bem2-ts cells have misaligned, multiple, or otherwise abnormal PSs (arrowheads). Bars, 500 nm.
Figure 4.
Figure 4.
Inefficient localization of Iqg1 and Inn1 during cytokinesis in bem2-ts cells. (A) MET3-CDC20 GFP-TUB1 SHS1-mCherry MYO1-GFP strains with or without bem2-ts were synchronized as in Fig. 3 E. Graph shows means ± SEM for three experiments. (B) Similar strains as in A but with IQG1-GFP were synchronized as in Fig. 3 E. IQG1-GFP, if present at the bud neck, was scored as either being a ring or contracted dot. The percentage of cells with the indicated localization pattern is plotted as means ± SEM from three experiments. (right) Representative images of cells. Arrowheads show Iqg1 bud neck localization. (C) Similar strains as in A but with INN1-GFP. Percentage of Inn1 neck represents percentage of cells with Inn1-GFP at the bud neck. (right) Representative images of cells from the indicated time points. Arrowheads show Inn1 bud neck localization. (D) Scatter plot of Iqg1-GFP and Shs1-mCherry background-corrected fluorescence intensity at the bud neck in bem2-ts cells 20 min after release from CDC20 arrest in SHS1-mCherry IQG1-GFP cells. Note that negative values after background subtraction indicate either increased cytoplasmic background or completion of cytokinesis with a corresponding loss of background signal in the bud neck area. Lines indicate means, and error bars represent SEMs; n > 60 cells. The difference for Iqg1-GFP intensity between wild type (WT) and bem2-ts was statistically significant (P < 0.0001 by unpaired two-tailed t test), whereas the difference for Shs1-mCherry (mCh) was not significant. (E) Inn1-GFP fluorescence intensity at the bud neck was measured as in D; n > 50 cells. The difference for Inn1-GFP was significant (P < 0.05 by unpaired two-tailed t test). Bars, 5 µm.
Figure 5.
Figure 5.
Ste20 and Iqg1 mediate the inhibitory effect of active Cdc42 on cytokinesis and cell separation. (A) Cells transformed with 2μ IQG1 or a control vector were synchronized as in Fig. 3 E, and the percentage of large-budded or connected cells was determined 50 min after release. Graph shows means ± SEM from three experiments using independent 2μ-containing isolates (B) Cells were synchronized and scored as in A. Graph shows means ± SEM for three experiments. Bar, 10 µm. (C) Percentage of cells with contracting Iqg1-GFP dot 20 min after release from CDC20 arrest. Data are representative of two experiments; n > 200 cells. WT, wild type.

Comment in

Similar articles

Cited by

References

    1. Adams A.E., Johnson D.I., Longnecker R.M., Sloat B.F., Pringle J.R. 1990. CDC42 and CDC43, two additional genes involved in budding and the establishment of cell polarity in the yeast Saccharomyces cerevisiae. J. Cell Biol. 111:131–142 10.1083/jcb.111.1.131 - DOI - PMC - PubMed
    1. Amon A. 2002. Synchronization procedures. Methods Enzymol. 351:457–467 10.1016/S0076-6879(02)51864-4 - DOI - PubMed
    1. Bastos R.N., Penate X., Bates M., Hammond D., Barr F.A. 2012. CYK4 inhibits Rac1-dependent PAK1 and ARHGEF7 effector pathways during cytokinesis. J. Cell Biol. 198:865–880 10.1083/jcb.201204107 - DOI - PMC - PubMed
    1. Benard V., Bokoch G.M. 2002. Assay of Cdc42, Rac, and Rho GTPase activation by affinity methods. Methods Enzymol. 345:349–359 10.1016/S0076-6879(02)45028-8 - DOI - PubMed
    1. Benton B.K., Tinkelenberg A., Gonzalez I., Cross F.R. 1997. Cla4p, a Saccharomyces cerevisiae Cdc42p-activated kinase involved in cytokinesis, is activated at mitosis. Mol. Cell. Biol. 17:5067–5076 - PMC - PubMed

Publication types

MeSH terms

Substances