. 2013 Jul 22;202(2):365-79.
doi: 10.1083/jcb.201211039.

Coordinated waves of actomyosin flow and apical cell constriction immediately after wounding

Affiliations

Coordinated waves of actomyosin flow and apical cell constriction immediately after wounding

Marco Antunes et al. J Cell Biol. .

Abstract

Epithelial wound healing relies on tissue movements and cell shape changes. Our work shows that, immediately after wounding, there was a dramatic cytoskeleton remodeling consisting of a pulse of actomyosin filaments that assembled in cells around the wound edge and flowed from cell to cell toward the margin of the wound. We show that this actomyosin flow was regulated by Diaphanous and ROCK and that it elicited a wave of apical cell constriction that culminated in the formation of the leading edge actomyosin cable, a structure that is essential for wound closure. Calcium signaling played an important role in this process, as its intracellular concentration increased dramatically immediately after wounding, and down-regulation of transient receptor potential channel M, a stress-activated calcium channel, also impaired the actomyosin flow. Lowering the activity of Gelsolin, a known calcium-activated actin filament-severing protein, also impaired the wound response, indicating that cleaving the existing actin filament network is an important part of the cytoskeleton remodeling process.


Figures

Figure 1.
Figure 1.
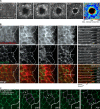
Drosophila pupal wound healing. Movie stills of a wounded pupal notum expressing mCherry-Moesin under the control of pnr-GAL4 and Sqh-GFP show that pupal epithelial repair recapitulates embryonic wound healing. White arrowheads highlight the actomyosin cable. Actin-rich protrusions, such as lamellipodia and filopodia, are highlighted in the zoom panel at 30 min after wounding. Time after wounding is indicated in the top panels. Bars: (main panels) 20 µm; (insets) 10 µm.
Figure 2.
Figure 2.
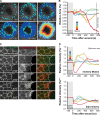
The initial wound healing response consists of a pulse and flow of actomyosin and a synchronized wave of apical cell constriction. (Ai) Movie stills of a pupal notum expressing UAS-mCherry-Moesin driven by pnr-GAL4 show a flow of increasing actin accumulation, which is visible in the early minutes of wound healing and culminates in cable formation. Time after wounding is indicated in the panel’s top left corner. (Aii) Graphic representation of the actin flow according to a color-coded time scale. The time when each pixel reaches its maximum actin intensity is color coded, ranging from early time points in dark blue to latter time points in dark red. A wild-type flow is represented by a gradient of colors, dark blue in the periphery (early maximum actin intensity) and red at the leading edge (late maximum actin intensity). Bar, 10 µm. (Bi) Movie stills of an epithelium expressing mCherry-Moesin and Sqh-GFP show that after injury actin and myosin flows progress toward the wound. Dashed lines indicate the wound margin. Horizontal line indicates the xz kymograph area shown in Fig. 2 Bii. Bar, 5 µm. (Bii) xz kymograph shows that the myosin follows the actin flow in the early minutes of wound healing. White arrowheads indicate the position of the maximum of myosin intensity at each time point. Both flows are apical and culminate in the formation of the actomyosin purse-string (yellow arrowhead). Bars: (x) 5 µm; (z) 2 µm. (C) Movie stills of the early stages of wound healing in a pupal notum expressing E-cadherin–GFP. A wave of synchronized cell constriction can be seen starting as early as 200 s after wounding and rapidly progressing toward the wound margin. Cells highlighted by white arrowheads are at the leading edge of the contraction wave. The magenta line represents the previous frame superimposed on the actual frame (green). Time after wounding is indicated at the bottom of each panel. Bar, 5 µm.
Figure 3.
Figure 3.
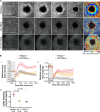
Coordinated actin and myosin flows provide the driving force for apical cell constriction. (Ai) Movie stills of the initial stages of wound healing illustrate that the early contraction wave assumes a circular shape. Cells that constrict during the indicated time intervals are highlighted in light blue. Dark blue shows all cells that have contracted since the beginning of wound healing. (Aii) Representative image of the wounded tissue shown in Ai highlighting a color code that represents distance in number of cell rows to wound. Rows close to the margin are colored in red and the following rows are colored in the sequence: yellow, green, light blue, and dark blue. Bars: (i and ii) 10 µm. (B) Graph representing changes in relative cell area during the initial stages of wound healing. Asterisks indicate the maximum area that follows the initial cell expansion. Arrowheads highlight maximum constriction of each cell row revealing that cells closer to the wound margin contract later. Color code represents distance to the wound according to Aii. (C) Stills of an E-cadherin–GFP and mCherry-Moesin movie illustrating that cell constriction follows actin assembly in progression toward the wound margin (dashed line). Bar, 5 µm. White arrowheads highlight a cell that first shows an increase in actin followed by constriction. Yellow arrowheads show a similar pattern visible in the next cell moments later. (Di) Graph representing the variation of actin intensity with time during the initial stages of wound healing. Asterisks highlight maximum actin concentration of each cell row revealing that cells closer to the wound reach their maximum actin concentration later compared with cells further away from the wound. Corresponding time points of minimum area/maximum constriction are marked with a dashed line. (Dii) Graph representing the variation of myosin intensity with time during the initial stages of wound healing. Asterisks highlight maximum myosin concentration of each cell row revealing that cells closer to the wound reach their maximum myosin concentration later. Corresponding time points of minimum area/maximum constriction are marked with a dashed line. Color code in Di and Dii correspond to Aii.
Figure 4.
Figure 4.
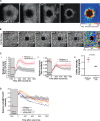
Diaphanous and ROCK regulate the actomyosin flow. (Ai) Movie stills of a pupal notum expressing UAS-mCherry-Moesin driven by pnr-GAL4 show the flow of increasing actin concentration, which is visible in the early minutes of wound healing. Both Dia and ROCK RNAi impair the actin flow, leading to a weaker cable. (Aii) Graphic representation of the actin flow, color coded as Fig. 2 Aii. An impairment of the actin flow can be seen in the cases of Dia and ROCK RNAi. Bar, 10 µm. (Bi) Graph representing the variation of actin flow intensity in WT, Dia RNAi, and ROCK RNAi. Actin flow intensity decreases when expression of either gene is reduced. (Bii) Graph representing the variation of myosin flow intensity in WT, Dia RNAi, and ROCK RNAi. Myosin flow intensity decreases when expression of either gene is down-regulated. ROCK knockdown is particularly effective in reducing myosin concentration. Shadows represent the SEM for each curve. (Biii) Quantification of myosin cable intensity after wounding in WT, Dia RNAi–, and ROCK RNAi–expressing tissues reveals that the cable is weaker when Dia or ROCK expression is reduced (P = 0.008 and P = 0.004, respectively; Mann-Whitney test).
Figure 5.
Figure 5.
Junctional E-cadherin gradients in wounds. (A) Analysis of the first 150 s after wounding reveals that the adherens junctions closer to the wound (i–iv) initially stretch in the axis parallel to the wound and this is accompanied by a decrease in E-cadherin–GFP levels. To facilitate comparison, lines with the same color have the same length and follow the color code as in Fig. 3 Aii. Asterisks indicate the wound site. Bars, 5 µm. (A′) Diagram illustrating the changes in junctional length upon wounding. Junctions perpendicular to the wound are compressed and shortened due to tissue displacement that results from wound opening, and junctions parallel to the wound increase their length. The color code in matched with the previous panel and with Fig. 3 Aii. (Bi) Quantitative analysis of junctional length and relative E-cadherin levels in consecutive rows of cells around the wound in wild-type tissue. The green dataset represents the length ratio of parallel over perpendicular junctions, whereas the purple dataset represents the E-cadherin intensity ratio of parallel over perpendicular junctions. The proximity of junctions (i–iv) to the wound edge are as in A; junctions i are the closest and iv the most distant. Upon wounding, relative cell junction length ratio increases (junction length ratio = average parallel junctions length/average perpendicular junctions length) and relative E-cadherin levels decrease, establishing a gradient that is more pronounced at the wound margin (junctions i) and more attenuated four cell rows away from the wound margin (junctions iv). Relative junction length and E-cadherin–GFP intensity are calculated relatively to the average values before wounding. Shaded areas represent the SEM for each curve. (Bii) Analysis of junctional length and relative E-cadherin levels in ROCK RNAi tissue shows that upon ROCK down-regulation tissue displacement and E-cadherin distribution are different from wild-type.
Figure 6.
Figure 6.
Wounds cause an increase of intracellular calcium. (Ai) Movie stills of a pupal notum expressing the calcium probe G-CaMP3-GFP driven by pnr-GAL4 in the early seconds of wound healing. After an initial rise in intracellular calcium in the vicinity of the wound, which spreads throughout the injured tissue, a wave of high calcium levels can be observed progressing toward the wound center. (Aii) Graphic representation of the calcium wave color coded as Fig. 2 Aii. Bar, 10 µm. (B) Movie stills showing that TRPM down-regulation impairs the actin flow. (Bii) Graphic representation of the actin flow, color coded as Fig. 2 Aii. An impairment of the actin flow can be seen when TRPM is down-regulated. Bar, 10 µm. (Ci and Cii) Graphs representing the variation of actin and myosin flow intensity in WT and TRPM RNAi showing that TRPM down-regulation affects both actin and myosin flows. Shadows represent the SEM for each curve. (Ciii) Quantification of myosin cable intensity in WT and TRPM RNAi shows that this structure is weaker when TRPM expression is reduced (P = 0.007, Mann-Whitney test). (D) Graph representing GCaMP3-GFP (calcium probe) intensity in wild-type, Dia RNAi, ROCK RNAi, and TRPM RNAi. Calcium levels in Dia knockdown are similar to wild-type, whereas ROCK RNAi initially shows low levels of intracellular calcium that decay very slowly. In TRPM down-regulation the initial increase of calcium levels is impaired and it decreases faster to basal levels.
Figure 7.
Figure 7.
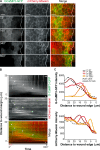
Calcium wave and actin flow progress in synchrony toward the wound margin. (A) High magnification stills of a pupal notum expressing G-CaMP3-GFP and mCherry-Moesin under the control of pnr-GAL4 in the early seconds of wound healing. After the initial spreading, a wave of high intracellular calcium progresses toward the wound in synchrony with the actin wave, culminating in actin cable formation. A dashed white line marks the wound margin. Bar, 10 µm. (B) Kymograph showing the progression of the calcium wave (white arrowheads) immediately behind the actin flow in the early seconds of wound healing. First detection of the actin flow (dashed lines in Distance and Time) occurs in a region of optimal calcium concentration immediately next to a region of highest concentration. Red line in the Time axis highlights the delay between the initiation of the calcium wave and first detection of the actin flow. Asterisk indicates the actin cable. (C) Graphs representing the variation of G-CaMP3-GFP and mCherry-Moesin intensity with wound distance in the first 1,200 s of wound healing. Peaks of high intracellular calcium levels correspond to low actin intensity. The actomyosin flow is formed in cells that exhibit intermediate calcium levels and travels ahead of the calcium wave culminating in actin cable formation. Asterisks in the G-CaMP3 curves indicate position of the actin flow in the same tissue region, at the same time.
Figure 8.
Figure 8.
Gelsolin links calcium to the cytoskeleton remodeling. (A) Movie stills of a wounded pupal notum expressing dsRNA against Gelsolin and mCherry-Moesin driven by pnr-GAL4. The actin filament polymerization is not detected as in the control response (Fig. 4 A), indicating that the actin flow is disrupted by Gelsolin down-regulation. (Aii) An impairment of the actin flow can be seen on the graphic representation, color coded as Fig. 2 Aii. Bar, 10 µm. (Bi and Bii) Graphs representing the variation of actin and myosin flow intensity in WT and Gelsolin RNAi showing that upon Gelsolin down-regulation both flows are affected. Shadows represent the SEM for each curve. (Biii) Quantification of myosin cable intensity in WT and Gelsolin RNAi shows that this structure is weaker when Gelsolin expression is reduced (P = 0.035, Mann-Whitney test).
Figure 9.
Figure 9.
Graphic model. Schematic representation of the sequence of events that we propose to occur immediately after wounding simple epithelia. (A) Intact tissue. (B) Wounding released tension and the tissue is displaced from the wound center toward the periphery (arrows). (C) The mechanical stress leads to a burst of intracellular calcium (blue) in the cells that surround the wound. (D) The increase of intracellular calcium (blue) combined with the effects of cell and cytoskeleton deformation determine a region around the wound where a pulse of actin filaments (red) is formed. (E) The actin filaments combined with myosin motors generate an actomyosin flow (red) that travels from cell to cell from the periphery toward the wound margin. (F) When the actomyosin flow reaches the wound margin it contributes to the formation of the wound edge actomyosin cable (green).

References

    1. Amano M., Nakayama M., Kaibuchi K. 2010. Rho-kinase/ROCK: A key regulator of the cytoskeleton and cell polarity. Cytoskeleton (Hoboken). 67:545–554 10.1002/cm.20472 - DOI - PMC - PubMed
    1. Bainbridge S.P., Bownes M. 1981. Staging the metamorphosis of Drosophila melanogaster. J. Embryol. Exp. Morphol. 66:57–80 - PubMed
    1. Belacortu Y., Paricio N. 2011. Drosophila as a model of wound healing and tissue regeneration in vertebrates. Dev. Dyn. 240:2379–2404 10.1002/dvdy.22753 - DOI - PubMed
    1. Bosveld F., Bonnet I., Guirao B., Tlili S., Wang Z., Petitalot A., Marchand R., Bardet P.-L., Marcq P., Graner F., Bellaïche Y. 2012. Mechanical control of morphogenesis by Fat/Dachsous/Four-jointed planar cell polarity pathway. Science. 336:724–727 10.1126/science.1221071 - DOI - PubMed
    1. Brand A.H., Perrimon N. 1993. Targeted gene expression as a means of altering cell fates and generating dominant phenotypes. Development. 118:401–415 - PubMed

Publication types

MeSH terms

LinkOut - more resources