. 2013 Aug 7;105(15):1096-110.
doi: 10.1093/jnci/djt157. Epub 2013 Jul 22.

Cancer incidence trends among Asian American populations in the United States, 1990-2008

Affiliations

Cancer incidence trends among Asian American populations in the United States, 1990-2008

Scarlett Lin Gomez et al. J Natl Cancer Inst. .

Abstract

Background: National cancer incidence trends are presented for eight Asian American groups: Asian Indians/Pakistanis, Chinese, Filipinos, Japanese, Kampucheans, Koreans, Laotians, and Vietnamese.

Methods: Cancer incidence data from 1990 through 2008 were obtained from 13 Surveillance, Epidemiology, End Results (SEER) registries. Incidence rates from 1990 through 2008 and average percentage change were computed using SEER*Stat and Joinpoint software. The annual percentage change (APC) in incidence rates was estimated with 95% confidence intervals (95% CIs) calculated for both the rate and APC estimates. Rates for non-Hispanic whites are presented for comparison.

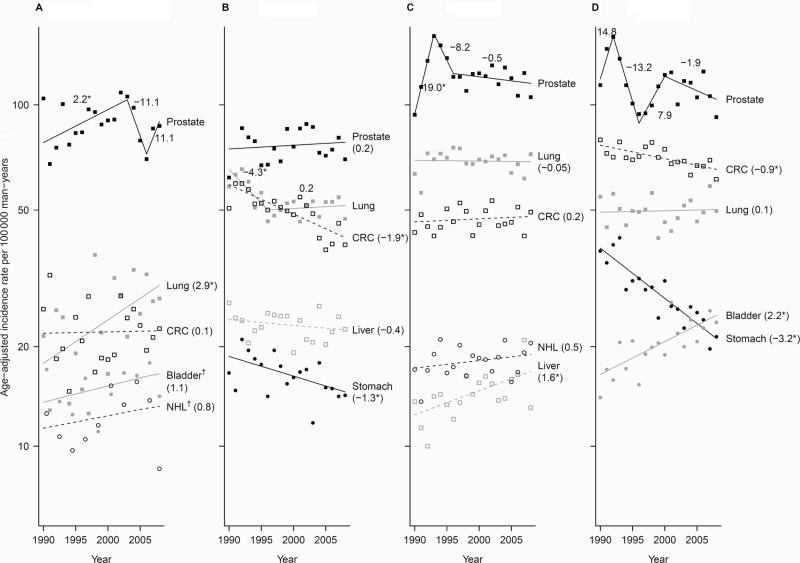
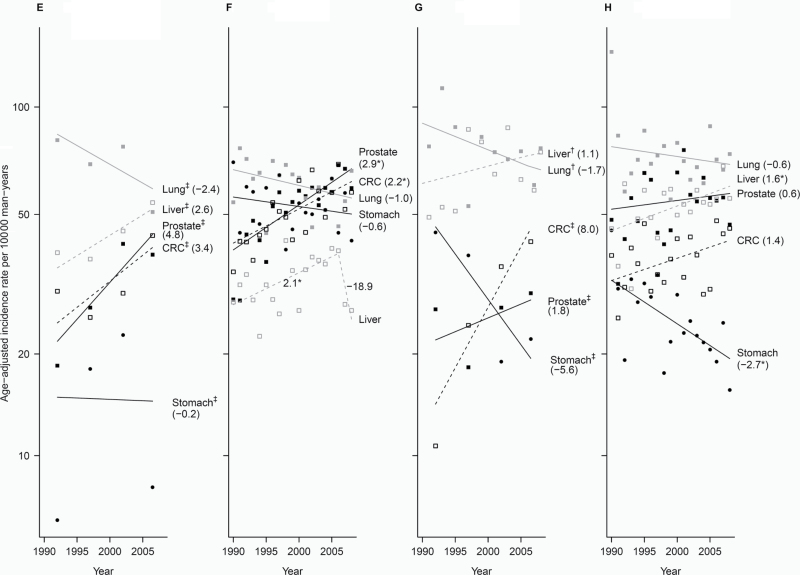
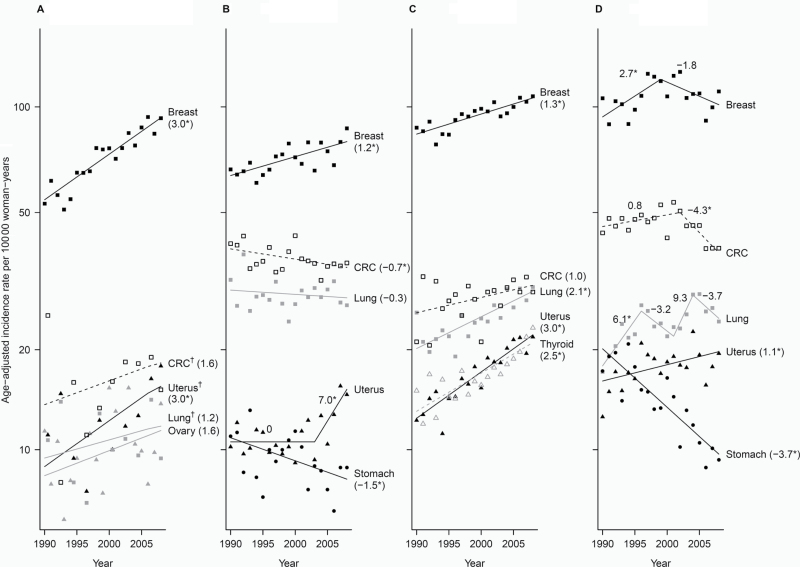
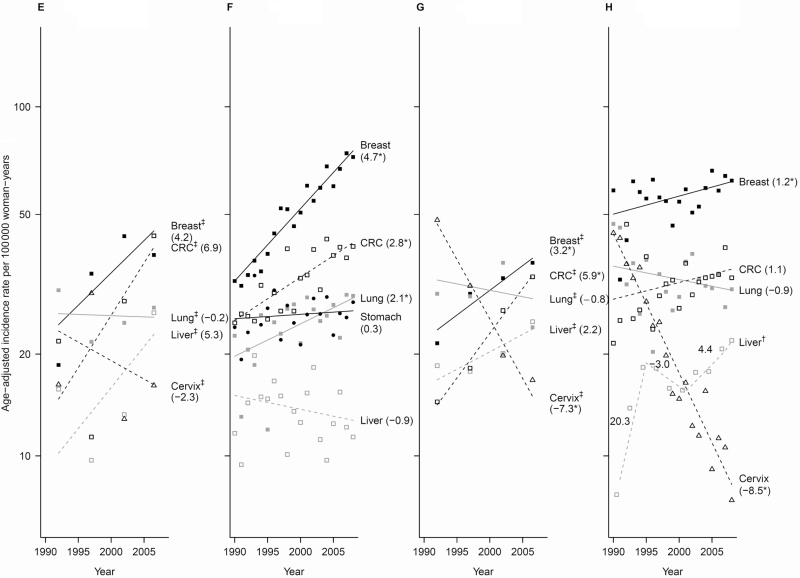
Results: Prostate cancer was the most common malignancy among most groups, followed by lung, colorectal, liver, and stomach cancers. Breast cancer was generally the most common cancer in women, followed by colorectal and lung cancers; liver, cervix, thyroid, and stomach cancers also ranked highly. Among men, increasing trends were observed for prostate (Asian Indians and Pakistanis: APC 1990-2003 = 2.2, 95% CI = 0.3 to 4.1; Filipinos: APC 1990-1994 = 19.0, 95% CI = 4.5 to 35.4; Koreans: APC 1990-2008 = 2.9, 95% CI = 1.8 to 4.0), colorectal (Koreans: APC 1990-2008 = 2.2, 95% CI = 0.9 to 3.5), and liver cancers (Filipinos: APC 1990-2008 = 1.6, 95% CI = 0.4 to 2.7; Koreans: APC 1990-2006 = 2.1, 95% CI = 0.4 to 3.7; Vietnamese: APC 1990-2008 = 1.6, 95% CI = 0.3 to 2.8), whereas lung and stomach cancers generally remained stable or decreased. Among women, increases were observed for uterine cancer (Asian Indians: APC 1990-2008 = 3.0, 95% CI = 0.3 to 5.8; Chinese: APC 2004-2008 = 7.0, 95% CI = 1.4 to 12.9; Filipina: APC 1990-2008 = 3.0, 95% CI = 2.4 to 3.7; Japanese: APC 1990-2008 = 1.1, 95% CI = 0.1 to 2.0), colorectal cancer (Koreans: APC 1990-2008 = 2.8, 95% CI = 1.7 to 3.9; Laotians: APC: 1990-2008 = 5.9, 95% CI = 4.0 to 7.7), lung cancer (Filipinas: APC 1990-2008 = 2.1, 95% CI = 1.4 to 2.8; Koreans: APC 1990-2008 = 2.1, 95% CI = 0.6 to 3.6), thyroid cancer (Filipinas: APC 1990-2008 = 2.5, 95% CI = 1.7 to 3.3), and breast cancer in most groups (APC 1990-2008 from 1.2 among Vietnamese and Chinese to 4.7 among Koreans). Decreases were observed for stomach (Chinese and Japanese), colorectal (Chinese), and cervical cancers (Laotians and Vietnamese).

Conclusions: These data fill a critical knowledge gap concerning the cancer experience of Asian American groups and highlight where increased preventive, screening, and surveillance efforts are needed-in particular, lung cancer among Filipina and Korean women and Asian Indian/Pakistani men, breast cancer among all women, and liver cancer among Vietnamese, Laotian, and Kampuchean women and Filipino, Kampuchean, and Vietnamese men.


Figures

Figure 1.
Figure 1.
Trends of incidence rates and annual percentage change for the top five cancer sites among each Asian American ethnic group, 1990–2008, men. Cancer sites are represented by the following plot symbols: prostate: solid black squares and lines; lung: solid gray squares and lines; colorectal cancer (CRC): open black squares and dashed black lines; liver: open gray squares and dashed gray lines; stomach: solid black circles and lines; bladder: solid gray circles and lines; non-Hodgkin lymphoma (NHL): open black circles and dashed black lines. Data are shown by racial/ethnic group: A) Asian Indian/Pakistani (95% confidence intervals [CIs] for the annual percentage change (APCs) are: prostate segment 1: 0.3 to 4.1, segment 2: −29.5 to 12.2, segment 2: −11.1 to 38.8; Lung: 0.4 to 5.3; CRC: −1.5 to 1.7; Bladder: −0.9 to 3.0; NHL: −2.0 to 3.7); B) Chinese (95% CIs for the APCs are: Prostate: −0.7 to 1.2; Lung segment 1: −7.8 to −0.6, segment 2: −0.8 to 1.3; CRC: −2.6 to −1.2; Liver: −1.2 to 0.4; Stomach: −2.3 to −0.3); C) Filipino (95% CIs for the APCs are: Prostate segment 1: 4.5 to 35.4, segment 2: −25.8 to 13.6, segment 3: −1.7 to 0.7; Lung: −0.7 to 0.6; CRC: −2.6 to −1.2; NHL: −0.4 to 1.4; Liver: 0.4 to 2.7); D) Japanese (95% CIs for the APCs are: Prostate segment 1: −16.9 to 58.5, segment 2: −24.8 to 0.3, segment 3: −6.7 to 24.8, segment 4: −4.9 to 1.3; CRC: −1.3 to −0.4; Lung: −0.7 to 0.9; Bladder: 1.1 to 3.2; Stomach: −4.0 to −2.4), E) Kampuchean (95% CIs for the APCs are: Lung: −9.5 to 5.3; Liver: −0.9 to 6.3; Prostate: −3.8 to 14.2; CRC: −4.1 to 11.4; Stomach: −27.0 to 36.5); F) Korean (95% CIs for the APCs are: Prostate: 1.8 to 4.0; CRC: 0.9 to 3.5; Lung: −2.3 to 0.3; Stomach: −1.9 to 0.8; Liver segment 1: 0.4 to 3.7, segment 2: −44.7 to 19.1); G) Laotian (95% CIs for the APCs are: Liver: −1.9 to 4.2; Lung: −3.9 to 0.6; CRC: −0.4 to 17.1; Prostate: −6.8 to 11.1; Stomach: −13.9 to 3.5); H) Vietnamese (95% CIs for the APCs are: Lung: −2.1 to 0.9; Liver: 0.3 to 2.8; Prostate: −1.2 to 2.4; CRC: −0.1 to 3.0; Stomach: −4.4 to −1.1). An * indicates the 95% confidence interval for the APC does not include zero. Joinpoint and observed rates are based on 2-year groups (1990–1991, 1992–1993, 1994–1995, 1996–1997, …, 2008). Joinpoint and observed rates are based on 5-year groups (1990–1994, 1995–1999, 2000–2004, 2005–2008). Bladder = urinary bladder; CRC = colon and rectum; Liver = liver and intrahepatic bile duct; Lung = lung and bronchus; NHL = non-Hodgkin lymphoma.
Figure 1.
Figure 1.
Trends of incidence rates and annual percentage change for the top five cancer sites among each Asian American ethnic group, 1990–2008, men. Cancer sites are represented by the following plot symbols: prostate: solid black squares and lines; lung: solid gray squares and lines; colorectal cancer (CRC): open black squares and dashed black lines; liver: open gray squares and dashed gray lines; stomach: solid black circles and lines; bladder: solid gray circles and lines; non-Hodgkin lymphoma (NHL): open black circles and dashed black lines. Data are shown by racial/ethnic group: A) Asian Indian/Pakistani (95% confidence intervals [CIs] for the annual percentage change (APCs) are: prostate segment 1: 0.3 to 4.1, segment 2: −29.5 to 12.2, segment 2: −11.1 to 38.8; Lung: 0.4 to 5.3; CRC: −1.5 to 1.7; Bladder: −0.9 to 3.0; NHL: −2.0 to 3.7); B) Chinese (95% CIs for the APCs are: Prostate: −0.7 to 1.2; Lung segment 1: −7.8 to −0.6, segment 2: −0.8 to 1.3; CRC: −2.6 to −1.2; Liver: −1.2 to 0.4; Stomach: −2.3 to −0.3); C) Filipino (95% CIs for the APCs are: Prostate segment 1: 4.5 to 35.4, segment 2: −25.8 to 13.6, segment 3: −1.7 to 0.7; Lung: −0.7 to 0.6; CRC: −2.6 to −1.2; NHL: −0.4 to 1.4; Liver: 0.4 to 2.7); D) Japanese (95% CIs for the APCs are: Prostate segment 1: −16.9 to 58.5, segment 2: −24.8 to 0.3, segment 3: −6.7 to 24.8, segment 4: −4.9 to 1.3; CRC: −1.3 to −0.4; Lung: −0.7 to 0.9; Bladder: 1.1 to 3.2; Stomach: −4.0 to −2.4), E) Kampuchean (95% CIs for the APCs are: Lung: −9.5 to 5.3; Liver: −0.9 to 6.3; Prostate: −3.8 to 14.2; CRC: −4.1 to 11.4; Stomach: −27.0 to 36.5); F) Korean (95% CIs for the APCs are: Prostate: 1.8 to 4.0; CRC: 0.9 to 3.5; Lung: −2.3 to 0.3; Stomach: −1.9 to 0.8; Liver segment 1: 0.4 to 3.7, segment 2: −44.7 to 19.1); G) Laotian (95% CIs for the APCs are: Liver: −1.9 to 4.2; Lung: −3.9 to 0.6; CRC: −0.4 to 17.1; Prostate: −6.8 to 11.1; Stomach: −13.9 to 3.5); H) Vietnamese (95% CIs for the APCs are: Lung: −2.1 to 0.9; Liver: 0.3 to 2.8; Prostate: −1.2 to 2.4; CRC: −0.1 to 3.0; Stomach: −4.4 to −1.1). An * indicates the 95% confidence interval for the APC does not include zero. Joinpoint and observed rates are based on 2-year groups (1990–1991, 1992–1993, 1994–1995, 1996–1997, …, 2008). Joinpoint and observed rates are based on 5-year groups (1990–1994, 1995–1999, 2000–2004, 2005–2008). Bladder = urinary bladder; CRC = colon and rectum; Liver = liver and intrahepatic bile duct; Lung = lung and bronchus; NHL = non-Hodgkin lymphoma.
Figure 2.
Figure 2.
Trends of incidence rates and annual percentage change for the top five cancer sites among each Asian American ethnic group, 1990–2008, women. Cancer sites are represented by the following plot symbols: breast: solid black squares and lines; lung: solid gray squares and lines; colorectal cancer (CRC): open black squares and dashed black lines; liver: open gray squares and dashed gray lines; stomach: solid black circles and lines; uterus: solid black triangles and lines; ovary: solid gray triangles and lines; cervix: open black triangles and dashed black lines; thyroid: open gray triangles and dashed gray lines. Data above are shown by racial/ethnic group: A) Asian Indian/Pakistani (95% confidence intervals [CIs] for the annual percentage change (APCs) are: Breast: 2.4 to 3.6; CRC: −1.6 to 4.8; Uterus: 0.3 to 5.8; Lung: −2.0 to 4.5; Ovary: −1.2 to 4.5); B) Chinese (95% CIs for the APCs are: Breast: 0.6 to 1.9; CRC: −1.3 to −0.02; Lung: −1.1 to 0.5; Uterus segment 1: −1.7 to 1.7, segment 2: 1.4 to 12.9; Stomach: −2.8 to −0.2), C) Filipina (95% CIs for the APCs are: Breast: 0.9 to 1.7; CRC: −0.03 to 2.0; Lung: 1.4 to 2.8; Uterus: 2.4 to 3.7; Thyroid: 1.7 to 3.3); D) Japanese (95% CIs for the APCs are: Breast segment 1: 0.2 to 5.4, segment 2: −4.1 to 0.6; CRC segment 1: −0.4 to 1.9, segment 2: −7.1 to −1.3; Lung segment 1: 2.5 to 9.8, segment 2: −8.2 to 2.1, segment 3: −7.6 to 29.2, segment 4: −8.2 to 1.1; Uterus: 0.1 to 2.0; Stomach: −4.8 to −2.6), E) Kampuchean (95% CIs for the APCs are: Breast: −5.9 to 15.4; CRC: −7.8 to 23.9; Lung: −6.1 to 6.2; Liver: −9.2 to 22.2; Cervix: −18.3 to 16.8), F) Korean (95% CIs for the APCs are: Breast: 4.0 to 5.4; CRC: 1.7 to 3.9; Lung: 0.6 to 3.6; Stomach: −0.8 to 1.4; Liver: −2.6 to 0.9, G) Laotian (95% CIs for the APCs are: Breast: 0.04 to 6.4; CRC: 4.0 to 7.7; Lung: −10.1 to 9.5; Liver: −1.3 to 6.0; Cervix: −10.4 to −4.1), H) Vietnamese (95% CIs for the APCs are: Breast: 0.1 to 2.2; CRC: −0.4 to 2.5; Lung: −2.3 to 0.6; Liver segment 1: −9.2 to 59.5, segment 2: −16.5 to 12.7, segment 3: −0.2 to 9.2; Cervix: −9.5 to −7.4). An * indicates the 95% confidence interval for the APC does not include zero. Joinpoint and observed rates are based on 2-year groups (1990–1991, 1992–1993, 1994–1995, 1996–1997, …, 2008). Joinpoint and observed rates are based on 5-year groups (1990–1994, 1995–1999, 2000–2004, 2005–2008). Cervix = cervix uteri; CRC = colon and rectum; Liver = liver and intrahepatic bile duct; Lung = lung and bronchus; Uterus = corpus and uterus.
Figure 2.
Figure 2.
Trends of incidence rates and annual percentage change for the top five cancer sites among each Asian American ethnic group, 1990–2008, women. Cancer sites are represented by the following plot symbols: breast: solid black squares and lines; lung: solid gray squares and lines; colorectal cancer (CRC): open black squares and dashed black lines; liver: open gray squares and dashed gray lines; stomach: solid black circles and lines; uterus: solid black triangles and lines; ovary: solid gray triangles and lines; cervix: open black triangles and dashed black lines; thyroid: open gray triangles and dashed gray lines. Data above are shown by racial/ethnic group: A) Asian Indian/Pakistani (95% confidence intervals [CIs] for the annual percentage change (APCs) are: Breast: 2.4 to 3.6; CRC: −1.6 to 4.8; Uterus: 0.3 to 5.8; Lung: −2.0 to 4.5; Ovary: −1.2 to 4.5); B) Chinese (95% CIs for the APCs are: Breast: 0.6 to 1.9; CRC: −1.3 to −0.02; Lung: −1.1 to 0.5; Uterus segment 1: −1.7 to 1.7, segment 2: 1.4 to 12.9; Stomach: −2.8 to −0.2), C) Filipina (95% CIs for the APCs are: Breast: 0.9 to 1.7; CRC: −0.03 to 2.0; Lung: 1.4 to 2.8; Uterus: 2.4 to 3.7; Thyroid: 1.7 to 3.3); D) Japanese (95% CIs for the APCs are: Breast segment 1: 0.2 to 5.4, segment 2: −4.1 to 0.6; CRC segment 1: −0.4 to 1.9, segment 2: −7.1 to −1.3; Lung segment 1: 2.5 to 9.8, segment 2: −8.2 to 2.1, segment 3: −7.6 to 29.2, segment 4: −8.2 to 1.1; Uterus: 0.1 to 2.0; Stomach: −4.8 to −2.6), E) Kampuchean (95% CIs for the APCs are: Breast: −5.9 to 15.4; CRC: −7.8 to 23.9; Lung: −6.1 to 6.2; Liver: −9.2 to 22.2; Cervix: −18.3 to 16.8), F) Korean (95% CIs for the APCs are: Breast: 4.0 to 5.4; CRC: 1.7 to 3.9; Lung: 0.6 to 3.6; Stomach: −0.8 to 1.4; Liver: −2.6 to 0.9, G) Laotian (95% CIs for the APCs are: Breast: 0.04 to 6.4; CRC: 4.0 to 7.7; Lung: −10.1 to 9.5; Liver: −1.3 to 6.0; Cervix: −10.4 to −4.1), H) Vietnamese (95% CIs for the APCs are: Breast: 0.1 to 2.2; CRC: −0.4 to 2.5; Lung: −2.3 to 0.6; Liver segment 1: −9.2 to 59.5, segment 2: −16.5 to 12.7, segment 3: −0.2 to 9.2; Cervix: −9.5 to −7.4). An * indicates the 95% confidence interval for the APC does not include zero. Joinpoint and observed rates are based on 2-year groups (1990–1991, 1992–1993, 1994–1995, 1996–1997, …, 2008). Joinpoint and observed rates are based on 5-year groups (1990–1994, 1995–1999, 2000–2004, 2005–2008). Cervix = cervix uteri; CRC = colon and rectum; Liver = liver and intrahepatic bile duct; Lung = lung and bronchus; Uterus = corpus and uterus.

Comment in

Similar articles

Cited by

References

    1. Asian American Center for Advancing Justice A Community of Contrasts–Asian Americans in the United States: 2011. Washington, DC: Asian American Center for Advancing Justice; 2011:1–68
    1. US Census Bureau 2010 Census Shows Asians are Fastest-Growing Race Group. http://2010.census.gov/news/releases/operations/cb12-cn22.html Accessed September 1, 2012
    1. American Community Survey 2007–2009 3-Year Estimates, S0201: Selected Population Profile in the United States. http://factfinder2.census.gov/faces/tableservices/jsf/pages/productview.... Accessed June 17, 2013.
    1. California Health Interview Survey CHIS 2007 Adult Public Use File. Los Angeles, CA: UCLA Center for Health Policy Research; 2009.
    1. Tseng W, McDonnell DD, Ho W, Lee C, Wong S. Ethnic Health Assessment for Asian Americans, Native Hawaiians and Pacific Islanders in California. Prepared for the California Program on Access to Care (CPAC). Berkeley, CA: UC Berkeley School of Public Health; 2010.

Publication types

MeSH terms