

Activity and distribution of intracellular carbonic anhydrase II and their effects on the transport activity of anion exchanger AE1/SLC4A1
- PMID: 23878365
- PMCID: PMC3810803
- DOI: 10.1113/jphysiol.2013.251181
Activity and distribution of intracellular carbonic anhydrase II and their effects on the transport activity of anion exchanger AE1/SLC4A1
Abstract
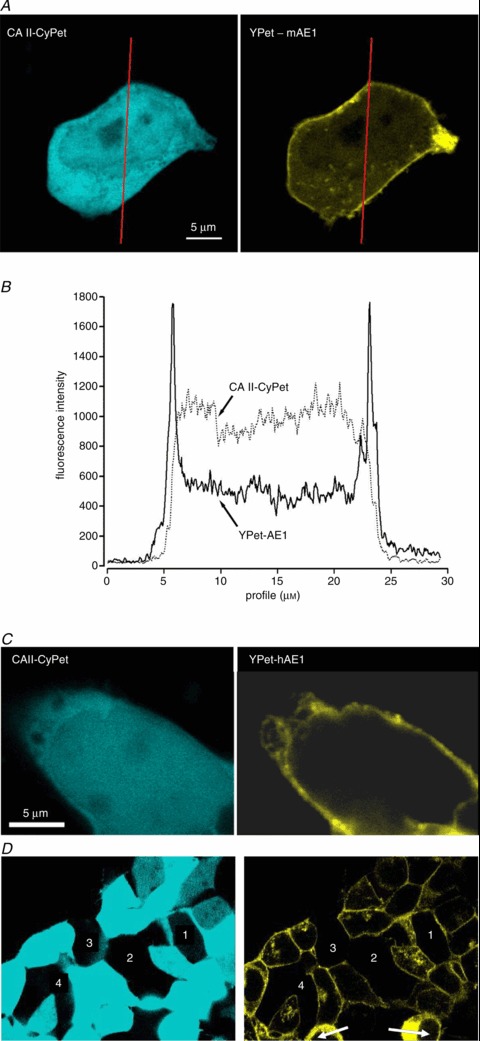
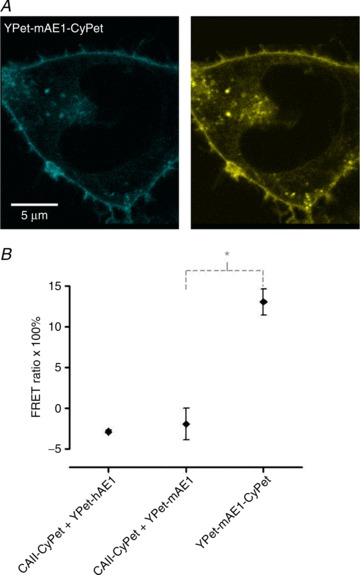
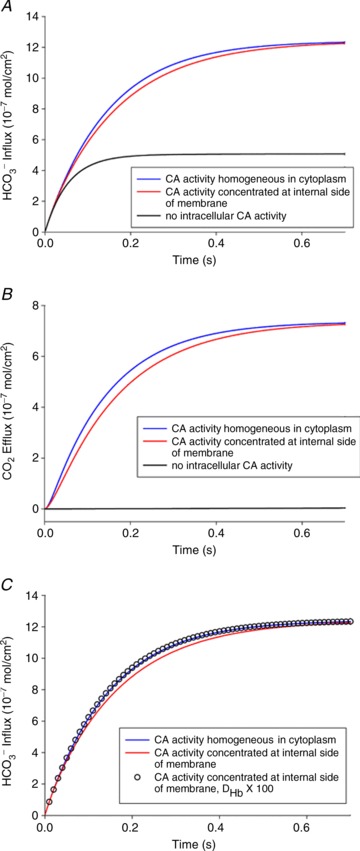
We have investigated the previously published 'metabolon hypothesis' postulating that a close association of the anion exchanger 1 (AE1) and cytosolic carbonic anhydrase II (CAII) exists that greatly increases the transport activity of AE1. We study whether there is a physical association of and direct functional interaction between CAII and AE1 in the native human red cell and in tsA201 cells coexpressing heterologous fluorescent fusion proteins CAII-CyPet and YPet-AE1. In these doubly transfected tsA201 cells, YPet-AE1 is clearly associated with the cell membrane, whereas CAII-CyPet is homogeneously distributed throughout the cell in a cytoplasmic pattern. Förster resonance energy transfer measurements fail to detect close proximity of YPet-AE1 and CAII-CyPet. The absence of an association of AE1 and CAII is supported by immunoprecipitation experiments using Flag-antibody against Flag-tagged AE1 expressed in tsA201 cells, which does not co-precipitate native CAII but co-precipitates coexpressed ankyrin. Both the CAII and the AE1 fusion proteins are fully functional in tsA201 cells as judged by CA activity and by cellular HCO3(-) permeability (P(HCO3(-))) sensitive to inhibition by 4,4-Diisothiocyano-2,2-stilbenedisulfonic acid. Expression of the non-catalytic CAII mutant V143Y leads to a drastic reduction of endogenous CAII and to a corresponding reduction of total intracellular CA activity. Overexpression of an N-terminally truncated CAII lacking the proposed site of interaction with the C-terminal cytoplasmic tail of AE1 substantially increases intracellular CA activity, as does overexpression of wild-type CAII. These variously co-transfected tsA201 cells exhibit a positive correlation between cellular P(HCO3(-)) and intracellular CA activity. The relationship reflects that expected from changes in cytoplasmic CA activity improving substrate supply to or removal from AE1, without requirement for a CAII-AE1 metabolon involving physical interaction. A functional contribution of the hypothesized CAII-AE1 metabolon to erythroid AE1-mediated HCO3(-) transport was further tested in normal red cells and red cells from CAII-deficient patients that retain substantial CA activity associated with the erythroid CAI protein lacking the proposed AE1-binding sequence. Erythroid P(HCO3(-)) was indistinguishable in these two cell types, providing no support for the proposed functional importance of the physical interaction of CAII and AE1. A theoretical model predicts that homogeneous cytoplasmic distribution of CAII is more favourable for cellular transport of HCO3(-) and CO2 than is association of CAII with the cytoplasmic surface of the plasma membrane. This is due to the fact that the relatively slow intracellular transport of H(+) makes it most efficient to place the CA in the vicinity of the haemoglobin molecules, which are homogeneously distributed over the cytoplasm.
Figures
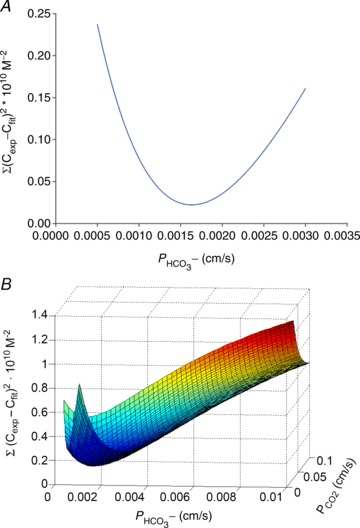
 Illustration of the fitting procedure used to determine
  at a given
  of 0.12 cm s−1 (A) or both
  and
and  (B). The sum of squares of deviations between experimental concentrations of C18O16O and their counterparts from the calculated C18O16O decay curve as obtained with the fitted values of
  /
/ are plotted vs. the value of
  (A) or vs. both the values of
  and
and  (B).
(B).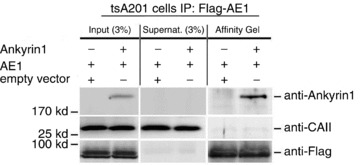
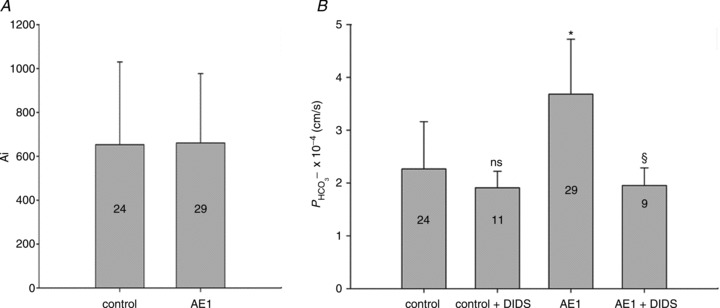
 measured in untreated tsA201 cells (control) and in tsA201 cells expressing YPet-mAE1 (AE1), in the absence or presence of DIDS (10−5
 of control cells, but inhibited the AE1-associated increase in
  . ns, P > 0.05, *P < 0.02, §P < 0.02. Number of measurements are inside the columns. Error bars represent SD values.
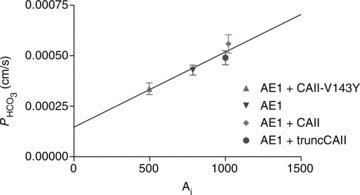
 are linearly related to intracellular CA activity. Correlation coefficient r= 0.90. Bars represent SE values. Number of determinations n= 17, 18, 17 and 33 (from left to right). All permeabilities under expression of the various CAII's are statistically significantly different from the mean control
  value (▾, transfection with YPet-mAE1 only). P values between <0.01 and <0.05.
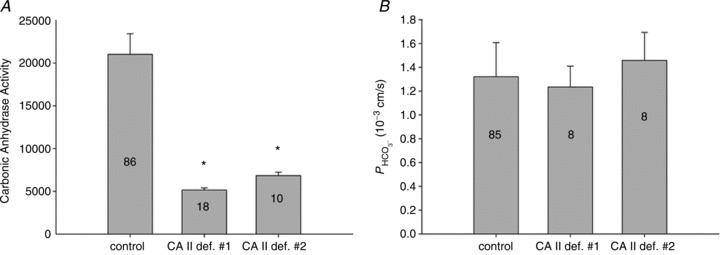
 is identical regardless of whether CAII is present or completely absent. Numbers of measurements are given inside each column. Bars represent SD.
References
-
- Alvarez BV, Loiselle FB, Supuran CT, Schwartz GJ, Casey JR. Direct extracellular interaction between carbonic anhydrase IV and the human NBC1 sodium/bicarbonate co-transporter. Biochemistry. 2003;28:12321–12329. - PubMed
-
-
Becker HM, Deitmer JW. Carbonic anhydrase II increases the activity of the human electrogenic Na+
 cotransporter. J Biol Chem. 2007;282:13508–13521.
-
PubMed
cotransporter. J Biol Chem. 2007;282:13508–13521.
-
PubMed
-
Becker HM, Deitmer JW. Carbonic anhydrase II increases the activity of the human electrogenic Na+
-
- Becker HM, Deitmer JW. Nonenzymatic proton handling by carbonic anhydrase II during H+-lactate cotransport via monocarboxylate transporter 1. J Biol Chem. 2008;283:21655–21667. - PubMed
-
- Bennett V, Stenbuck PJ. The membrane attachment protein for spectrin is associated with band 3 in human erythrocyte membranes. Nature. 1979;280:468–473. - PubMed
Publication types
MeSH terms
Substances
Grants and funding
LinkOut - more resources
Full Text Sources
Other Literature Sources
Molecular Biology Databases
Miscellaneous