. 2013 Jul 16:2:e00299.
doi: 10.7554/eLife.00299.

Integrative genomic analysis of the human immune response to influenza vaccination

Affiliations

Integrative genomic analysis of the human immune response to influenza vaccination

Luis M Franco et al. Elife. .

Erratum in

Abstract

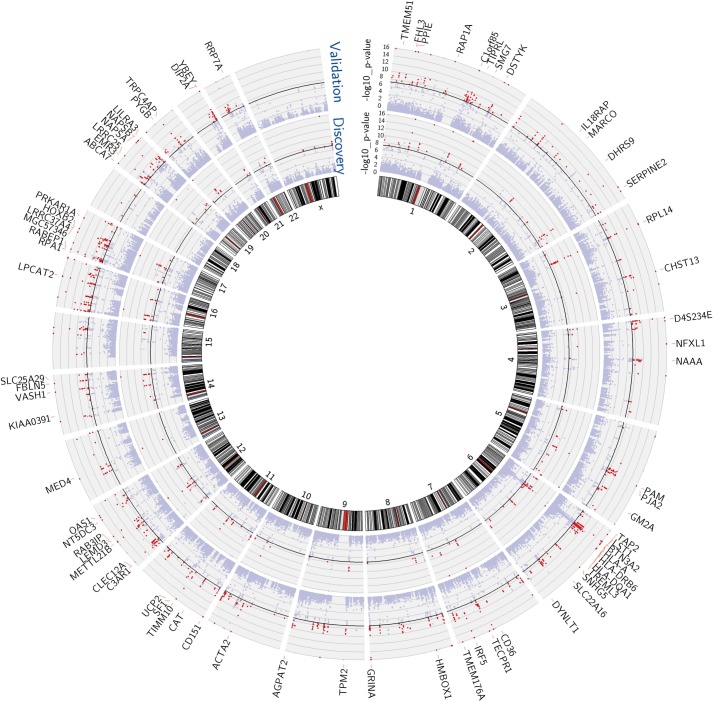
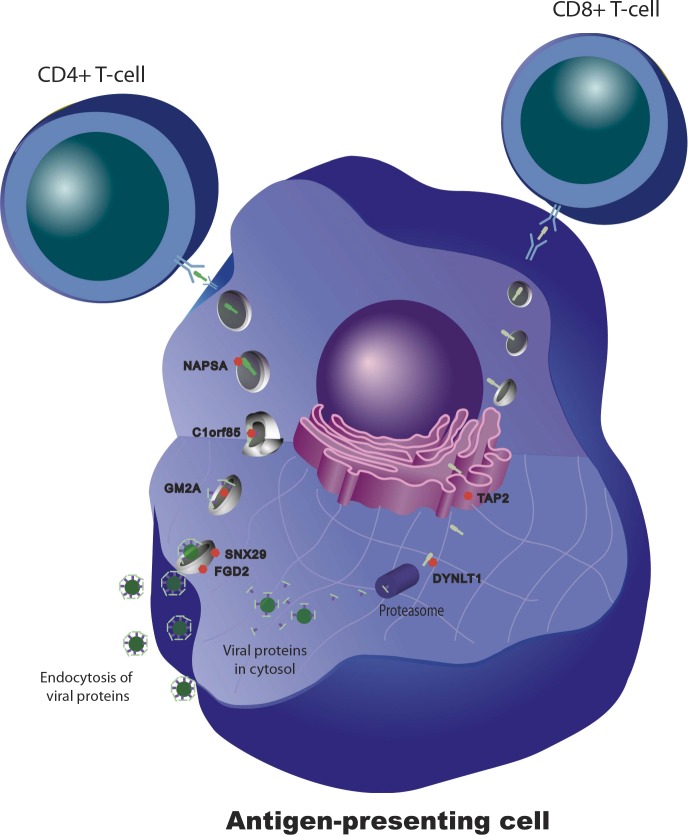
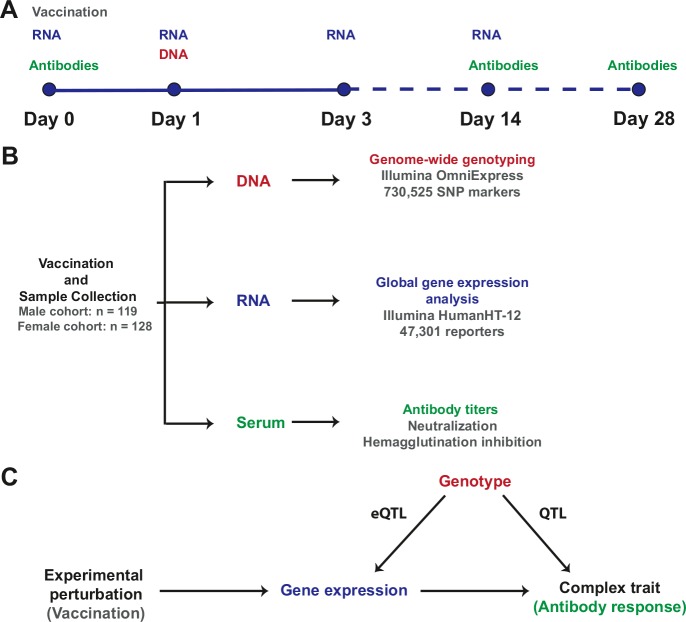
Identification of the host genetic factors that contribute to variation in vaccine responsiveness may uncover important mechanisms affecting vaccine efficacy. We carried out an integrative, longitudinal study combining genetic, transcriptional, and immunologic data in humans given seasonal influenza vaccine. We identified 20 genes exhibiting a transcriptional response to vaccination, significant genotype effects on gene expression, and correlation between the transcriptional and antibody responses. The results show that variation at the level of genes involved in membrane trafficking and antigen processing significantly influences the human response to influenza vaccination. More broadly, we demonstrate that an integrative study design is an efficient alternative to existing methods for the identification of genes involved in complex traits. DOI:http://dx.doi.org/10.7554/eLife.00299.001.

Keywords: Complex-trait genetics; Human; Human genetics; Integrative biology; Systems biology; Vaccines; eQTL.


Conflict of interest statement

The authors declare that no competing interests exist.

Figures

Figure 1.
Figure 1.. Multiple genes show both a transcriptional response to the vaccine and evidence of genetic regulation of gene expression (cis-acting eQTL) in both cohorts.
Manhattan plots of the genotype-expression—log10 p-values across the genome for the discovery (inner circle) and validation (outer circle) cohorts. Each dot represents a SNP-transcript pair. Red dots indicate SNP-transcript pairs for which there is evidence of significant genotype-expression association (genotype p<5 × 10⁻⁸) and evidence of a transcriptional response to the vaccine (day effect p<0.05). The 78 genes that showed both properties in the two cohorts are shown in the outer margin. DOI: http://dx.doi.org/10.7554/eLife.00299.003
Figure 2.
Figure 2.. At some loci, the magnitude of the genetic effect changes after the experimental perturbation.
(A) A specific example of this phenomenon: local Manhattan plots for the gene NECAB2 before and on day 3 after vaccination in each of the two cohorts, showing an increase in the magnitude of the genotype effect (R2g) after the experimental perturbation. (B) An increase in R2g after the experimental perturbation is a general feature of the SNP-transcript pairs that show a strong cis-eQTLs and a transcriptional response to vaccination (left). The within-genotype variance is unchanged (MSE, center), while the strength of the genotype effect on expression (slope of the additive association; β, right) increases, suggesting that the latter is the main driver for the observed increase in the genetic effect after vaccination. DOI: http://dx.doi.org/10.7554/eLife.00299.004
Figure 3.
Figure 3.. Content analysis shows enrichment for genes involved in membrane trafficking, antigen processing, and antigen presentation.
Barplots show categories with significant overrepresentation in the list of 98 genes with a strong cis-eQTL and a response to vaccination expressed as either a transcriptional response or a change in the genetic effect in both cohorts. The negative log(p-value) is plotted on the x-axis. DOI: http://dx.doi.org/10.7554/eLife.00299.005
Figure 4.
Figure 4.. Gene expression at specific loci correlates with the antibody response to vaccination.
(A) Examples of positive (DYNLT1) and negative (ANKRD33) correlation between gene expression on day 1 and the magnitude of the antibody response to the vaccine. Data points and regression lines in the scatterplots display the results for the discovery (blue) and validation (magenta) cohorts. (B) A total of 301 genes showed evidence of significant correlation between gene expression and the antibody response to the vaccine in both cohorts. Of these, 281 showed evidence of positive correlation and 83 of negative correlation. Each individual is represented by a column in the heatmaps. The top heatmaps display the magnitude of the antibody response (titer response index). The bottom heatmaps display the deviations around the expression mean for each gene. Individual gene identifiers and correlation coefficients are presented in the Interactive Results Tool. DOI: http://dx.doi.org/10.7554/eLife.00299.006
Figure 5.
Figure 5.. Genetic variation in intracellular antigen transport and processing influences the human immune response to influenza vaccination.
20 genes show evidence of a transcriptional response to vaccination, significant genotype effects on gene expression, and correlation between the transcriptional and antibody responses. Remarkably, seven of these are involved in intracellular antigen transport, antigen processing, and antigen presentation. DOI: http://dx.doi.org/10.7554/eLife.00299.007
Figure 6.
Figure 6.. SNPs at the 20 loci identified show evidence of association with the antibody response to the vaccine.
137 SNP-transcript pairs with evidence of a strong cis-eQTL, a dynamic response to the vaccine (a change in transcript abundance or in the magnitude of the genetic effect), and correlation between the transcriptional and antibody responses were selected (result SNPs, in red). The empirical quantile-quantile plot of the result SNPs shows significant deviation from the empirical distribution of the entire data set (background SNPs, in blue). DOI: http://dx.doi.org/10.7554/eLife.00299.008
Figure 7.
Figure 7.. The study design permits causal and reactive model analyses.
(A) Three models were evaluated, each showing a candidate hypothesis for the three-way association between genotype (G), expression (E) and trait (T). In the independent model, expression and trait each associate with genotype but are not themselves directly related. In the causal model, expression mediates the association between genotype and trait. In the reactive model, genotype and expression relate through the trait, so that gene expression changes are a downstream response to the trait. (B) p-values for independent-versus-reactive and independent-versus-causal hypothesis tests. Each point shows the result for one SNP-transcript pair. Points to the right of the solid vertical line are significant (p<0.05) for the reactive hypothesis and points above the solid horizontal line are significant for the causal hypothesis. The dashed line shows a p=0.1 threshold. (C) Power for rejection of the independent hypothesis. Non-independent data were simulated with effect sizes and variances similar to those in the enrichment set (the set of SNP-transcript pairs that were found to be significant in our study). The curve shows the proportion of cases in which the simulated data rejected the independent (null) hypothesis. The dotted line indicates the combined sample size in our study. DOI: http://dx.doi.org/10.7554/eLife.00299.009
Figure 8.
Figure 8.. Study design and integrative analysis scheme.
(A) Individuals were immunized on day 0 and peripheral blood RNA samples were obtained on days 0, 1, 3, and 14. Antibody titers were measured on pre-immune sera and on days 14 and 28. Genotyping was carried out on a peripheral blood genomic DNA sample obtained on day 1. Identical sample collection schemes were used, 1 year apart, for the discovery (males) and validation (females) cohorts. (B) Sample sizes and data generation platforms. (C) Integrative analysis involved identification of loci that exhibit a transcriptional response to vaccination, evidence of genetic regulation of expression (constitutive eQTL), evidence of correlation between gene expression and the antibody response, and evidence of correlation between genotype and the antibody response (QTL). Because transcript abundance was measured serially, we were able to evaluate changes in the magnitude of the genetic effect on expression at different time points following vaccination. In addition, the study design permitted QTL analysis conditional on gene expression, which led to the identification of loci whose genetic effects on the antibody response are causally linked through the eQTL. DOI: http://dx.doi.org/10.7554/eLife.00299.010
Figure 9.
Figure 9.. Study samples cluster with the HapMap CEU population.
Pairwise identity-by-descent metrics were estimated based on genotype data from our two study samples and six HapMap populations. Multidimensional scaling analysis was performed on the resulting pairwise distances. Components 1–3 of this analysis are plotted for the male (top) and female (bottom) cohorts, and the comparison populations. As expected, the study samples cluster with the HapMap CEU population. 12 outliers were identified in each cohort and were removed prior to analysis. DOI: http://dx.doi.org/10.7554/eLife.00299.011
Figure 10.
Figure 10.. Genetic and transcriptional analysis on a prospective cohort.
The figure displays hypothetical results for a single SNP-transcript pair. For any such pair, one may observe changes in transcript abundance at different time points after the experimental perturbation (lower box plots). In addition, gene expression at each time point may be different for different genotypes when there is evidence of an eQTL (upper box plots). Finally, the slope of the expression-genotype association (β), as well as the proportion of the variance in expression explained by genotype (R2g), may vary across time points. DOI: http://dx.doi.org/10.7554/eLife.00299.012

Comment in

References

    1. Amit I, Garber M, Chevrier N, Leite AP, Donner Y, Eisenhaure T, Guttman M, Grenier JK, Li W, Zuk O, Schubert LA, Birditt B, Shay T, Goren A, Zhang X, Smith Z, Deering R, McDonald RC, Cabili M, Bernstein BE, Rinn JL, Meissner A, Root DE, Hacohen N, Regev A. Unbiased reconstruction of a mammalian transcriptional network mediating pathogen responses. Science. 2009;326:257–263. doi: 10.1126/science.1179050. - DOI - PMC - PubMed
    1. Barreiro LB, Tailleux L, Pai AA, Gicquel B, Marioni JC, Gilad Y. Deciphering the genetic architecture of variation in the immune response to Mycobacterium tuberculosis infection. Proceedings of the National Academy of Sciences of the United States of America. 2012;109:1204–1209. doi: 10.1073/pnas.1115761109. - DOI - PMC - PubMed
    1. Bucasas KL, Franco LM, Shaw CA, Bray MS, Wells JM, Niño D, Arden N, Quarles JM, Couch RB, Belmont JW. Early patterns of gene expression correlate with the humoral immune response to influenza vaccination in humans. Journal of Infectious Diseases. 2011;203:921–929. doi: 10.1093/infdis/jiq156. - DOI - PMC - PubMed
    1. Bullaughey K, Chavarria CI, Coop G, Gilad Y. Expression quantitative trait loci detected in cell lines are often present in primary tissues. Human Molecular Genetics. 2009;18:4296–4303. doi: 10.1093/hmg/ddp382. - DOI - PMC - PubMed
    1. Cookson W, Liang L, Abecasis G, Moffatt M, Lathrop M. Mapping complex disease traits with global gene expression. Nature Reviews. Genetics. 2009;10:184–194. doi: 10.1038/nrg2537. - DOI - PMC - PubMed

Publication types

MeSH terms