. 2013 Dec 15;22(24):3261-70.
doi: 10.1089/scd.2013.0242. Epub 2013 Aug 24.

Homologous lactoferrin triggers mobilization of the myelocytic lineage of bone marrow in experimental mice

Affiliations

Homologous lactoferrin triggers mobilization of the myelocytic lineage of bone marrow in experimental mice

Michał Zimecki et al. Stem Cells Dev. .

Abstract

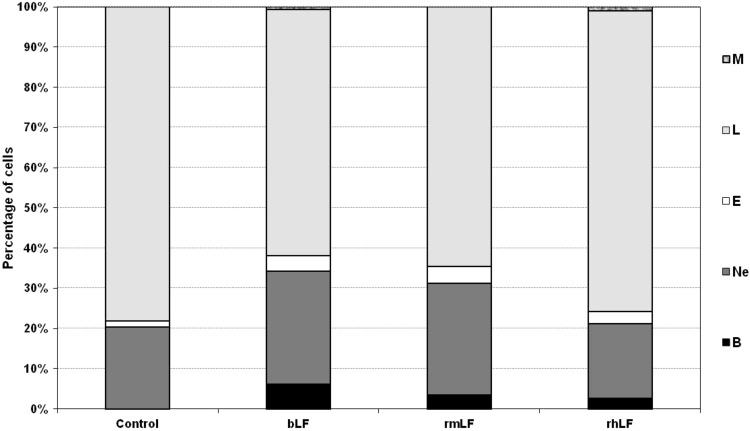
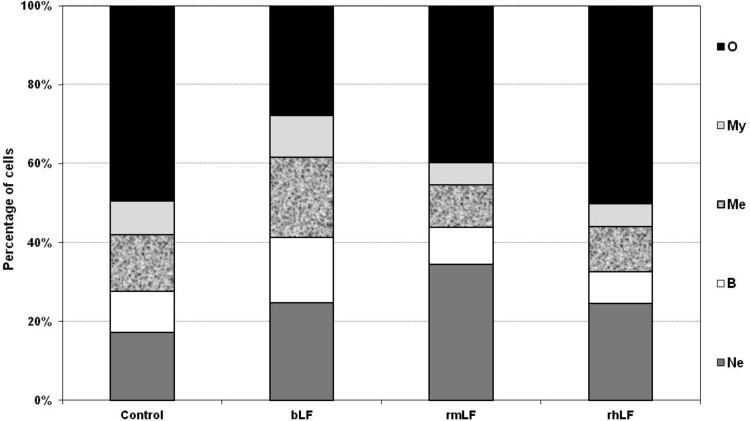
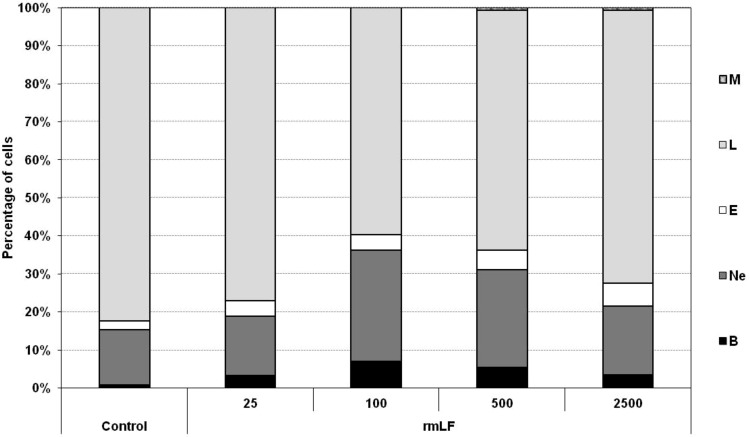
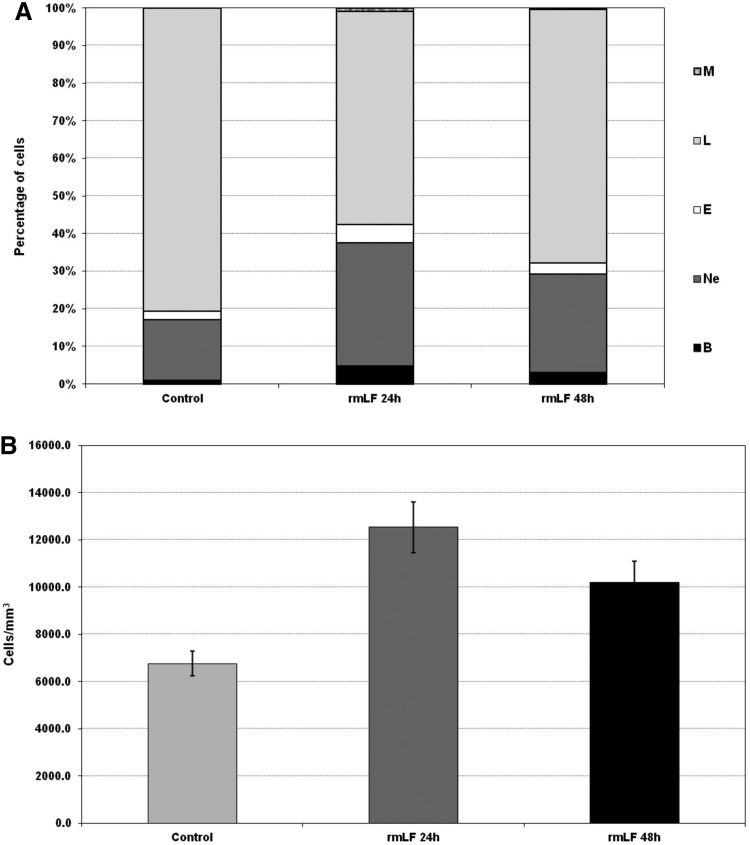
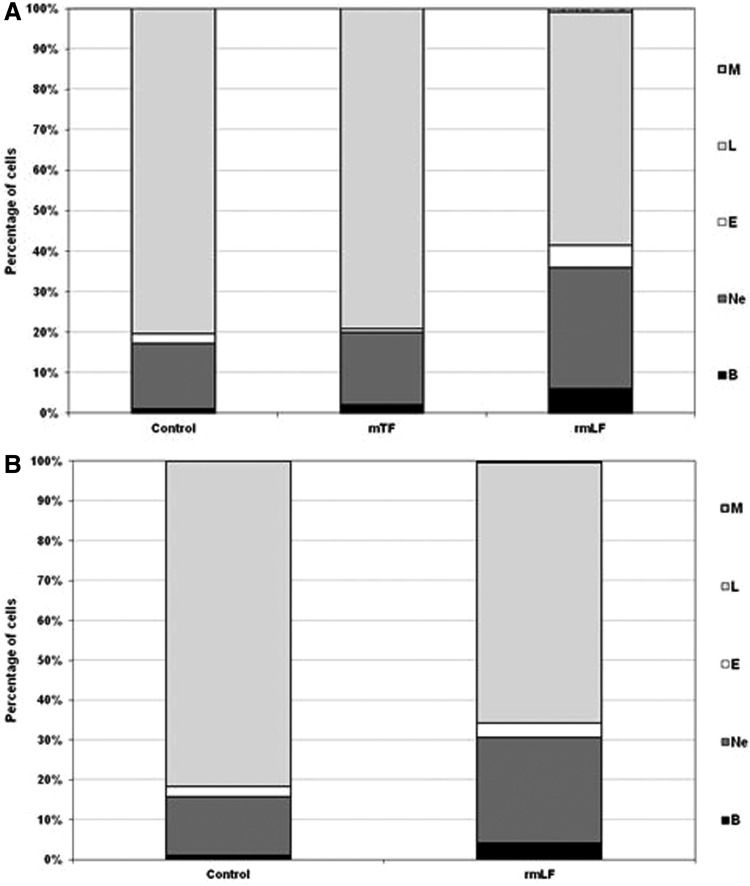
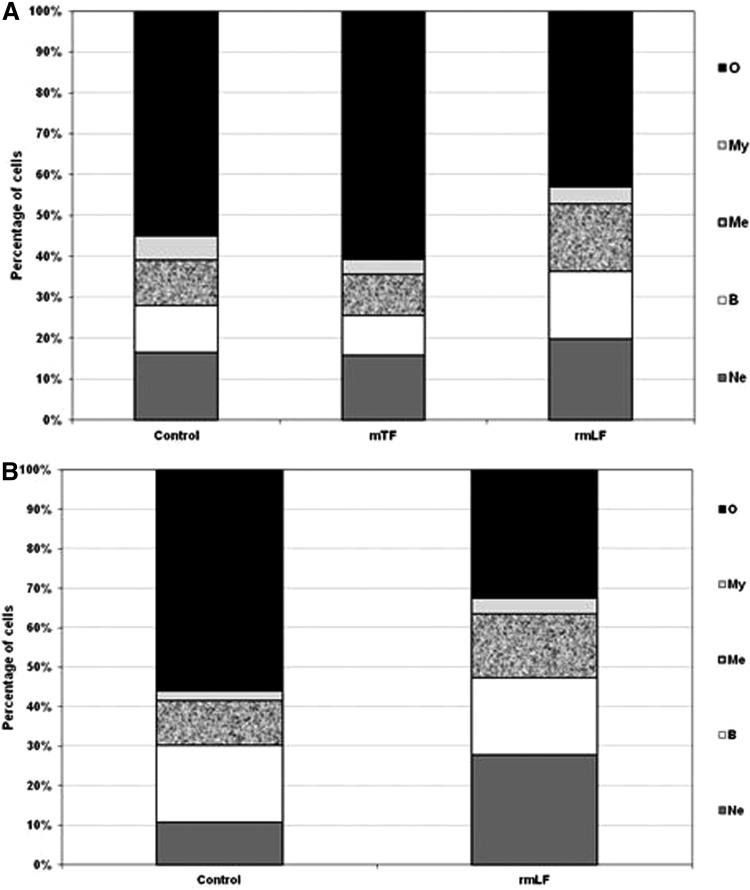
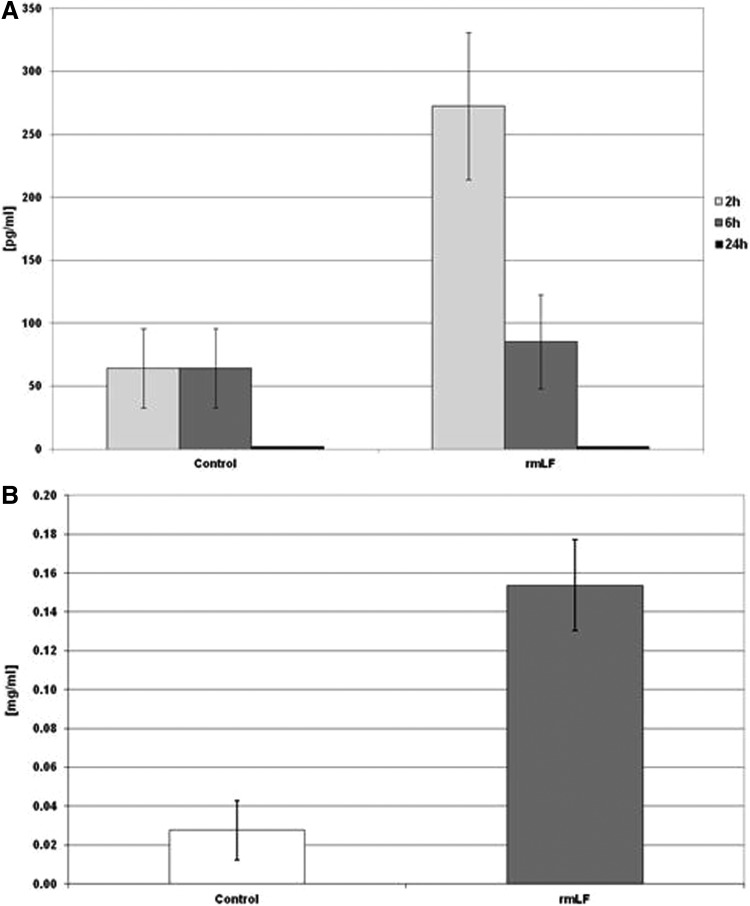
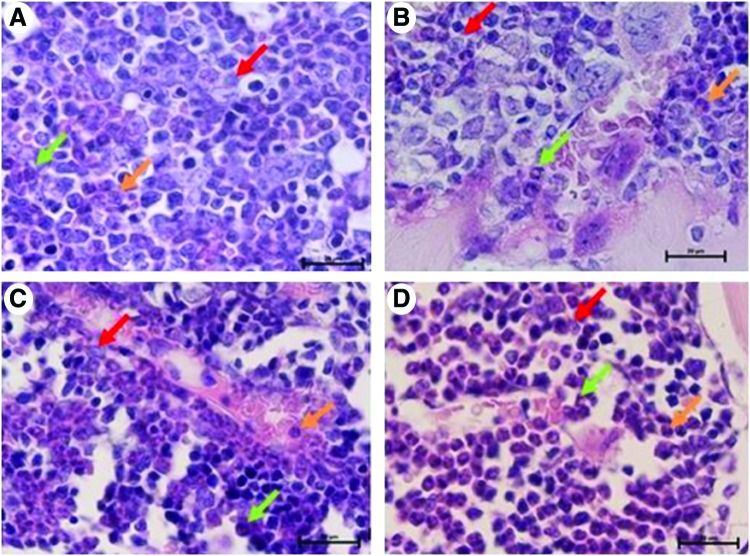
The effects of lactoferrin (LF), an iron binding protein, on myelopoiesis have been studied extensively in vitro and in vivo in human and murine models over the past three decades. Due to the lack of high-quality homologous LFs, however, the conclusions are still unequivocal. Recently, both human and murine LFs have become available as recombinant products expressed in Chinese hamster ovary (CHO) cell lines showing mammalian type of glycosylation, thus apparently species compatible. In this study, we present the effects of homologous recombinant mouse LF (rmLF) on myelopoiesis in CBA mice. The myelocytic lineage has been assessed by their appearance in circulating blood and bone marrow, and induction of relevant mediators of inflammation. Intravenous injection of rmLF (100 μg/mouse) resulted in a significantly increased number of myelocytic cells in the circulating blood after 24 h. Mouse serum transferrin, used as a control protein, showed no stimulatory effect. The increase in output of neutrophil precursors, neutrophils, and eosinophils was correlated with a twofold increase of leukocyte concentrations. The analysis of the bone marrow sections confirmed increased myelopoiesis. The alterations in the bone marrow cell composition were statistically significant regarding mature neutrophils (10.8% vs. 27.7%), metamyelocytes (11.4% vs. 16.0%), and myelocytes (2.4% vs. 4.0%). The mobilization of the myelocytic cells in the bone marrow and the increased output of these cells into circulation were accompanied by elevated serum concentrations of interleukin-6 at 6 h and haptoglobin at 24 h following administration of rmLF. In conclusion, the homologous LF elicits significant and transient myelopoiesis in experimental mice.


Figures

<b>FIG. 1.</b>
FIG. 1.
Analysis of circulating blood cell composition 24 h following administration of LFs. Mice were given LF (1 mg). The results are presented as the mean value of five mice per group. Statistics: Bands: control versus bLF, P=0.0001; control versus rmLF, P<0.0002; control versus rhLF, P<0.0005; neutrophils: control versus bLF, P<0.005; control versus rmLF, P<0.01; control versus rhLF, NS (P=0.75); eosinophils: control versus bLF, NS (P=0.06); control versus rmLF, P<0.025; control versus rhLF, NS (P=0.3); lymphocytes: control versus bLF, P<0.0002; control versus rmLF, P<0.0005; control versus rhLF, NS (P=0.4); monocytes: control versus bLF, P<0.02; control versus rmLF, NS (P=1.0); control versus rhLF, P<0.0005. B, bands; Ne, neutrophils; E, eosinophils; L, lymphocytes; M, monocytes; NS, not significant; LF, lactoferrin; rmLF, recombinant mouse LF; rhLF, human recombinant lactoferrin; bLF, bovine milk-derived LF.
<b>FIG. 2.</b>
FIG. 2.
Analysis of bone marrow cell types 24 h following administration of LFs. Mice were given LF (1 mg). The results are presented as the mean value of five mice per group. Statistics: Neutrophils: control versus bLF, NS (P=0.1699); control versus rmLF, P<0.0005; control versus rhLF, NS (P=0.12); bands: control versus bLF, P<0.05; control versus rmLF, NS (P=0.94); control versus rhLF, NS (P=0.5); metamyelocytes: control versus bLF, P<0.01; control versus rmLF, NS (P=0.08); control versus rhLF, NS (P=0.22); myelocytes: control versus bLF, NS (P=0.5); control versus rmLF, NS (P=0.16); control versus rhLF, NS (P=0.2); other: control versus bLF, P<0.0002; Control versus rmLF, P<0.02; control versus rhLF, NS (P=0.98). Ne, neutrophils; B, bands; Me, metamyelocytes; My, myelocytes; O, other.
<b>FIG. 3.</b>
FIG. 3.
Release of myeloid lineage cells into circulation–determination of optimal dose of rmLF. Mice were given rmLF in the following doses: 25, 100, 500, and 2,500 μg. Samples of blood were taken 24 h after administration of LF. The results are presented as the mean value of five mice per group. Statistics: Bands: control versus rmLF 25, P<0.02; control versus rmLF 100, P<0.0002; control versus rmLF 500, P<0.0002; control versus rmLF 2,500, P<0.01; neutrophils: control versus rmLF 25, NS (P=0.99); control versus rmLF 100, P<0.002; control versus rmLF 500, P<0.05; control versus rmLF 2,500, NS (P=0.9); eosinophils: control versus rmLF 25, P<0.02; control versus rmLF 100, P<0.02; control versus rmLF 500, P<0.0005; control versus rmLF 2,500, P<0.0002; lymphocytes: control versus rmLF 25, NS (P=0.24); control versus rmLF 100, P<0.0002; control versus rmLF 500, P<0.0002; control versus rmLF 2,500, P<0.0005; monocytes: control versus rmLF 25, NS (P=1.0); control versus rmLF 100, NS (P=1.0); control versus rmLF 500, NS (P=0.083); control versus rmLF 2,500, NS (P=0.083). B, bands; Ne, neutrophils; E, eosinophils; L, lymphocytes; M, monocytes.
<b>FIG. 4.</b>
FIG. 4.
Blood cell composition (A) and numbers of circulating leukocytes (B) at 24 and 48 h after administration of rmLF. Mice were given rmLF (100 μg). The results are presented as the mean value of five mice per group. Statistics: (A) Bands: control 24 h versus rmLF 24 h, P<0.001; control 48 h versus rmLF 48 h, P<0.05; rmLF 24 h versus rmLF 48 h, NS (P=0.17); neutrophils: control 24 h versus rmLF 24 h, P<0.0005; control 48 h versus rmLF 48 h, P<0.01; rmLF 24 h versus rmLF 48 h, NS (P=0.069); eosinophils: control 24 h versus rmLF 24 h, P<0.0005; control 48 h versus rmLF 48 h, NS (P=0.20); rmLF 24 h versus rmLF 48 h, P<0.005; lymphocytes: control 24 h versus rmLF 24 h, P<0.0002; control 48 h versus rmLF 48 h, P<0.005; rmLF 24 h versus rmLF 48 h, P<0.02; monocytes: control 24 h versus rmLF 24 h, P<0.0005; control 48 h versus rmLF 48 h, NS (P=0.16); rmLF 24 h versus rmLF 48 h, P<0.005. (B) Control 24 h versus rmLF 24 h, P<0.001; control 48 h versus rmLF 48 h, P<0.05; rmLF 24 h versus rmLF 48 h, NS (P=0.17). There were no statistical differences between control 24 h and 48 h—in figure only 24 h control was shown. B, bands; Ne, neutrophils; E, eosinophils; L, lymphocytes; M, monocytes.
<b>FIG. 5.</b>
FIG. 5.
Composition of the peripheral blood cell picture at 24 h (A) and 48 h (B) following administration of rmLF and mTF—a control protein. Mice were given rmLF and mTF (100 μg). The results are presented as the mean value of five mice per group. Statistics: (A) Bands: control versus mTF, NS (P=0.62); control versus rmLF, P<0.0002; mTF versus rmLF, P<0.0005; neutrophils: control versus mTF, NS (P=0.98); control versus rmLF, P<0.0005; mTF versus rmLF, P<0.002; eosinophils: control versus mTF, NS (P=0.07); control versus rmLF, P<0.0002; mTF versus rmLF, P<0.0002; lymphocytes: control versus mTF, NS (P=0.73); control versus rmLF, P<0.0002; mTF versus rmLF, P<0.0002; monocytes: control versus mTF, NS (P=1.0); control versus rmLF, NS (P=0.12); mTF versus rmLF, NS (P=0.12). (B) Bands: control versus rmLF, P<0.002; neutrophils: control versus rmLF, P<0.002; eosinophils: control versus rmLF, NS (P=0.31); lymphocytes: control versus rmLF, P<0.0002; monocytes: control versus rmLF, NS (P=0.85). B, bands; Ne, neutrophils; E, eosinophils; L, lymphocytes; M, monocytes; mTF, mouse serum transferrin.
<b>FIG. 6.</b>
FIG. 6.
Cellular composition of the bone marrow 24 h (A) and 48 h (B) following rmLF treatment. Mice were given rmLF and mTF (100 μg). The results are presented as the mean value of five mice per group. Statistics: (A) Neutrophils: control versus mTF, NS (P=0.89); control versus rmLF, NS (P=0.06); mTF versus rmLF, P<0.01; bands: control versus mTF, NS (P=0.99); control versus rmLF, NS (P=0.61); mTF versus rmLF, NS (P=0.45); metamyelocytes: control versus mTF, NS (P=0.97); control versus rmLF, NS (P=0.11); mTF versus rmLF, P<0.05; myelocytes: control versus mTF, NS (P=0.19); control versus rmLF, NS (P=0.44); mTF versus rmLF, NS (P=0.98); other: control versus mTF, NS (P=0.38); control versus rmLF, P<0.02; mTF versus rmLF, P<0.0005. (B) Neutrophils: control versus rmLF, P<0.001; bands: control versus rmLF, P<0.02; metamyelocytes: control versus rmLF, NS (P=0.21); myelocytes: control versus rmLF, NS (P=0.48); others: control versus rmLF, P<0.0002. Ne, neutrophils; B, bands; Me, metamyelocytes; My, myelocytes; O, other.
<b>FIG. 7.</b>
FIG. 7.
IL-6 (A) and haptoglobin (B) serum levels. IL-6 concentration was determined at: 2, 6, and 24 h and haptoglobin level was measured at 24 h following rmLF injection. The results are presented as the mean value of seven mice per group. Statistics: (A) Control 2 h versus rmLF 2 h, P<0.05; control 6 h versus rmLF 6 h, NS (P=0.69); control 24 h versus rmLF 24 h, UD. (B) Control versus rmLF, P<0.005. UD, undetectable; IL, interleukin.
<b>FIG. 8.</b>
FIG. 8.
Visualization of myelopoiesis in sections of femurs derived from mice treated under various protocols (1,000× magnification, H&E staining). (A) Control mouse treated with 0.9% NaCl. In the bone marrow, colonies of all cell lineages are seen with a not significant prevalence of the erythropoietic lineage. Within leukopoiesis, the most dominant is myelopoiesis. (B) Control mouse treated with transferrin. The picture does not differ from the previous one. (C) Mouse treated with rmLF after 24 h shows activation of the bone marrow. An increase of the myelocyte number and band forms in bone marrow sinusoids as compared to control mice. (D) Mouse treated with rmLF after 48 h. Even more intense myelopoiesis; the strongest for metamyelocytes, bands, and neutrophils. myelocyte, red arrow; band, orange arrow; neutrophil, green arrow; H&E, hematoxylin and eosin. Color images available online at www.liebertpub.com/scd

Similar articles

Cited by

References

    1. Quinton LJ, Dale DC. and Nelson. S. (2005). Use of colony-stimulating factors for treatment of neutropenia and infectious diseases. In: The Neutrophils: New Outlook for Old Cells. Galbrilovich D, ed., 2nd edn. Imperial Collage Press, London, pp. 301–306
    1. Delano MJ, Kelly-Scumpia KM, Thayer TC, Winfield RD, Scumpia PO, Cuenca AG, Harrington PB, O'Malley KA, Warner E, et al. (2011). Neutrophil mobilization from the bone marrow during polymicrobial sepsis is dependent on CXCL12 signaling. J Immunol 187:911–918 - PMC - PubMed
    1. Chandra R, Villanueva E, Feketova E, Machiedo GW, Hasko G, Deitch EA. and Spolarics Z. (2008). Endotoxemia down-regulates bone marrow lymphopoiesis but stimulates myelopoiesis: the effect of G6PD deficiency. J Leukoc Biol 83:1541–1550 - PMC - PubMed
    1. Noel JG, Valente JF, Ogle JD, Cornelius J, Custer DA, Li BG, Alexander JW. and Ogle CK. (2002). Changes in bone marrow-derived myeloid cells from thermally injured rats reflect changes in the progenitor cell population. J Burn Care Rehabil 23:75–86 - PubMed
    1. Laakko T. and Fraker P. (2002). Rapid changes in the lymphopoietic and granulopoietic compartments of the marrow caused by stress levels of corticosterone. Immunology 105:111–119 - PMC - PubMed

Publication types

LinkOut - more resources